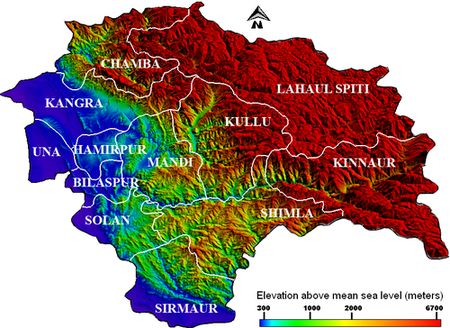
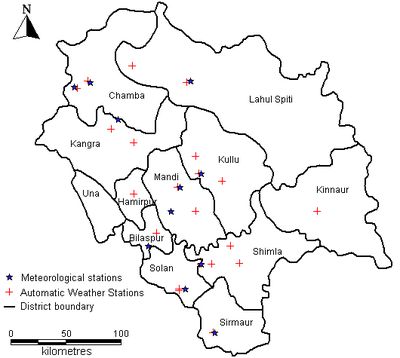
ABSTRACT India ranks fifth in terms of installed capacity (14 GW) of global wind power systems (~200 GW). Commercial wind power based on large-scale wind turbines picked up in the country in 90’s. Improvement in small wind technologies will now provide further impetus to the development of wind based power systems for decentralized applications in a major expanse in India. This study explores wind resource potential in the federal state of Himachal Pradesh characterized by undulating terrain in Himalaya based on validated long term reliable synthesized wind data. Spatial wind profiles based on high resolution data provide insights to the wind regime that helps in identifying potential sites for wind prospecting. The higher altitude alpine zone in Himachal Pradesh has relatively higher wind speeds compared to lower altitude zones. The minimal but reliable surface measurements in the lower altitude temperate and tropical zones indicate the micro climatic influences and spatial variability in the complex Himalayan terrain. The wind potential in Himachal Pradesh supports small wind technologies like agricultural water pumps, wind-photovoltaic hybrids, space/water heaters etc. This would help in meeting the decentralized energy demand sustainably. KEYWORDS: Renewable energy, Wind resource, Potential assessment, Himachal Pradesh, Synthesized wind data, Small wind technologies INTRODUCTION Wind energy has been utilized as a driving source for grinding grains, pumping water and also for sailing. Wind turbines earned prominence in the 19th Century with the advent of electric power generation as local power sources. This renewable energy technology suffered a setback with the highly subsidized centralized fossil fuel based electricity generation and distribution. However, oil crisis of 70’s revived the global interest in wind based decentralized systems. A policy shift was also noticed at this time in India for exploiting its abundant wind energy resource (Wiser, 2000). India has installed 14158 MW of commercial wind power systems since 1983 and the total potential is estimated to be 48561 MW. There is enormous scope of up-scaling through improved technologies. A large extent of the Deccan plateau, coastal states of the Western Ghats and small pockets in the Coromandel Coast have the highest recorded wind energy potential in the country. This includes the federal states of Rajasthan, Gujarat, Madhya Pradesh, Maharashtra, Andhra Pradesh, Karnataka and Tamil Nadu where majority of wind power installations have been deployed (IWEA, 2010). A major expanse of the country is deemed as low wind energy potential areas since resource assessments were performed for large-scale wind turbines based on higher winds. However, a proficient understanding of local wind dynamics with the improvement in the technologies promises sustainable energy from this ubiquitous resource. The advancement in small wind technologies has given stimulus to the distributed energy generation and consumption. Wind energy also has high carbon offset capacity and support the Clean Development Mechanism (CDM) endorsed by the Kyoto Protocol (Indian Wind Energy Outlook, 2009).This reiterates the need for detailed regional wind resource assessment. Wind resource assessment is the primary step towards understanding the wind dynamics of a region (Ramachandra et al. 1997). Wind flow developed due to the differential heating of earth is modified by its rotation and further influenced by the local topography. This results in annual (year to year), seasonal, synoptic (passing weather), diurnal (day and night) and turbulent (second to second) changes in wind pattern (Hester and Harrison, 2003). Increased heat energy generated due to industries and escalating population in urban areas result in heat islands which affects the wind flow as well. Wind characteristics like speed and direction measured at meteorological stations (surface) aid in assessing local wind resources. Wind patterns are observed to be tantamount for regions in proximity. However, local winds have high topographical and land cover influence, and assuming the wind data from a measured site applicable for a nearby site of interest calls for error. Monthly wind speed variation for regions within a radius of 30 km shows similar patterns but with difference in magnitude, and the study suggests using 6 years of long term wind data for satisfactory representation of monthly variations (Mani and Mooley, 1983). A one year wind speed data maintains an error within ± 10% which reduces to ± 3% for 3 years data but still burden the economics of a wind energy based project (Wind Energy, 2010). The surface wind datasets sometime fail to capture the diurnal variations especially during the night hours, giving an elevated estimate of the daily average as wind speeds are generally higher in the daylight (Bekele and Palm, 2009). Despite these complexities, wind resource assessment based on the available surface measurements at different sites using statistical tools have provided satisfactory results (Ramachandra and Shruthi, 2003; Mathew et al. 2002; Elamouri and Ben, 2008; Ullah et al. 2010). The surface wind measurements being a reliable source of information on the wind regime of a region are available for only few sites and are found to be costly and also time consuming for acquiring the data. These gaps make a wider spatial and temporal coverage of wind characteristics difficult. In this regard, models like Wind Atlas Analysis and Application Program (WAsP) and Computational Fluid Dynamics (CFD) based on local topography and climate help in micro–scale (1–10 km) studies of wind resources. These models are validated with the dense surface measurements. They are not applicable for regions with thermally forced flows like sea breeze and mountain winds for which meso–scale (10–100 km) models are preferred. A combination of meso–scale and micro–scale models like the Karlsruhe Atmospheric Meso–scale Model (KAMM/WAsP), MesoMap and Windscape System along with geoinformatics provide reliable wind prospecting and has been tried for different regions (Wind Energy, 2010; Coppin et al. 2003). Today, there are easily accessible wind datasets available from different organizations providing preliminary understanding of the wind regime of a region. High spatiotemporal resolution synthesized wind datasets based on various sources and models are available. Depending on the physiographical features and climatic conditions, these datasets would help for assessing wind potential in the region of interest along with surface wind measurements for validation. Wind resource atlas derived with the help of National Oceanic and Atmospheric Administration (NOAA) and National Aeronautical and Space Agency (NASA) Surface Meteorology and Solar Energy (SSE) data, validated with available surface measurements, provide a range of mean wind speeds on a meso–scale wind atlas for the Newfoundland (Khan and Iqbal, 2004). Similarly an optimistic wind map was prepared with synthesized global datasets of NOAA and NASA SSE for Bangladesh along with many terrain specific characters from surface observations (Khan et al. 2004).The wind energy potential of the Saharan desert in Algeria was assessed based on NASA SSE data. This wind is expected to power an innovative brackish water greenhouse desalination plant and support agriculture in the arid study region (Mahmoudi et al. 2009). Kumar and Prasad (2010) demonstrated the application of NASA SSE data for wind power prospecting in two islands of Fiji. These studies substantiate the advantage and increasing interest in high resolution synthesized data for wind resource assessment. STUDY AREA AND OBJECTIVE Himachal Pradesh is an Indian federal state in the Western Himalayas located between 30.38°– 33.21° North latitudes and 75.77°–79.07° East longitudes, covering a geographical area of 55673 km2 with 12 districts (Statistical Data, 2010). It has a complex terrain with elevation ranging from ~300 m to 6700 m as shown by the Digital Elevation Model (DEM) in Figure 1. Topography, climate, soil and vegetation clearly define the agro–climatic zones in the state. Parts of Una, Bilaspur, Hamirpur, Kangra, Solan and Sirmaur districts less than 1000 m above mean sea level represent the tropical zone. Certain segments of Solan, Sirmaur, Mandi, Chamba and Shimla districts located between 1000 m – 3500 m have climate conditions varying from sub–tropical to wet–temperate. Lahaul Spiti, Kullu and Kinnaur districts ranging between 3500 m – 6700 m are part of the dry temperate, sub–alpine and alpine zones with sparse vegetation and rainfall. Figure 1: Digital Elevation Model (DEM) of Himachal Pradesh The hill state of Himachal Pradesh represents one of the rich biodiversity zones in the country adversely impacted by unplanned development. Dependence on the forests for fuel wood has resulted in decline of vegetation cover, fragmentation of forests and associated ecological imbalance in an ecologically fragile region such as Himalaya, etc.. In recent times, there has been increase in fossil–fuel based energy consumption, with resultant pollution and glacial melting (Aggarwal and Chandel, 2010). This necessitates exploration for clean renewable energy sources like wind etc. Even so, marginality and negligence of this region in the past has led to scarcity of reliable data which hinders efficient resource planning (Bhagath et al. 2006). Historical wind speed records maintained by the Indian Meteorological Department (IMD) are available for 13 stations (Figure 2) in Himachal Pradesh. These data are characterized by large data gaps and non–standard measurement heights. Measurement heights, commencement of wind measurement exercises and duration vary abruptly (Table 1) for 7 stations. The topography of the region renders enormous variation to the micro–climate, wind speed and its direction adding further to the complexity of wind resource assessment. Capturing the wind regime of a diverse geographical entity like Himachal Pradesh using the limited available long term surface data cannot be a desirable option. The Automatic Weather Stations (AWS) installed at 22 locations in Himachal Pradesh (Figure 2) at 2 m has started operating since early 2011 (AWS, 2011). However a minimum one year long data is essential to explore the wind energy in the state which the AWS fail to provide at this point of time. The present study explores the wind resource potential in Himachal Pradesh based on synthesized wind data validated with the select surface wind data of Indian Meteorological Department (IMD). Table 1: Wind stations in Himachal Pradesh maintained by the Indian Meteorological Department (IMD)
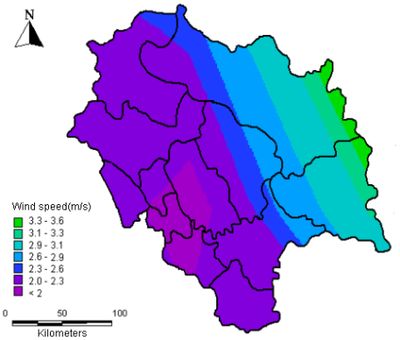
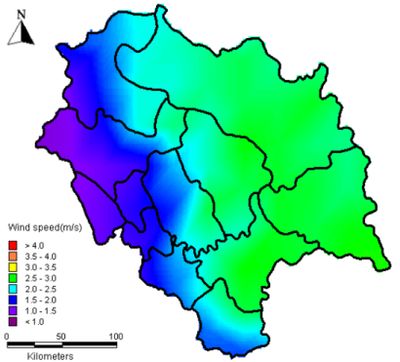
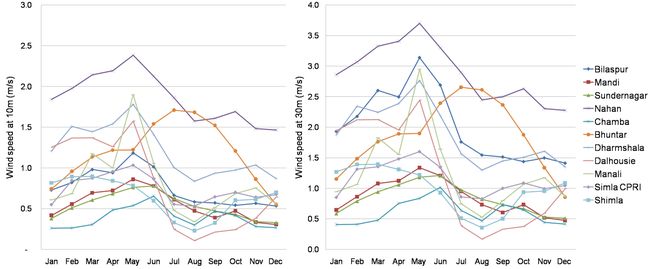
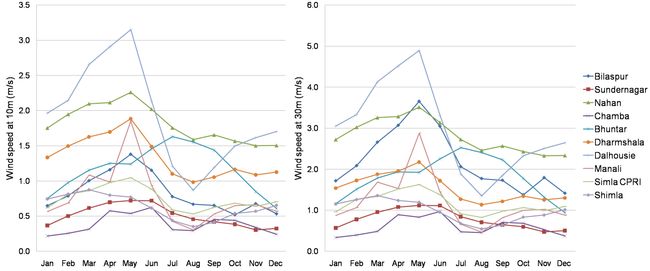
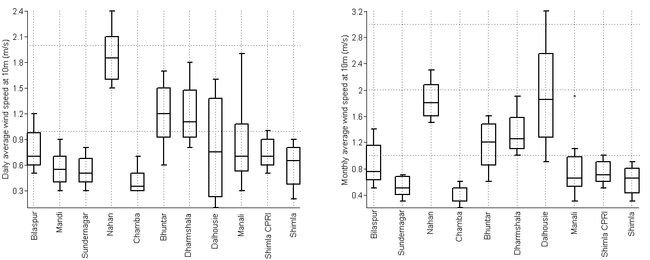
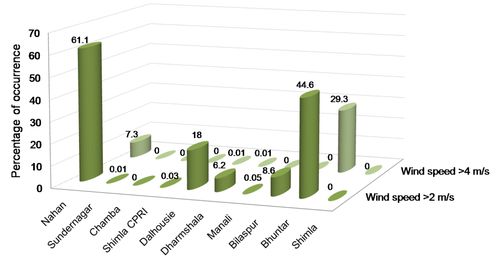
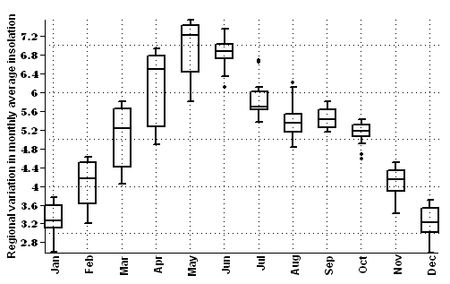
Figure 2: Available wind stations in Himachal Pradesh as on January 11, 2011 DATA, MODELS AND METHODS Wind speeds at different spatial and temporal resolutions were compiled from various sources. NASA SSE datasets include 10 years (1983–1993) average wind speed at 1oX1o global grid derived based on a Global Circulation Model (GCM) applied on satellite data. Every 1oX1o grid represents the average of all data points within that grid (Takacs et al. 1994; NASA, 2010). Based on the NASA SSE wind speeds collected for 10 m, the annual average varies from 2.5±0.6 m/s to 5.8±0.8 m/s at 13 data locations in the state. Studies have shown that NASA SSE wind data exceeds the 25% error margin even for plain regions when compared to surface measurements with consequent errors in the wind power estimates (Kumar and Prasad, 2010). The wind regime obtained for the study region given in Figure 3 shows a latitudinal increase in wind speed from South to North. Himachal Pradesh is a complex terrain with features like vegetation and local relief influencing the wind regime. The NASA SSE wind data has been derived for plain landscapes (airport–like) and hence minimally used for further analyses. NOAA–CIRES 20th Century Reanalysis Version 2 data for 138 years (1871–2008) based on a global data assimilation system and surface pressure observations is available at 2oX2o spatial resolution (NOAA, 2011). Long term wind speed average illustrated in Figure 4 shows annual values of 3.6 m/s for Himachal Pradesh. While the NOAA–CIRES annual wind speed values are not exaggerated like NASA SSE, the low resolution of the data (with only 9 data points) inherently neglects the topographical influences of the study region. However, the wind regime shows an increase in wind speed with the altitude of the region coherent with the changing agro–climate zones. However, for Himachal Pradesh with undulating terrain, a higher spatial resolution wind speed data addressing the geographical parameters would be desirable. Figure 3: Annual average wind speed based on 1oX1o resolution NASA SSE data Figure 4: Annual average wind speed based on 2oX2o resolution NOAA–CIRES reanalysis data The Climate Research Unit (CRU) at the University of East Anglia maintains climatic averages of variables including wind speed for the period of 1961–1990 compiled from different sources with the inter and intra variable consistency checks to minimize data consolidation errors. The Gobal Land One–km Base Elevation Project (GLOBE) data of the National Geophysical Data Center (NGDC) were re–sampled to 10’X10’ elevation grids where every cell with more than 25% land surface (those below 25% being considered water bodies) represent the average elevation of 100–400 GLOBE elevation points. The climatic average of wind speeds measured at 2 m to 20 m anemometer heights (assumed to be standardized during collection) collated from 3950 global meteorological stations together with the information on latitude, longitude and elevation were interpolated based on a geo–statistical technique called thin plate smoothing splines. Elevation as a co–predictor considers topographic influence on the wind speed and proximity of a region to the measuring station improves the reliability of the interpolated data. During interpolation inconsistent data were removed appropriately. This technique is identified to be steadfast in situations of data sparseness or irregularity. The wind speed as a climatic average is obtained for all global regions (excluding Antarctica) at 10’X10’ resolution (New et al. 2002). This high resolution data mapped for the study region of Himachal Pradesh shows the annual average wind speed varying with the altitudinal gradient (Figure 5) as observed in the case of NOAA–CIRES data. On a preliminary observation, the wind speed values range well within the surface measurements obtained from IMD. Compared to other collated datasets, wind data from CRU is prudent for a meso–scale (10–100 km) study in the tough Himalayan terrain of Himachal Pradesh. Figure 5: Annual average wind speed based on 10’X10’ resolution CRU data Wind resource potential assessment The monthly average wind speed data obtained from the CRU databank were used to produce monthly wind atlases for Himachal Pradesh. Nearly 400 data points covering the entirety of the land area were spatially analysed using Geographic Information Systems (GIS). The monthly average wind speed atlases for all the months hence obtained are enriched with isotachs (lines connecting regions with equal wind speed) showing regional wind speed variations. The Indian Meteorological Department (IMD) provided surface wind data for 10 stations of Bilaspur, Sundernagar, Nahan, Chamba, Bhuntar, Dharmshala, Dalhousie, Manali, Simla CPRI and Shimla measured for different durations (Table 1). Wind speed at Mandi was obtained from a literature on wind climatology in India (Mani and Mooley, 1983). However, these locations are not representative of the diverse topography of Himachal Pradesh. The measured data include synoptic hour values (local time 8:30 and 17:30 hrs), daily averages for durations between synoptic hours and also monthly averages (not available for Mandi) of wind speed. Daily averages of wind speeds are obtained by averaging the mean for two 12 hour periods starting from 17:30 hrs capturing the diurnal variations of the resource. Wind measurements are standardized to 10 m using equation 1 as per World Meteorological Organization (WMO) norm (Ramachandra et al. 1997). V/Vo = (H/Ho)α …………(1) where Vo is the measured wind speed, V is the standardized wind speed, Ho is the measured height, H is the desired height (10 m) and α is the power law index. α is a measure of roughness due to frictional and impact forces on the ground surface which varies according to terrain, time and seasons. The valueof α calculated for most of the regions representing the Himalayan terrain are well above 0.40 based on long term observations and calculations (Mani and Mooley, 1983). In order to reduce extrapolation errors we consider the least value of 0.40 for Himachal Pradesh. The wind measurement heights varying widely from 1.7 m to 26.5 m for different sites in Himachal Pradesh are standardized based on the power law equation with α=0.4. It is observed that wind speed increases with height within the atmospheric boundary layer. Wind speed at 30 m is estimated to explore the possibility of energy utilization with the available wind technologies. The meso–scale wind regime for Himachal Pradesh is generated using CRU data and validated with the surface measurements. RESULTS AND DISCUSSION The seasonal as well as spatial variation of average wind speed for Himachal Pradesh portrayed in Figure 6.1 and 6.2 respectively show increased wind speed during summer (February to June) which declines during southwest monsoon (June to September) and remains even during winter (November–February). The surface measurements from the IMD stations illustrated in Figures 7.1 and 7.2 conform with the earlier results (Figure 6.1 and 6.2). Most of the sites recorded peak wind speeds during the period of May–June. A minor influence of the northeast monsoonal winds originating from Central Asia is observed in the months of October and November in some sites recorded. The cold winter months of December and January witness calm breeze awaiting a surge in the forthcoming summer towards mid–February. The daylight average wind speed (at 8:30–17:30 hrs) is higher than the dark hours (at 17:30–8:30 hrs) for all the months recorded by IMD. These trends are quite prevalent in most of the sites although exceptions due to the micro climatic influences on wind speed are also observed. From the CRU wind atlases obtained, the spatial variation of wind speed is observed to be explicitly influenced by the elevation and resultant agro–climatic zones of Himachal Pradesh. It is known that the density of vegetation cover reduces with increasing elevation and facilitates higher wind flow. The dependence on elevation could be inherent from the interpolation technique followed by CRU. However, there are certain pockets of high wind speeds irrespective of elevation observed in the CRU wind regime distribution due to the complexity of the topography captured in the model. According to the wind regime, an increasing trend of wind speed is observed from lower altitude tropical zone (< 1000 m) towards higher altitude alpine zone (> 3500m) with the monthly average varying from 0.6 to 4 m/s throughout the state. The lower altitude tropical zone including Kangra, Una, Bilaspur, Hamirpur and parts of Chamba, Mandi, Solan and Sirmaur experience wind speeds ranging from 0.6–3 m/s following the seasonal trends already discussed. The middle altitude zone (1000–3500 m) covering Shimla, Kullu and parts of Mandi, Chamba, Solan, Sirmaur and Kinnaur represent wet to dry temperate regions. The wind speed in this zone is seen to vary from 1.3–4 m/s. Further upwards, the high altitude zone of Lahaul Spiti, Kinnaur and Kullu report 2–4 m/s annually. This zone has appreciable wind potential compared to other regions. The wind speed ranges marked by altitudinal gradients of agro–climatic zones provide a preliminary insight into the wind regime of Himachal Pradesh. The NOAA–CIRES annual average wind atlas (Figure 3) also validates this trend. The surface measurements aided in understanding the seasonal variations and dynamics. However, the magnitude of wind speeds obtained are not truly representative of the respective agro–climatic zones. Terrain and vegetation immensely influences the wind speed and hence each site represents a micro locality within the respective zone. These sites are mostly located in the low and middle altitude zones ranging from tropical to dry–temperate (< 3500m) which experience a wind speed range of 0.6–4 m/s as shown by the CRU data based wind atlases. The standardized monthly average wind speeds given in Figure 8 for these sites show the annual variation from 0.3–3.2 m/s. Most of these sites (except Shimla) measured wind speed below 10 m, and the assumption of standardized measurements for data sparse sites could be an underestimate according to equation 1. Hence, the actual wind speeds in many of the data sparse sites may be higher at 10 m. None of the available sites represent the higher altitude alpine zone where the highest wind speeds are observed in the wind atlases. These data gaps and ambiguities could be rectified in long term monitoring through recently installed AWS wind speed measurements with relatively better spatial coverage for 22 stations spread across Himachal Pradesh. Availability of more number of reliable wind measurement stations and detailed analysis of terrain features could facilitate micro–scale wind resource assessment in Himachal Pradesh. In the case of surface measurements projected to a height of 30 m (Figures7.1–7.2), the annual average monthly wind speeds for Bilaspur, Nahan and Dalhousie are above 2 m/s with the highest average of 3 m/s at Dalhouise. At the same height more than 61% of measured hours in Nahan, 44% in Bhuntar and 18% in Dalhousie obtained wind speeds above 2 m/s, while more than 29% of the measured hours crossed 4 m/s wind speeds in Bhuntar (Figure 9). The annual averages of 1.9 m/s daily wind speed at 30 m for Bhuntar and Dharamshala are also significant. Most of the other sites recorded annual average daily and monthly wind speeds below 1.3 m/s. As noted earlier, there could be possible but unavoidable underestimations in these values. Figure 6.1: Wind regime for the months of January – June Figure 6.2: Wind regime for the months of July – December Figure 7.1: Daily average wind speeds at 10 m and 30 m for surface observations Figure 7.2: Monthly average wind speed at 10 m and 30 m for surface observations Figure 8: Wind speed variations for standardized surface observations Figure 9: Percentage occurrence of winds above 2 m/s and 4 m/s from hourly readings projected to 30 m hub height Utilizing the wind resource in Himachal Pradesh With the advancements in wind turbine technologies listed in Table 2, small–scale power generation at moderately low wind speeds is now technically feasible and also economically viable. It has been shown that small–scale wind turbines are more attractive in terms of deployment, functioning and management compared to commercial setups (Ramachandra et al. 1997). Himachal Pradesh being well connected by the electricity grid could support grid–connected wind power in the state. The sparse population densities also demand decentralized energy generation. Small wind turbines are used in conjunction with diesel generators especially in remote areas (Clausen and Wood, 1999). However, wind–diesel hybrid solution cannot assure sustainability since reduction in wind speeds must be compensated with more fossil fuel supply so as to maintain the output. High resolution spatial data from NASA SSE (NASA, 2010) shows that Himachal Pradesh receives monthly average global insolation (incoming solar radiation) above 4 kWh/m2/day (Ramachandra et al. 2011) except for the winter months of December and January (Figure 10). Higher altitude alpine zone (> 3500 m) receive lower insolation values but higher wind speeds. This trends inverts in lower altitude tropical zone i.e higher insolation and lower wind speeds. Hence wind–photovoltaic hybrids could be considered for decentralized power generation throughout the state. Similar proposals for wind–photovoltaic hybrids have been observed in regions with low wind speeds (Cabello and Orza, 2010; Ramachandra et al. 2011). Wind pump for drawing water is an attraction for rural energy needs (Mathew et al. 2002). The agriculture intensive sub–tropical to wet–temperate zone of Himachal Pradesh gets benefited by wind pumps which function at wind speeds above 2 m/s. As seen in Nahan and Bhuntar, increased hub heights could deliver prolonged winds. Wind based space heating systems have been analysed to be cost effective compared to many conventional fuel sources like firewood and electricity (Jaber et al. 2008). The cold alpine zones of Lahaul Spiti and Kinnaur where the wind speeds are relatively higher, could meet their space heating requirements through wind energy. Development of wind energy based water heaters is promising for such regions (Tudorache and Popescu, 2009). This ensures reduced dependence on fuel wood and coke which currently warm them during harsh winters. Table 2: Available small wind turbines
Source: (Wind Energy, 2010)
Figure 10: Global insolation (kWh/m2/day) received in Himachal Pradesh Constraints Wind technologies could be deployed only after assessing the wind characteristics, land availability and socioeconomic impact. Wind characteristics like speed, power density, turbulence and vertical profile variations influence the design of wind turbines for purposes like power generation, battery charging, water pumping or space heating. Technology deployment could be initiated only with long term surface wind measurements at specific locations which are invariably influenced by the local terrain features. This assessment of wind resource potential in Himachal Pradesh shows minimal potential for large scale power generation in the state. Land availability for small turbines may not be a serious constraint. However, increased hub heights even for small turbines could be at the cost of the soil strength and land stability. Success of wind technology demands regular monitoring and sustained maintenance. Employment generation through appropriate mechanisms mobilizes the local people in these efforts. More importantly, resolute organizational support will ensure smoother penetration of wind technologies for sustainable development in Himachal Pradesh. CONCLUSION This study addresses the increasing need for detailed wind energy resource assessment in remote regions like Himachal Pradesh which also faces serious ecological threats. Due to sparse and unreliable surface wind measurements available and expensive modeling alternatives, proven and authentic synthesized data were scrutinized for suitability in the study region. High resolution wind atlases hence generated, quantifies the increasing wind speed with altitudinal gradients and varying agro–climatic zones. While the higher elevation (> 3500) alpine zone is identified as a suitable candidate for further wind exploration, the lower elevation zones cannot be neglected as shown by the surface measurements. Certain small wind technologies suitable for the study region have been discussed, while also mooting the possible constraints of dissemination. Meeting the energy demands through clean resources like wind envisions a sustainable future for Himachal Pradesh as well as other regions neglected in the conventional wind assessment studies. ACKNOWLEDGEMENT We thank the Indian Meteorological Department (IMD) for providing the surface wind measurements for Himachal Pradesh and NASA, NOAA and CRU for making the global wind speed databanks available for use. We are grateful to NRDMS, Ministry of Science and Technology, DST, Government of India and Indian Institute of Science for the financial and infrastructure support. REFERENCES
|