Abstract Rapid changes in the land use and land cover of a region have become a major environmental concern in recent times. This has lead to unsustainable development with the reduction of green spaces and also changes in local climate and formation of urban heat islands (UHI). Monitoring and management of land use dynamics would help in land use planning and mitigation of environmental impacts. The main goal of this paper is to quantify the changes in the land cover and consequent changes in land surface temperature. Land use and land cover dynamics were assessed using temporal remote sensing data (Landsat Thematic Mapper and Enhanced Thematic Mapper data) of Himachal Pradesh, India. The thermal infrared bands of the Landsat data were used to retrieve Land Surface Temperature. The results revealed that there was a huge increase in Urban Area (including Barren land), which is the causal factor for the changes in Land Surface Temperature. Overall, Remote sensing and Geographic Information System technologies were effective approaches for monitoring and analyzing urban growth patterns and evaluating their impacts on Land Surface Temperature. Keywords : Land Surface Temperature, Landsat, Land Use, Land cover, NDVI. Introduction Land cover changes induced by human and natural processes play a major role in global as well as at regional scale patterns of the climate and biogeochemistry of the Earth system. Studies have revealed of changes in water cycling process between land and atmosphere due to the large scale land cover changes, affecting the local to regional climate. Geoninformatics technologies such as remote sensing and geographic information systems are very effective in measuring monitoring and predicating the land use/cover changes (Qihao Weng, 2009; Enner et al., 2010). Timely information with higher accuracy of landuse (LU) Land cover (LC) changes is crucial for long-term planning, economic development, and sustainable management(Zhang et al., 2010) of natural resources. The analysis of temporal remote sensing data helps in understanding the land cover changes and its impact on the environment. The thermal infrared bands of remote sesning data of space borne sensors help to retrieve Land Surface Temperature (LST). Land surface temperature is the measure of the heat emision from land surface due to various activities associated with the land surface. Increase in paved land cover is an indication of concentrated human activities, which often leads to increased LST’s (Ramachandra and Kumar, 2009). Increased LST in certain urban pockets in comparison to its surroundings consequent to the increase in paved surfaces is known as urban heat island (UHI) phenomenon (Landsbeg, 1981; Gallo and Owen, 1998, Li et al., 2004). Detection of the thermal charecteristics of land surface using remote sensing data of space borne sensors and the analysis of land surface temperature (LST) has been reported earlier (Rao, 1972). Spatio-temporal data were used to develop models of land surface atmosphere exchange, and to analyze the relationship between temperature and land use and land cover (LULC) in urban areas (Voogt and Oke, 2003) highlighting the relationship between LST and surface characteristics such as vegetation indices (Carlson et al., 1994; Carlson 2007; Owen et al., 1998). Also, the studies reveal the effect of biophysical factors on LST by using vegetation fraction instead of qualitative LULC classes (Gallo and Tarpley, 1996; Owen et al., 1998; Dousset and Gourmelon, 2003). The vegetation index–LST relationship has also been used to retrieve surface biophysical parameters (Carlson et al., 1994), to extract sub-pixel thermal variations (Kustas et al., 2003), and to analyze land cover dynamics (Lambin and Ehrlich, 1996). Many investigators have observed a negative relationship between vegetation index and LST, leading to further research into two major pathways, namely, statistical analysis of the relationship and the temperature/vegetation index (TVX) approach. TVX is a multi-spectral method of combining LST and a vegetation index (VI) to monitor their associations. Land surface and atmospheric temperatures rises by various antropogenic activities like increased land surface coverage by artificial materials, energy consumption, which have a high heat capacity and conductivity, and is also associated with the decreases in vegetation and water surfaces, which are the major factors that reduce surface temperature through evapo-transpiration (Kato and Yamaguchi., 2005). Temperatures can be monitored through space borne remote sensing(rs) sensors, which account for the top of the atmosphere (TOA) radiances in the thermal infrared (TIR) region. TOA radiance is the net radiance of the emitted radiance from the earth’s surface upwelling radiance from the atmosphere, and downwelling radiance from the sky. The brightness temperatures (also known as blackbody temperatures) can also be derived from the TOA radiance (Dash et al., 2002). These brightness temperatures account for the various properties of the land surface , the amount and nature of vegetation cover , the thermal properties and moisture content of the soil (Friedl, 2002). However, lack of knowledge of spectral emissivity can introduce an error which ranges from 0.2 to 1.2k for mid-latitude summers and 0.8 to 1.4k for the winter conditions for an emissivity of 0.98 and at the ground height of 10km (Dash et al., 2002). Two approaches have been developed to recover LST from multispectral TIR imagery (Schmugge et al., 1998) as on date. The first approach utilises the radiative transfer equation to correct the at sensor radiance to surface radiance, followed by an emissivity model to separate the surfaces radiance into temperature and emissivity (Friedl, 2002). The second approach applies the split window technique for sea surfaces to land surfaces. Assuming that the emmisivity in the channels used for the split window is similar (Dash et al., 2002). TIR region corresponding to 8-14 µm in the electromagnetic spectrum is being used quantifying the thermal urban environment. Landsat satellites, are one of the most widely used for environmental studies. Landsat thematic mapper is composed by seven bands, six of them in the visible and near infrared, and only one band located in the thermal infrared region (with an effective wavelength of 11.457 µm) is used for LST retrieval. Possesing only one thermal band might be stated as an disadvantage/limitation in order to obtain LST as it does not allow the application of a split-window method (Sobrino et al., 1996) neither a temperature/emissivity separation method (Gillespie et al., 1998; Snyder et al., 1998) to obtain information about the emissivity spectrum of natural surfaces. The objective here is to investigate the Land Surface Temperature with Land use dynamics to understand the Urban Heat Island phenomenon in Himachal Pradesh considering Multi -senor, Multi-resolution and temporal RS data acquired through space borne sensors. This involved:
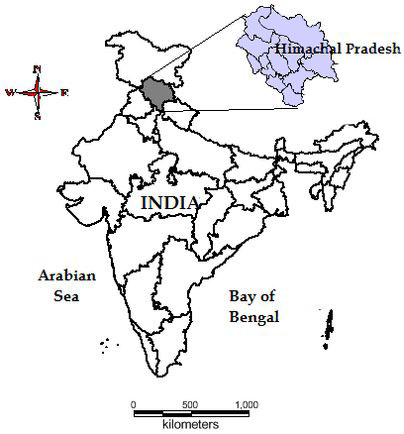
Study area: This analysis has been carried out for Himachal Pradesh, which lies between the Latitudes :30o 22' 40"N to 30o 12' 40"N, Longitude:75o 47' 55"E to 79o 04' 20"E (figure 1). LST was computed for a region lies between the latitudes: 30o 18' 30"N to 30o 10' 30"N and Longitude: 76o 19' 35"E to 78o 59' 10"E and covers Shimla. Figure 1: Study area - Himachal Pradesh, India Himachal comprises of 12 districts in total, covering the area of 55,673 sq km. Its total population is 6,077,248 as per 2001 census. Shimla is the state capital of Himachal Pradesh, with its population around 7,21,745 as per 2001 census with geographical area of 5131 sq. km. Density of population in Himachal Pradesh is 109 per sq. kms. Himachal Pradesh is one of the Major Indian state undergoing rapid urbanisation. Labour Force has about 49.3% of total population employed in Industrial sectors. Industries located in Himachal as on 31/03/2010 are 36845 (micro, small, medium and large Enterprises) of which 444 are in medium and large scale industries. Data: The data used were from Landsat series thematic mapper (28.5m) and enhanced thematic mapper (28.5m) data acquired over years 1989 to 2010. Collateral data includes google earth imagery (http://earth.google.com) and Survey of India top sheets. Methodology: The RS data used to study the temporal changes in landscape pattern were Landsat Thematic Mapper (TM), Landsat Enhance TM Plus (ETM+) of 1989 to 2006. The data were georeferenced, rectified and cropped pertaining to the study area. Landsat ETM+ bands of 2010 were corrected for the SLC-off by using image enhancement techniques, followed by nearest-neighbour interpolation.
LC was determined through the computation of Normalised Difference Vegetation Index (NDVI) using Landsat visible Red (0.63 – 0.69 µm) and near-infrared band (0.76 – 0.9 µm) bands of Landsat TM/ETM. NDVI was computed in order to calculate emissivity for computing LST. NDVI is given by
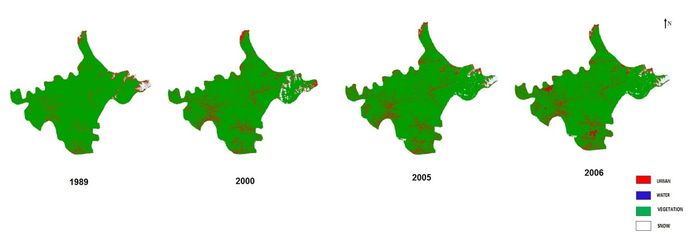
Results and Discussion The Classified images from 1989 – 2006 showed an overall accuracy of 76%. Land Use changes were more prominent in the area during the last 2 decades consequent to increase in Barren land as indicated in Table 1 and Represented in Figure 2. The LU analysis shows that there has been 55% increase in urban and open areas during 1989-2000 and 39% increase during 2000-2005, and 18.92% increase during 2005-06. This land cover changes has also influenced the local climate. The minimum (min) and maximum (max) temperature was found to be -2º C and 31º C from Landsat Data as tabulated in the Table 2. The analysis showed that there has been an increase in Temperature from 1989 to 2006 as evident from temporal analysis. Figure 2. Land use classification in 1989, 2000, 2005 and 2006 Table 1: Land use changes in Himachal Pradesh
Table 2: Land surface Temperature changes in Himachal Pradesh
The temperature drawn by the study are, in the year 1989 minimum 30 C and maximum 270 C, where as in the year 2006 the minimum -20 C and maximum 310 C ( given in Table 2), which highlights that LU characteristics play a significant role in maintaining the ambient temperature and also in the regional heat island phenomenon. Correlation analysis shows that the vegetation and water bodies are negatively correlated with temperature suggesting that these LU aid as heat sinks and hence maintains the regional climate. The population of this region exceeds its carrying capacity and is exerting pressure on the local natural resources such as land, water, etc. (MOEF,1992; Graymorea et al., 2009). Conclusion: The LU analysis shows that there has been 55% increase in urban and open areas during 1989-2000 and 39% increase during 2000-2005, and 18.92% increase during 2005-06. This land cover changes has also influenced the local climate. The minimum (min) and maximum (max) temperature was found to be -2º C and 31º C. This study clearly shows that the rate of increase in the urbanisation leads to change in the Land Surface Temperature. The increase in the temperature is in the range of 30 C to 40 C during 1989 to 2010. Change detection techniques from multi-resolution images integrating spectral, structural and textural features to generate changed patches and change attribute is also desirable and a challenging area of research. Acknowledgement We are grateful to NRDMS Division, The Ministry of Science and Technology, Government of India for the financial support. References
|
 ……. ………. 1
 ……………. (2)