|
Regional Bioenergy Planning for Sustainability in Himachal Pradesh, India |
|
ABSTRACT
Energy system in mountain regions is complex due to the wide variations in availability and demand of energy resources. Mountain inhabitants are traditionally dependant on bioenergy resources like fuelwood, agro and animal residues for meeting their energy requirements for heating, cooking, etc. However, depleting forest resources limit availability of fuelwood while commercial sources like LPG and kerosene fail to meet the domestic energy demands due to logistic and economic constraints. Hence, the inhabitants are forced to follow inefficient and ad hoc usage of juvenile forest trees (thus hindering regeneration), agro and animal residues disregarding their alternative utilities. This deteriorates the ecological harmony and demands for sustainable resource planning in the regional level. The study assesses the bioresource availability and its potential to meet the bioenergy demands of three mountain districts in the Western Himalayan federal state of Himachal Pradesh. Regions of bioenergy surplus or deficit are identified for different scenarios. The ecological status of forests and actual availability along with the demand of fuelwood in villages are analyzed to highlight the significance of decentralized regional level bioenergy resource planning. BEPA: Bioenergy potential assessment – A Decision Support System (DSS) to facilitate compilation, analysis, representation, interpretation, comparison and evaluation of regional bioresource has been used to visualize bioenergy status. This supports energy planners and policy makers in efficient disaggregated bioenergy resource planning to meet the subsistence and development needs of mountain inhabitants at least cost to the environment and economy.
INTRODUCTION
Mountain regions are unique in terms of their landscape, climate, vegetation, economic activities and socio–cultural aspects. The mountain inhabitants are traditionally dependent on natural resources for their livelihood. Development in these regions historically neglected the diversity and heterogeneity of their ecosystems [1]. As a consequence of the landscape changes due to natural and anthropogenic influences the ecological integrity and resource sustenance are under serious threat. Clearance of forest resources for fuelwood, fodder, timber, industrial products and agriculture has ensued in forest fragmentation resulting in human–animal conflicts and scarcity of resources. Even though governmental regulations restrict illegal felling of forest trees, this process continue rampantly depleting forest cover, degrading soil fertility, eroding top productive soil layer and flooding the plains [2]. The holistic and sustainable development of mountain regions is essentially linked to the management of natural resources and improvements in the conversion and end use of energy through viable eco–friendly alternate technologies. Bioenergy from combustion of bioresources like fuelwood (including dry litter of leaves, twigs etc), agro residues (stalk, straw, cobs, husk, bagasse etc) and animal residues has been a traditional predominant energy source for heating and cooking in the mountainous rural energy system. Trees grown on agricultural margins and forests are the major source of fuelwood. It is observed that more than 70% of the total energy consumption of Western Himalayan mountain regions is met by traditional sources of which nearly 60% is fuelwood. Over 90% of this fuelwood is consumed in households for heating and cooking [3]. Agro residues classified as field–based residues (straw, stalk, cobs etc) are used sparingly as fuel apart from fodder and mulch while process–based residues (rice husk, sugarcane bagasse, etc) are usually discarded. Scarcity of fuelwood in recent times has forced people to depend more on agro residues for domestic heating and cooking needs, leaving the crop lands unfertile. This subsequently has affected the crop yield resulting in further clearance of forests for cultivation. Apart from these, forced dependence on pine cones, tree bark and weeds with high ash content and low heating values has increased indoor pollution affecting especially women and children [4]. Livestock is the major source for manure, dairy, meat and draught. Due to the scarcity of fuel wood, rich dried dung–cake as alternative fuel deprives agriculture field of nutrients apart from causing pollution on direct burning. Stoves used for burning in mountain areas vary with altitude and most of them are traditional devices with low thermal efficiency [5]. Transition to commercial energy sources like kerosene and LPG at subsidized rates is noticed in urbanizing landscapes, although there are logistic and economic constraints in supply [3]. Thus, the alternative bioresources as well as commercial sources fail to reduce the burden on forest cover.
Energy demand and supply dynamics in mountain regions are complex due to the spatial variations in availability and accessibility of resources and their differing usage along altitudinal gradients. This complexity demands detailed studies for improving the regional energy system [2]. Reducing inefficient use of fuelwood and encouraging conservative use of alternative bioresources in meeting the energy demand ensures ecological sustainability. This necessitates the assessment of bioenergy availability (supply) and consumption (demand) to identify the bioenergy surplus or deficit status of mountain regions for efficient, integrated and sustainable resource planning.
Resource planning at aggregate level neglects the regional paucity of resources and the crisis faced by the inhabitants in meeting their domestic energy demands without feasible alternatives. Regional information on energy resources and patterns of human dependence is vital for efficient planning. The basis of regional integrated energy planning is the preparation of area based decentralized energy system to meet the subsistence and development needs at the least cost to the environment and economy. This considers all the socioeconomic and ecological factors of a region essential for long term success of the intervention. Decision making involves data compilation, analysis and visualization of various scenarios. In this context, regional energy plan through a Decision Support System (DSS) provides an interactive user friendly platform with options to compile, analyze, interpret and visualize the information. DSS essentially consists of database, modeling and dialogue management subsystems [6]. BEPA (Bioeneergy Potential assessment) – A DSS designed for bioresource assessment accounts for the bioenergy availability to demand status of realistic scenarios in the regional level. It facilitates the collection and analysis of available information, the projection of future conditions and the evaluation of alternative energy solutions for conservative resource planning [7]. DSS based bioenergy resource assessment and planning has been proposed in many regions [8, 9, 10, 11]. Regional bioenergy planning and execution through DSS potentially resolves the energy and environmental issues faced by the mountain regions. The present study assesses bioenergy resource status of three representative mountainous districts in the federal state of Himachal Pradesh located in Western Himalayas. This includes the causal factors for degradation of resources, levels of forest fragmentation etc.
Objectives: Main objectives of this study are
- quantification of bioresources availability,
- demand assessment,
- assessment of levels of degradation through forest fragmentation analysis; and
- visualization of levels of degradation
STUDY AREA
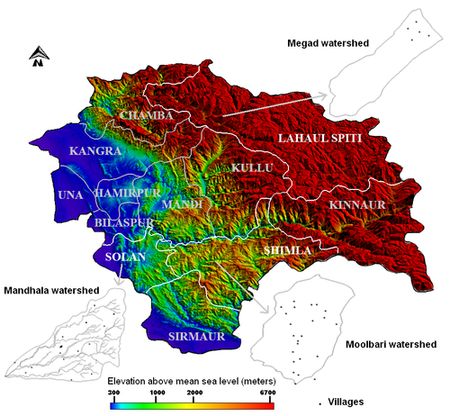
Himachal Pradesh is located between 30.38°– 33.21° North latitudes and 75.77° – 79.07° East longitudes, covering a geographical area of 5.57 million ha with 12 districts [12]. The agro–climatic zones in the state are defined by altitude, climate, soil, precipitation and other geophysical parameters. It has a complex terrain with altitude ranging from 300 to 6700 m as shown by the Digital Elevation Model (DEM) in Figure 1. Almost one–third of the area is snow covered for seven months and forms the origin for many rivers. Regions above 4500 m experience perpetual snowfall and rainfall vary from 50 to 2600 mm along different altitudinal zones [13]. Climate, soil as well as biotic factors in the past (forest fire, shifting agriculture, grazing, etc.) influences the type of vegetation along with other factors like solar radiation, temperature, moisture, geology etc. The major vegetation types found in Himachal Pradesh are tropical, sub–tropical, wet temperate, dry temperate, sub–alpine and alpine, varying with altitudinal gradients and often overlapping due to changes in climate [14].
The study area covers three districts of Solan, Shimla and Lahual Spiti, focusing on three watersheds of Mandhala, Moolbari and Megad inhabiting village clusters (Figure 1). These watersheds and districts are representative of the different agroclimatic zones in the hill state of Himachal Pradesh. The respective watersheds provide village level insight significant for the regional study. The physiographic information of the districts and watersheds are summarized in Table 1.
Table 3: Physiographic information of the study region
| District |
Altitude (m) |
Area (ha) |
Rainfall (mm) |
Population density (no:/sq km) |
| Solan |
316 – 2209 |
193600 |
1179–1899 |
258.6 |
| Shimla |
713 – 4984 |
513100 |
847–1330 |
141 |
| Lahaul Spiti |
2043 – 6514 |
911165 |
332–803 |
2 |
| Watershed |
Latitude (°N) |
Longitude (°E) |
Altitude (m) |
Area (ha) |
River associated |
| Mandhala(Solan) |
30.87–30.97 |
76.82–76.92 |
400–1100 |
1453 |
Yamuna |
| Moolbari(Shimla) |
31.07–31.17 |
77.05–77.15 |
1400–2000 |
1341 |
Yamuna |
| Megad(Lahaul Spiti) |
32.64–32.74 |
76.46–76.74 |
2900–4500 |
1050 |
Chandrabhaga |
Figure 1: Digital Elevation Model (DEM) representing the three districts and village clusters in respective watersheds
Woody biomass
Net Primary Productivity (NPP) of vegetation is the annual increment (t/ha/yr) in total standing biomass of the vegetation. Litterfall includes woody biomass shed from forests including leaves, twigs, branches etc used as fuelwood [15]. The biomass and NPP in Himalayan forests increases from tropical to temperate and then decreases towards alpine [16]. The above ground tree biomass ranges from 80 to 400 t/ha. Litterfall in Central Himalayas for an altitudinal range of 350–2250 m varies between 4.2–7.8 t/ha/yr. Of the litterfall in Himalayan forests, contribution of wood is 9–20% and leaves range between 54–82% [17]. The vegetation types as well as biomass and NPP of representative forests and tree species found in Himalayan terrain are summarized in Table 2 [18–36]. Tropical vegetation dominated by broadleaved tree species is found below 1000 m in major parts of Solan and minor parts of Shimla districts. The tree biomass ranges from 58.7 to 136.1 t/ha and NPP from 5.9 to 22.7 t/ha/yr. Dominance of Lantana Camara weed is noticeable in the hilly tracts degraded by anthropogenic activities. Plantations of Acacia catechu are frequented here. The sub–tropical vegetation found in Solan and Shimla at an altitude range of 900 to 1500 m is characterized by chirpine (Pinus roxburgii) forests. Chirpine has high regeneration potential and caters to the fuelwood needs of the dependants. The vegetation also includes mixed oak forest of Quercus leucotricophora, locally called as Banj oak. The tree biomass of sub–tropical vegetation ranges from 113 to 388 t/ha with NPP of 7.6 to 18.9 t/ha/yr. Beyond the transitional stage of sub–tropical vegetation, wet temperate vegetation is observed in minor parts of Solan and major parts of Shimla districts (1200 to 2500 m). The tree biomass ranges from 146.43 to 782 t/ha with NPP of 15.5 to 28.2 t/ha/yr.Further high, above 2200 m, the wet temperate vegetation gives way to dry temperate and sub–alpine vegetation which are coniferous and dry deciduous in nature. Dry temperate vegetation is found in Shimla and Lahaul Spiti and the tree biomass ranges from 40 to 502 t/ha with NPP of 7.3 to 24.6 t/ha/yr. Above 4000 m (timber limit or tree line) the alpine vegetation favours only short shrub species. Enormous diversity of undergrowths are observed throughout all types of vegetation, however of lesser fuelwood value. The representative fuel wood trees common in these regions with standing biomass and NPP are given in Table 2.
Table 4: Himalayan vegetation types, representative tree species, standing biomass and NPP found in the study regions
| Vegetation |
|
Standing biomass (t/ha) |
NPP (t/ha/yr) |
Ref |
| Tropical |
Forest type |
|
|
|
|
Broadleaved vegetation |
276.79 |
|
[18] |
|
Dry deciduous forest |
– |
14.6–15.7 |
[19] |
|
Tropical seasonal forest |
– |
16 |
[20] |
|
Representative trees |
|
|
|
|
Khair (Acacia catechu ) |
76.35 |
7.63 |
[21] |
|
Poplar (Populus deltoides ) |
– |
5.9–22.7 |
[22] |
|
Bamboo (Dendrocalamus strictus) |
– |
15.8–19.3 |
[23] |
|
Siris (Albizzia lebbeck) |
– |
8.38 |
[24] |
|
Shisham (Dalbergia sissoo) |
58·7– 136·1 |
12·6–20·3 |
[25] |
| Subtropical |
Forest type |
|
|
|
|
Pine forest |
210·8 |
9.9–21.2 |
[26] |
|
" |
115.2–286.2 |
11.0–23 |
[27] |
|
" |
200.8–377.1 |
18.5–24.5 |
[28] |
|
Mixed oak forest |
163.4–432.6 |
14.4–18.9 |
[28] |
|
" |
426 |
15.9 |
[29] |
|
Representative trees |
|
|
|
|
Chirpine (Pinus roxburghii) |
113–283 |
7.6–18.7 |
[29] |
|
" |
117.53 |
18.9 |
[18] |
|
Banj oak (Quercus leucotricophora ) |
388 |
13.2 |
[29] |
| Wet temperate |
Forest type |
|
|
|
|
Oak forest |
197.2–322.8 |
15.9–20.6 |
[30] |
|
Mixed oak |
344 |
15 |
[29] |
|
Representative trees |
|
|
|
|
Oak (Quercus sp.) |
285–782 |
15.5–25.1 |
[29] |
|
Deodar (Cedrus deodara) |
451 |
28.2 |
[29] |
|
" |
146.43 |
|
[18] |
| Dry temperate to subalpine |
Forest type |
|
|
|
|
Temperate decidous forest |
– |
12 |
[20] |
|
Temperate broad leaved forest |
– |
7 – 15.6 |
[31] |
|
Sub alpine forest |
– |
4.76–19.68 (ANP) |
[32] |
|
Representative trees |
|
|
|
|
Silver fir (Abies pindrow ) |
– |
18.9 |
[33] |
|
Fir (Abies sp) |
– |
7.3–20.0 |
[33] |
|
Blue pine (Pinus wallichiana) |
– |
13.08. |
[34] |
|
Spruce (Picea sp) |
– |
11–14.0 |
[35] |
|
Maple (Acer sp.) |
– |
10.9 (ANPtree) |
[36] |
|
Horse chestnut (Aesculus indica ) |
502 |
16.5 |
[29] |
|
" |
– |
19.6 |
[33] |
|
Kharsu oak (Quercus semicarpifolia) |
– |
24.6 |
[33] |
|
Birch (Betula utilis) |
172 |
12.5 |
[29] |
|
Rhododendron (Rhododendron sp.) |
40 |
7.5 |
[29] |
Agriculture
Agricultural systems in Himachal Pradesh vary with soil, climate, vegetation as well as socioeconomic factors like market proximity and government intervention. More than 90% of the cropped area in the districts are rain–fed and found on sloping marginal lands and small land holdings. Earlier subsistence based farming system has given way to cash crops and mechanization [13]. Mixed crop–livestock, vegetable based, perennial plantation and agro–pastoral systems are the common farming practices observed here. Including plantations, the net cropped area in Solan, Shimla and Lahaul Spiti are 39370 ha, 67857 ha and 3292 ha respectively [37]. Wheat, maize, rice, pulses and oil seeds are dominant in the tropical and sub–tropical regions, while crops such as millet, barley, buckwheat and dry nuts are common to temperate regions. Fruits and vegetables are profitable, generate more employment and are prominent in regions with access to roads and market. Apple orchards are predominant in wet temperate regions of Solan and Shimla. The sub–tropical and wet temperate regions are reported to be highly productive in terms of crop yield and are largely agriculture intensive. Farmers in dry temperate regions prefer more of mixed type of farming with livestock for sustenance. Due to unfavourable weather conditions agricultural productivity is low in upland cold districts like Lahaul Spiti [1].
Livestock
Livestock includes cattle, buffaloe, yak, mithun (bos frontalis), sheep, goat, horse, pony, mule, donkey, pig and camel which contribute nearly one–fourth of the total household farm income in Himachal Pradesh. Large animals are reared for dairy, draft power, transportation and manure while small animals provide meat, wool etc. Nearly 75–80% households in Himachal Pradesh keep dairy animals and 10% draught animals. The shift to plantation crops as well as mechanization has decreased the demand for draught. It is observed that the number of livestock per household has dwindled in the past few decades. Nevertheless, livestock owners are found to replace low productive cattle and buffaloes with more productive animals [38]. The tropical and subtropical regions have stall–fed and grazed cattle as the major livestock. Wet temperate regions prefer stall–fed cattle while dry temperate regions prefer more of sheep and goats which are grazed in open pastures. Transhumance farming with seasonal migration of people and livestock is observed in Lahaul Spiti and higher reaches of Shimla [1].
Bioenergy consumption
Over 90% of the population in Himachal Pradesh lives in rural areas (17495 villages). Electricity is the source of lighting in nearly 98% of these villages, the others depending on kerosene. Fuelwood satisfies nearly 70% of their heating and cooking needs. Himachal Pradesh is one of the major bioenergy consumer in India with annual fuelwood consumption of 3.2 million tonnes [39]. In rural areas, apart from household heating and cooking, fuelwood is consumed during festivals, marriages, funerals and also burned in margins of agricultural lands to drive away wild animals [40]. Increasing distance for fuelwood collection due to scarcity of forest resources in many cold tribal villages exhaust higher human energy and time [41]. Energy inefficient traditional cook stoves reported thermal efficiency of 8–13% contributing to the indoor pollution affecting women and children [5]. However, improved cook stoves disseminated through the federal program are being used in certain villages of Lahaul Spiti [40]. Certain studies suggest that kerosene and LPG distribution systems are well developed in rural areas while continued availability is not ensured and people are hesitant to switch due to lack of awareness and cost factors [42]. Hence these commercial sources minimally satisfy the rural domestic energy needs.
Fuelwood consumption patterns in different altitudinal gradients were ascertained through field surveys in the three watersheds – Mandhala, Moolbari and Megad apart from comprehensive literature survey of the Western and Central Himalayas given in Table 3 [3, 4, 39–41, 43–47]. The Per Capita Fuelwood Consumption (PCFC) ranges from 0.46 to 4.67 kg/day in Western Himalayas and 1.07 to 2.80 kg/day in Central Himalayas. Eastern Himalayas are the highest consumers of fuelwood reaching even beyond 4 kg/day [2]. Table 3 lists the regional fuelwood consumption studies. It highlights that PCFC in Solan is 0.46 to 1.32 kg/day, Shimla is 1.9 to 2.68 kg/day and Lahaul Spiti is 0.89 to 2.91 kg/day. This increase in consumption pattern along the altitudinal gradient is conspicuous due to higher demand for space and water heating in colder regions. This altitude based variation is observed irrespective of socioeconomic conditions. However, within an altitudinal range, large families consume less fuelwood per capita compared to smaller ones [40, 41].
Table 5: Fuelwood consumption patterns in different altitudinal gradients of Western and Central Himalayas
| Region |
PCFC (kg/day) |
Elevation |
Reference |
| Western Himalaya |
|
|
|
| Himachal Pradesh (Rural areas) |
1.562 |
300–6700 |
[39] |
| Mandhala watershed, Solan |
0.68±0.22 |
400–1100 |
Present study (ground survey) |
| Moolbari watershed, Shimla |
1.9–2.63 |
1400–2000 |
Present study (ground survey) |
| Megad waterhed, Lahaul Spiti |
1.53±0.64 |
2900–4500 |
Present study (ground survey) |
| Solan district, Himachal Pradesh (HP) |
1.32 |
316 – 2209 |
[3] |
| Shimla district, Himachal Pradesh |
2.68 |
713 – 4984 |
[3] |
| Mandi district, Himachal Pradesh |
2.99 |
– |
[3] |
| Kullu valley |
4.3±0.37 |
1200–1400 |
[43] |
| Hill forest (rural areas) |
1.89 |
– |
[44] |
| Hill forest (urban areas) |
1.21 |
– |
[44] |
| Hill non–forest (rural areas), HP |
1.31 |
– |
[44] |
| Khoksar, Lahaul Valley |
1.06–3 |
3200 |
[40] |
| Jahlma, Lahaul Valley |
1.02–2.91 |
3000 |
[40] |
| Hinsa, Lahaul Valley |
0.98–2.74 |
2700 |
[40] |
| Kuthar, Lahaul Valley |
0.91–2.68 |
2600 |
[40] |
| Central Himalaya |
|
|
|
| Garhwal Himalaya |
1.07–2.80 |
380–2500 |
[41] |
| Garhwal Himalaya, Tehri |
1.12–2.44 |
500–2500 |
[45] |
| Garhwal, tropical |
2.42–2.52 |
300–400 |
[4] |
| Garhwal, sub–tropical |
1.63–1.7 |
900–1300 |
[4] |
| Garhwal, temperate |
1.77–2.32 |
1900–2400 |
[4] |
| Kumaon Himalaya |
1.49 |
– |
[46] |
| Nepal Himalaya |
1.23 |
– |
[47] |
METHODOLOGY
Bioenergy resource assessment in the district level
Bioenergy resource availability
We employ an integrated approach of compiling data from government agencies and biomass inventorying of fuelwood, agro and animal residues. Primary data includes information from ground survey and remote sensing data. Secondary data are collected from respective government departments and literatures of previous studies.
Multispectral moderate resolution (30 m) cloud–free satellite images from Landsat (TM/ETM/ETM+ sensors) obtained in September/October months of 1989/90, 2000 and 2005/2006 covering the three districts of Solan, Shimla and Lahaul Spiti are collected from Global Land Cover Facility [http://glcfapp.glcf.umd.edu]. Since boundaries of the districts derived from Survey of India (SOI) toposheets cover more than one scene, mosaicking (combining the satellite images) and subsequent histogram matching (synchronizing the spectral reflectance of different images) corrections are performed. Bands of geo–corrected (geographic coordinates of satellite images are compared with ground control points) satellite images are masked and cropped with the district boundary. Land use analysis is performed on the satellite images using supervised Gaussian Maximum Likelihood Classification (GMLC) method categorizing the natural features like vegetation, water bodies, snow and open spaces. Training data were obtained from field and higher resolution (at least 15 m) spatial images from Google Earth (http://earth.google.com) were used for pre–classification error correction and post–classification validation. Although we tried to distinguish the land used for agriculture from total vegetation cover and built–up from open space, the varying spectral reflectance in the complex hill terrain due to high relief and shadow deteriorated the performance of the classification algorithm. The extent and temporal change of tree cover (also including horticulture plantation crops like apple, orange, peach etc), short vegetation (shrubs, crops, grassland), water and others (barren land, fallows, rocky terrain, built–up etc) are quantified from the classified satellite images with overall accuracy in the range of 75–90%. Vegetation is observed to vary primarily based on altitudinal gradients although species mixing towards upper and lower ranges have occurred in due course of time due to anthropogenic activities and climatic changes [14]. Training data corresponding to the land use types were derived from field (using Global Positioning System – GPS) and Google Earth (http://www.googleearth.com) along with the elevation contours generated from DEM. Remote sensing data (2005/06) of these districts were classified using these training data with the Gaussian maximum likelihood classifier. Classified data were validated with field data and accuracy assessment (Figure 3). This provided the extent and type of vegetation in the district.
The Aboveground Net Productivity of tree biomass (ANPtree) in forest vegetation has been quantified to assess the woody matter available for extraction. 70–90 % of the total forest biomass productivity is shared by trees and the rest by undergrowths of shrubs and herbs [17]. Nearly 60% and above of the total productivity of trees are attributed to the above ground biomass increment in the forests of Himachal Pradesh. Hence, ANPtree of three practical scenarios of high (75%), medium (50%) and low (25%) for availability of resources are considered.
The Net Calorific Values (NCV) of different tree species is above 4000 kcal/kg (dry weight) as per the literatures [48]. This value is used as energy equivalent in the total bioenergy estimation of woody biomass. The annual bioenergy available (Etree) from tree biomass resource of a particular vegetation type is calculated by equation 1
BEtree = Area * ANPtree * NCV (1)
The extent of agricultural land use mapped from the remote sensing data and the data from Department of Economics and Statistics, Ministry of Agriculture, Government of India [37]. The agriculture data includes crop types (cereals, vegetables, pulses, oilseeds, horticulture plantation, oilseeds, cotton, sugarcane, fodder crops and narcotics) with yield of crops (final product) for the years 2000 to 2005 in the three districts. Horticulture plantations of apple, orange, peach etc have been included in the woody biomass estimated using remote sensing data. Biomass residues from vegetables are negligible on field. The agro residues (cereals, pulses, oilseeds, cotton and sugarcane) and their production are calculated from the Residue to Product Ratio (RPR) considering the yield of respective crops [49]. The NCV of crop residues identified in the region are observed to range from 3000 – 4200 kcal/kg [49–53] and NCV of crop residues for three scenarios (viz. 3000, 3500 and 4000 kcal/kg) were considered assuming efficient energy conversion. Considering the multiple uses of crop residues as fodder, manure, mulch etc, the final residue production per area (R) available as fuel is accounted for high (75%), medium (50%) and low (25%) availability scenarios. The annual bioenergy from a particular crop residue is computed by equation 2.
BE
crop = Gross cropped area *R* NCV (2)
The district wise livestock population of cattle, buffaloe, yak, mithun, sheep, goat, horse, pony, mule, donkey and pig are collated from the livestock population census 2007, Department of Animal Husbandry, Government of Himachal Pradesh [54]. The dung yield per livestock type are given in Table 5 [15, 48, 56–58] and lower, moderate (average of lower and upper) and upper dung yield cases are considered. Biogas generated based on animal dung vary from 0.036 to 0.042 m3/kg [15]. However, cold conditions in the study region suggest lower value of 0.036 m3/kg biogas generation. NCV of biogas is consistently over 5000 kcal/m3 [55]. Alternative uses of animal dung as direct manure and constraints of dung collection during grazing restrict its availability for biogas generation. Here three scenarios of high (75%), medium (50%) and low (25%) animal dung availability are considered for biogas generation. The annual bioenergy yield from livestock is calculated as
BElivestock= Total annual dung yield from livestock*Volume of biogas per mass of dung*NCV (3)
Total annual bioenergy available from bioresources including forests, agriculture residues and animal residues in a region is calculated using equation 4
BEavailable = BEtree +BEcrop + BElivestock (4)
The different scenarios of low (25%), medium (50%) and high (75%) fuel based availability of the bioresources account for practical constraints in satisfying alternative needs.
Table 4: Crop types, productivity, residue types, residue to product ratio and energy equivalents considered
| Crop |
Type |
Productivity
(t/ha/yr) |
Residue type |
Residue to product ratio |
Energy equivalent (kcal/kg) |
| Cereals |
Rice |
1.84 |
Husk |
0.29 |
3000 |
| Stalk |
1.5 |
3000 |
| Wheat |
1.47 |
Stalk |
1.6 |
3500 |
| Bajra |
0 |
Cobs |
0.33 |
3500 |
| Husk |
0.3 |
3000 |
| Stalk |
2 |
3500 |
| Maize |
1.97 |
Cobs |
0.27 |
3500 |
| Husk |
0.2 |
3000 |
| Stalk |
2 |
4000 |
| Barley |
0.86 |
Stalk |
1.3 |
3000 |
| Others |
0 |
Stalk |
1.4 |
3000 |
| Pulses |
Gram |
0.88 |
Stalks |
1.1 |
3500 |
| Tur/arhar |
0 |
Husk |
0.3 |
3000 |
| Stalk |
2.5 |
3000 |
| Kharif |
0.76 |
Husk |
0.18 |
3000 |
|
Stalk |
1.1 |
3500 |
| Rabi |
0.67 |
Stalk |
1.2 |
3500 |
| Oilseeds |
Groundnut |
0.9 |
Shell |
0.33 |
4000 |
| Stalk |
2 |
4000 |
| Sesamum |
0.2 |
Stalk |
1.5* |
3000 |
| Rapeseed & Mustard |
0.49 |
Husk & Stalk |
1.5 |
3500 |
| Soyabeen |
1.37 |
Stalk |
1.7 |
3000 |
| Others |
0.2* |
Stalk |
2 |
3500 |
| Others |
Cotton |
0.72 |
Shell & husk |
2.2 |
3000 |
| Stalk |
3t/ha |
3000 |
| Sugarcane |
0.87 |
Bagasse |
0.33 |
3500 |
| Top & leaves |
0.05 |
3500 |
| *Data for which no references were available and hence approximated based on the conservative values |
Table 5: Livestock in the study region and dung yield
| Livestock |
Dung yield (kg/head/day) |
Reference |
| Cattle |
2.87 |
[48] |
|
10 |
[56] |
|
3–7.5 |
[15] |
| Buffaloe |
2.65 |
[48] |
|
15 |
[56] |
|
12–15 |
[15] |
| Yak |
4.5 |
[57] |
| Mithun (Bos frontalis) – |
[48] |
| Sheep |
0.32 |
[48] |
|
0.1 |
[15] |
| Goat |
0.35 |
[48] |
|
0.1 |
[15] |
| Horse |
1.72 |
[48] |
|
6.08 |
[58] |
| Pony |
– |
– |
| Mule |
0.94 |
[48] |
| Donkey |
– |
– |
| Pig |
0.34 |
[48] |
| Camel |
2.49 |
[48] |
Bioenergy resource demand
The PCFC in Solan, Shimla and Lahaul Spiti was computed from the data compiled from household surveys and literatures (Table 3). Bioenergy resource availability is assessed for the period 2005/2006 and the district–wise population is projected for the year 2006 from 2001 census [59, 60]. Considering 4000 kcal/kg energy equivalence of woody biomass, the domestic heating and cooking energy (majorly bioenergy) demand is given by
BE demand = Annual PCFC*Population* NCV (5)
Bioenergy resource status
The total woody biomass production in each district compared to the heating and cooking energy demand of the population indicate the ecological health of the region. The total bioenergy availability (including woody biomass, agro residues and animal dung) to bioenergy demand ratio gives the bioenergy resource status of the region.
BEstatus = BEavailable / BEdemand (6)
The different scenarios of high (75%), medium (50%) and low (25%) biomass availability are compared with the lower, moderate and upper case bioenergy demand. If the value of Estatus is above one, the region is surplus in bioenergy resources while a ratio below one denotes deficit. A bioenergy deficit status emphasizes adopting innovative and sustainable practices of enhancing the resources while improving the end use efficiency of the devices [15].
Bioenergy resource assessment in the village level: Bioresource assessment at district level provides an overview of the bioenergy status. However, the availability and consumption vary spatially and regionally. In order to understand the bioresource availability dynamics, the ecological status of the forest as well as the actual availability of the bioresources in the villages for meeting their bioenergy requirements have been studied. Fragmentation of forests is one of the decisive parameters in the availability of bioresources. Also an attempt is made to spatially analyse the degradation levels with the demand centre – villages in the watersheds of Solan and Shimla districts.
Fragmentation of forests: Forest fragmentation is a process by which a contiguous area of forest is reduced and divided into multiple fragments ultimately leading to deforestation. Fragmentation of forests is assessed using remote sensing data for Moolbari and Mandhala watersheds of Shimla and Solan districts respectively. Multispectral and temporal satellite images covering Moolbari watershed (1341 ha) are downloaded from GLCF (http://glcf.umiacs.umd.edu/data/) and also procured from National Remote Sensing Agency, Hyderabad, India. These include images with diverse spatial and spectral resolutions acquired from Landsat MSS (1972), Landsat TM (1989), Landsat ETM+ (2000) and IRS LISS–III (2007). SOI toposheets of 1:50000 and 1:250000 scales are digitized to derive boundary layer of the watershed which is used to mask and crop the region out of the satellite image. Land use (type of features like crops, built–up etc associated to human activities) and land cover (natural features like tree cover, water body, snow etc) analyses are performed on these satellite images using various classification algorithms like GMLC. Ground control points (GCPs) for geo–correction and training data for classification of remote data are collected through field investigations using a handheld GPS (Global Positioning System). Google Earth data (http://earth.google.com) are used for pre–classification and post–classification validation. Similar methodology is followed for Mandhala watershed (1453 ha) in Solan district. The extent of forest fragmentation is assessed using FRAGSTATS®
Biomass degradation analysis
Biomass degradation analysis maps the resource availability with respect to the bioenergy demand of inhabiting villages in the vicinity. The extent of woody biomass meeting the bioenergy requirements of 7 villages in Moolbari watershed is mapped using remote sensing (IRS LISS III) and Geographical Information Systems (GIS) tools. Classification of remote sensing data provided the land use and also helped in mapping the resource availability around each village. The watershed is divided in to 7 zones using theissen polygon method (based on the proximity of the village to the resource availability) such that each zone represents corresponding villages’ proximity area (village zonation theme). Multiple ring buffers are drawn around villages at 100 m interval up to 1000 m (10 rings). The buffer themes are clipped using village zonation theme and those falling on other village zones are deleted. ANPtree of forest cover is taken to be 3.6 t/ha/yr and PCFC as 2.3 kg/day and 1.9 kg/day in lower and upper case demand scenarios respectively. Finally, thematic maps are created for both the scenarios to understand the level of bioresources degradation.
DSS for regional bioenergy resource planning
A DSS for assisting regional bioenergy resource planning is developed using Microsoft Visual Basic 6.0 as frontend and Microsoft Access database as backend [6, 7]. It comprises of different modules enabling data management, processing, interpretation, modeling, projection and visualization (Figure 2). In the database module, the data collected from primary (ground surveys, spatial data) and secondary sources (Government departments, records, literatures) are stored in a database which is easily accessible for retrieval, updating or editing. This includes information on forest vegetation, plantation, crops, cattle and other sources of bioenergy. Data redundancy is minimized through normalized data tables. GIS provides the capabilities such as spatial and temporal analysis, querying and visualization which helps the location based decentralized planning. Land cover land use (LCLU) analysis module calculates the extent of vegetation cover in a region using remote sensing data. Temporal changes in land cover have been analyzed for studying trends of resource availability or degradation. Land use module helps in mapping the extent of different land use pattern (agriculture, plantation, forests etc.) in a region. The flexibility to enrich the database with spatial aspects helps to identify and quantify the local constraints in the resource management. Level of analysis module helps in hierarchical data input and analysis. Bioresource yield module computes sector–wise resource yield based on spatial extent (forest, agriculture, plantation etc.) and productivity. Energy module computes the available energy for the selected bioresource at selected level. Forecasting module helps in projecting the resource status to future conditions and facilitates alternative approaches so as to reduce possible resource crunch. This enables the planner to access and study bioenergy resource status in the village level to national level in a bottom up approach of resource planning [7]. The method flow diagram of DSS designed for regional bioenergy resource estimation and planning is given in Figure 3.
RESULTS AND ANALYSIS
LCLU analyses of Solan, Shimla and Lahaul Spiti districts are performed and the types of vegetation are identified spatially (Figures 4a–c). The temporal land cover changes for the districts are given in Table 6. Based on analysis of the latest available spatial data (2005/06), the total tree cover in Solan is 43.51%, Shimla is 48.85% and Lahaul Spiti is 0.36% of the respective total geographic areas (Table 7). The ANPtree estimated for the vegetation types are given in Table 8. The annual woody biomass produced ranges as 517.3–1111.7, 1253.8–3029.8, and 18.9–63.8 kilo tonnes for Solan, Shimla and Lahaul Spiti districts respectively. The lower, moderate and uppercase scenarios of availability are listed in Table 9. In all cases, the total availability of woody biomass is the highest in Shimla, followed by Solan and Lahaul Spiti. The district–wise fuelwood demand for lower, moderate and upper PCFC cases is given in Table 10. PCFC in Solan is 0.48–1.32 kg/person/day, Shimla is 1.9–2.68 and Lahaul Spiti is 0.89–2.91 kg/person/day. Evidently, the higher case of fuelwood demand in Lahaul Spiti cannot be met even by the moderate case productivity of woody biomass in the region. Moreover, the actual availability of woody biomass as fuelwood considering its alternative use as timber is lower than the total productivity in any region. Hence practically available fuelwood may not meet the bioenergy requirements of these regions for different demand cases.
Figure 2: Design of DSS for bioenergy resource assessment and planning
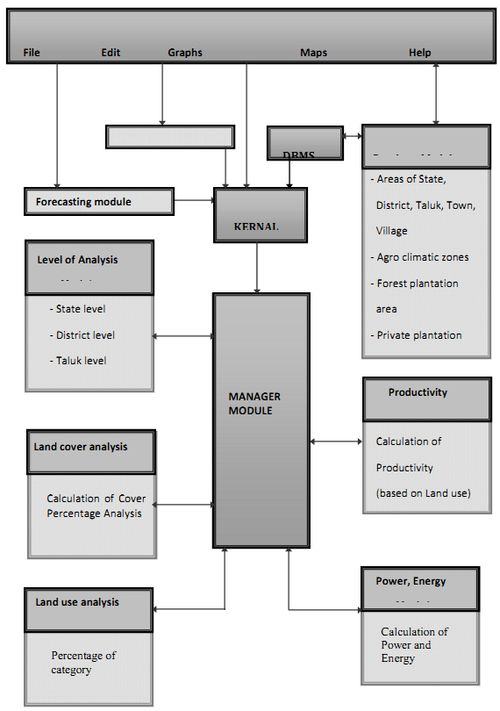
Figure 3: DSS methodology for bioenergy resource assessment and planning
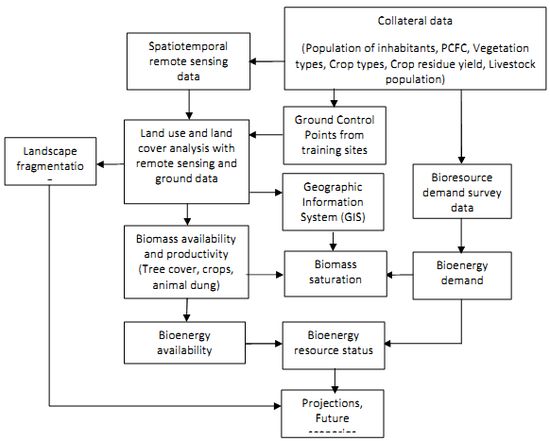
Figure 4a: Land cover classification of 2005/06 satellite image with vegetation type identified for Solan
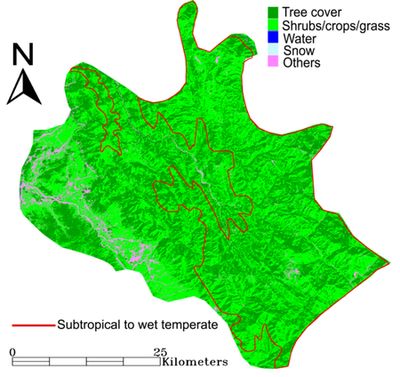
Figure 4b: Land cover classification of 2005/06 satellite image with vegetation type identified for Shimla
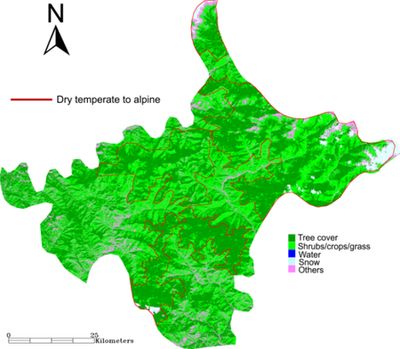
Figure 4c: Land cover classification of 2005/06 satellite image for Lahaul Spiti
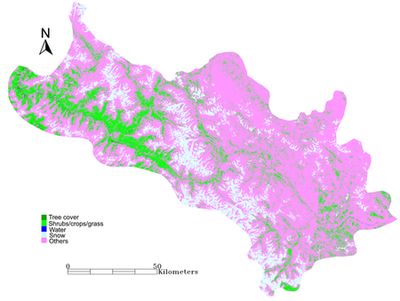
Table 6: GMLC based temporal land cover classification results for Solan, Shimla and Lahaul Spiti
| District |
Year |
Tree cover |
Shrubs/crops/grass |
Water |
Snow |
Others |
|
|
ha |
% |
ha |
% |
ha |
% |
ha |
% |
ha |
% |
| Solan |
1989 |
97665.43 |
47.70 |
101291.19 |
49.47 |
24.37 |
0.01 |
0.00 |
0.00 |
5774.69 |
2.82 |
| 2000 |
94508.19 |
46.02 |
102382.68 |
49.85 |
24.39 |
0.01 |
0.00 |
0.00 |
8469.95 |
4.12 |
| 2005 |
89354.01 |
43.51 |
107318.57 |
52.26 |
26.28 |
0.01 |
0.00 |
0.00 |
8669.05 |
4.22 |
| Shimla |
1989 |
249589.62 |
52.55 |
190807.40 |
40.17 |
10.88 |
0.00 |
9373.37 |
1.97 |
25176.71 |
5.30 |
| 2000 |
232780.26 |
48.98 |
191295.96 |
40.25 |
28.98 |
0.01 |
9092.59 |
1.91 |
42074.63 |
8.85 |
| 2005 |
231767.28 |
48.85 |
189457.75 |
39.93 |
1.44 |
0.00 |
9499.76 |
2.00 |
43766.50 |
9.22 |
| Lahaul Spiti |
1989 |
7215.61 |
0.51 |
166665.31 |
11.67 |
290.46 |
0.02 |
253642.97 |
17.77 |
999896.33 |
70.03 |
| 2000 |
8060.11 |
0.56 |
226480.31 |
15.86 |
478.74 |
0.03 |
216714.47 |
15.18 |
976327.38 |
68.37 |
| 2005 |
5187.92 |
0.36 |
203383.35 |
14.24 |
497.75 |
0.03 |
200516.52 |
14.04 |
1018475.48 |
71.32 |
Table 7: Types of vegetation identified and extent of tree cover (in hectares) mapped in different districts
| District |
Tropical to subtropical |
Wet temperate |
Dry temperate to subalpine |
Total |
| Solan |
40051.97 |
49302.04 |
0.00 |
89354.01 |
| Shimla |
0.00 |
99474.43 |
132292.85 |
231767.28 |
| Lahaul Spiti |
0.00 |
0.00 |
5187.92 |
5187.92 |
Table 8: The lower, moderate and upper case ANPtree (t/ha/yr) values of different vegetation
| Scenario |
Tropical to subtropical |
Wet temperate |
Dry temperate to subalpine |
| Lower case |
3.375 |
7.75 |
3.65 |
| Moderate case |
6.8875 |
10.93 |
7.98 |
| Upper case |
10.4 |
14.10 |
12.30 |
Table 9: Woody biomass availability (kilo t/yr) from different vegetation types of three districts for lower, moderate and upper case ANPtree
| District |
Scenario |
Tropical to subtropical |
Wet temperate |
Dry temperate to subalpine |
Total |
| Solan |
Lower case |
135.18 |
382.09 |
0.00 |
517.27 |
|
Moderate case |
275.86 |
538.62 |
0.00 |
814.48 |
|
Upper case |
416.54 |
695.16 |
0.00 |
1111.70 |
| Shimla |
Lower case |
0.00 |
770.93 |
482.87 |
1253.80 |
|
Moderate case |
0.00 |
1086.76 |
1055.04 |
2141.79 |
|
Upper case |
0.00 |
1402.59 |
1627.20 |
3029.79 |
| Lahaul Spiti |
Lower case |
0.00 |
0.00 |
18.94 |
18.94 |
|
Moderate case |
0.00 |
0.00 |
41.37 |
41.37 |
|
Upper case |
0.00 |
0.00 |
63.81 |
63.81 |
Table 10: PCFC estimated and total fuelwood demand for different scenarios in three districts projected for the year 2006
| District |
Scenario |
PCFC (kg/day) |
Total fuelwood demand (kilo tonnes/yr) |
| Solan |
Lower case |
0.46 |
97.50 |
|
Moderate case |
0.89 |
188.65 |
|
Higher case |
1.32 |
279.79 |
| Shimla |
Lower case |
1.9 |
544.28 |
|
Moderate case |
2.29 |
656.00 |
|
Higher case |
2.68 |
767.72 |
| Lahaul |
Lower case |
0.89 |
11.13 |
|
Moderate case |
1.9 |
23.76 |
|
Higher case |
2.91 |
36.39 |
The annual bioenergy equivalent of agro residues (from cereals, pulses, oilseeds, cotton and sugarcane) in Solan is 698925 million kcal, Shimla is 443124 million kcal and Lahaul Spiti is 5356 million kcal. However, we have considered only 50% of the agro residues available for energy purposes (fuel ratio). The total annual production of agro residues and agro bioenergy availability in the three districts are given in Table 11. Figure 5 shows that total annual bioenergy from agro–residues is the highest in Solan and least in Lahaul Spiti. Cereals and oilseeds are the only sources of agro bioenergy in Lahaul Spiti. Among all crops, cereals have the highest bioenergy potential in all districts, followed by pulses.
Table 12 gives the different cases of dung yield from livestock found in Himachal Pradesh. Considering the moderate case of dung yield, total dung generation is the highest in Shimla and least in Lahaul Spiti. Cattles, buffaloes and goats are the major sources of animal dung in Solan and contributes nearly 615.3 kilo tonnes annually. Since these are mostly stall fed, the actual availability is higher in the district. Apart from these animals, Shimla has additional livestock varieties of sheep, horses and mules, together generating 778.7 kilo tonnes of dung annually. The cold district of Lahaul Spiti has cattle, yak, sheep, buffaloe, goat and horses generating 36.6 kilo tonnes of annual dung. Total annual dung yield from livestock, their biogas generation potential and energy equivalents are estimated for lower, moderate and upper case dung yield values (Table 13). The annual biogas generation in Solan is 8.7–35.6 million m3, Shimla is 12.9–43.2 million m3 and Lahaul Spiti is 0.8–1.9 million m3.
Figure 5: Total energy equivalent of agro residues produced in Solan, Shimla and Lahaul Spiti
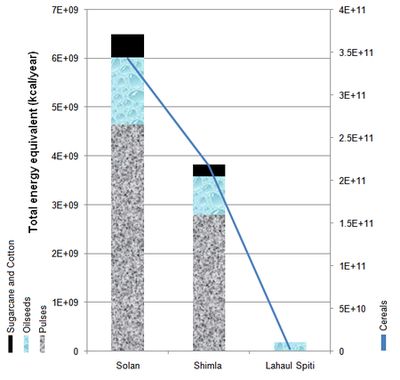
Table 11: Area, residue production and energy equivalent for different crops in Solan, Shimla and Lahaul Spiti
| |
|
|
Solan |
|
Shimla |
|
Lahaul Spiti |
| CROP |
NAME |
Residue type |
Area (ha) |
Residue produced (t/yr) |
Energy equivalent (kcal/yr) |
|
Area (ha) |
Residue produced (t/yr) |
Energy equivalent (kcal/yr) |
|
Area (ha) |
Residue produced (t/yr) |
Energy equivalent (kcal/yr) |
| CEREALS |
Rice |
Husk |
4742 |
2530 |
4.00E+09 |
|
1981 |
586 |
9.00E+08 |
|
0 |
0 |
0 |
| Stalk |
13088 |
2.00E+10 |
|
3031 |
5.00E+09 |
|
0 |
0 |
| Wheat |
Stalk |
24694 |
58080 |
1.00E+11 |
|
15104 |
24891 |
4.00E+10 |
|
81 |
183 |
3.00E+08 |
| Bajra |
Cobs |
0 |
0 |
0 |
|
3 |
1 |
1.00E+06 |
|
0 |
0 |
0 |
| Husk |
0 |
0 |
|
1 |
1.00E+06 |
|
0 |
0 |
| Stalk |
0 |
0 |
|
5 |
9.00E+06 |
|
0 |
0 |
| Maize |
Cobs |
22852 |
12290 |
2.00E+10 |
|
13896 |
8763 |
2.00E+10 |
|
64 |
39 |
7.00E+07 |
| Husk |
9004 |
1.00E+10 |
|
6420 |
1.00E+10 |
|
28 |
4.00E+07 |
| Stalk |
90037 |
2.00E+11 |
|
64200 |
1.00E+11 |
|
283 |
6.00E+08 |
| Barley |
Stalk |
1682 |
1880 |
3.00E+09 |
|
4704 |
6054 |
9.00E+09 |
|
592 |
939 |
1.00E+09 |
| Others |
Stalk |
0 |
0 |
0 |
|
4049 |
4195 |
6.00E+09 |
|
107 |
60 |
9.00E+07 |
| PULSES |
Gram |
Stalk |
315 |
305 |
5.00E+08 |
|
29 |
33 |
6.00E+07 |
|
0 |
0 |
0 |
| Tur/arhar |
Husk |
0 |
0 |
0 |
|
70 |
4 |
6.00E+06 |
|
0 |
0 |
0 |
| Stalk |
0 |
0 |
|
35 |
5.00E+07 |
|
0 |
0 |
| Kharif |
Husk |
1695 |
232 |
3.00E+08 |
|
4416 |
215 |
3.00E+08 |
|
27 |
1 |
2.00E+06 |
|
Stalk |
1417 |
2.00E+09 |
|
1312 |
2.00E+09 |
|
8 |
1.00E+07 |
| Rabi |
Stalk |
908 |
730 |
1.00E+09 |
|
48 |
32 |
6.00E+07 |
|
0 |
0 |
0 |
| OILSEEDS |
Groundnut |
Shell |
14 |
4 |
8.00E+06 |
|
8 |
1 |
1.00E+06 |
|
0 |
0 |
0 |
| Stalk |
25 |
5.00E+07 |
|
4 |
8.00E+06 |
|
0 |
0 |
| Sesamum |
Stalk |
320 |
96 |
1.00E+08 |
|
40 |
13 |
2.00E+07 |
|
0 |
0 |
0 |
| Rapeseed & Mustard |
Husk & Stalk |
414 |
304 |
5.00E+08 |
|
601 |
361 |
6.00E+08 |
|
68 |
96 |
2.00E+08 |
| Soyabeen |
Stalk |
46 |
107 |
2.00E+08 |
|
39 |
89 |
1.00E+08 |
|
0 |
0 |
0 |
| Others |
Stalk |
684 |
274 |
5.00E+08 |
|
7 |
3 |
5.00E+06 |
|
0 |
0 |
0 |
| MISCELLANEOUS |
Cotton |
Shell & husk |
53 |
84 |
1.00E+08 |
|
0 |
0 |
0 |
|
0 |
0 |
0 |
| Stalk |
159 |
2.00E+08 |
|
159 |
2.00E+08 |
|
0 |
0 |
| Sugarcane |
Bagasse |
189 |
54 |
9.00E+07 |
|
0 |
0 |
0 |
|
0 |
0 |
0 |
| Top & leaves |
8 |
1.00E+07 |
|
0 |
0 |
|
0 |
0 |
Table 12: Lower, moderate and upper case dung yield (kg/head/day) considered for livestock
| Livestock |
Cattle |
Buffaloe |
Yak |
Mithun |
Sheep |
Goat |
Horse |
Pony |
Mule |
Donkey |
Pig |
Camel |
| Lower case |
2.87 |
2.65 |
4.50 |
4.50 |
0.10 |
0.10 |
1.72 |
1.72 |
0.94 |
0.94 |
0.34 |
2.49 |
| Moderate case |
6.44 |
8.83 |
4.50 |
4.50 |
0.21 |
0.23 |
3.90 |
3.90 |
0.94 |
0.94 |
0.34 |
2.49 |
| Upper case |
10.00 |
15.00 |
4.50 |
4.50 |
0.35 |
0.35 |
6.08 |
6.08 |
0.94 |
0.94 |
0.34 |
2.49 |
Table 13: Livestock types, biogas generation and energy equivalent for different dung yield scenarios (L–lower case, M–Moderate case, U–Uppercase) in Solan, Shimla and Lahaul Spiti
|
|
Solan |
|
Shimla |
|
Lahaul Spiti |
| Livestock |
|
Total dung (kg/yr) |
Biogas(m3/yr) |
Energy equivalent (kcal/yr) |
|
Total dung (kg/y) |
Biogas(m3/yr) |
Energy equivalent (kcal/y) |
|
Total dung (kg/y) |
Biogas (m3/yr) |
Energy equivalent (kcal/y) |
| Cattle |
L |
2.E+08 |
5.E+06 |
3.E+10 |
|
3.E+08 |
1.E+07 |
6.E+10 |
|
1.E+07 |
5.E+05 |
2.E+09 |
| M |
3.E+08 |
1.E+07 |
6.E+10 |
|
7.E+08 |
3.E+07 |
1.E+11 |
|
3.E+07 |
1.E+06 |
5.E+09 |
| U |
5.E+08 |
2.E+07 |
9.E+10 |
|
1.E+09 |
4.E+07 |
2.E+11 |
|
4.E+07 |
2.E+06 |
8.E+09 |
| Buffaloe |
L |
8.E+07 |
3.E+06 |
1.E+10 |
|
1.E+07 |
5.E+05 |
2.E+09 |
|
0 |
0 |
0 |
| M |
3.E+08 |
1.E+07 |
5.E+10 |
|
4.E+07 |
2.E+06 |
8.E+09 |
|
0 |
0 |
0 |
| U |
5.E+08 |
2.E+07 |
8.E+10 |
|
7.E+07 |
3.E+06 |
1.E+10 |
|
0 |
0 |
0 |
| Yak |
L |
0 |
0 |
0 |
|
3.E+04 |
1.E+03 |
5.E+06 |
|
2.E+06 |
8.E+04 |
4.E+08 |
| M |
0 |
0 |
0 |
|
3.E+04 |
1.E+03 |
5.E+06 |
|
2.E+06 |
8.E+04 |
4.E+08 |
| U |
0 |
0 |
0 |
|
3.E+04 |
1.E+03 |
5.E+06 |
|
2.E+06 |
8.E+04 |
4.E+08 |
| Mithun |
L |
0 |
0 |
0 |
|
0 |
0 |
0 |
|
3.E+03 |
1.E+02 |
6.E+05 |
| M |
0 |
0 |
0 |
|
0 |
0 |
0 |
|
3.E+03 |
1.E+02 |
6.E+05 |
| U |
0 |
0 |
0 |
|
0 |
0 |
0 |
|
3.E+03 |
1.E+02 |
6.E+05 |
| Sheep |
L |
3.E+05 |
1.E+04 |
5.E+07 |
|
1.E+07 |
4.E+05 |
2.E+09 |
|
4.E+06 |
2.E+05 |
8.E+08 |
| M |
2.E+05 |
7.E+03 |
3.E+07 |
|
7.E+06 |
3.E+05 |
1.E+09 |
|
3.E+06 |
1.E+05 |
5.E+08 |
| U |
9.E+04 |
3.E+03 |
2.E+07 |
|
3.E+06 |
1.E+05 |
6.E+08 |
|
1.E+06 |
5.E+04 |
2.E+08 |
| Goat |
L |
1.E+07 |
4.E+05 |
2.E+09 |
|
1.E+07 |
4.E+05 |
2.E+09 |
|
1.E+06 |
4.E+04 |
2.E+08 |
| M |
7.E+06 |
2.E+05 |
1.E+09 |
|
8.E+06 |
3.E+05 |
1.E+09 |
|
7.E+05 |
2.E+04 |
1.E+08 |
| U |
3.E+06 |
1.E+05 |
5.E+08 |
|
3.E+06 |
1.E+05 |
6.E+08 |
|
3.E+05 |
1.E+04 |
6.E+07 |
| Horse |
L |
2.E+05 |
7.E+03 |
3.E+07 |
|
7.E+05 |
2.E+04 |
1.E+08 |
|
1.E+04 |
4.E+02 |
2.E+06 |
| M |
4.E+05 |
2.E+04 |
8.E+07 |
|
2.E+06 |
6.E+04 |
3.E+08 |
|
2.E+04 |
9.E+02 |
4.E+06 |
| U |
7.E+05 |
2.E+04 |
1.E+08 |
|
2.E+06 |
9.E+04 |
4.E+08 |
|
4.E+04 |
1.E+03 |
7.E+06 |
| Pony |
L |
3.E+04 |
1.E+03 |
6.E+06 |
|
6.E+05 |
2.E+04 |
1.E+08 |
|
6.E+05 |
2.E+04 |
1.E+08 |
| M |
8.E+04 |
3.E+03 |
1.E+07 |
|
1.E+06 |
5.E+04 |
2.E+08 |
|
1.E+06 |
5.E+04 |
2.E+08 |
| U |
1.E+05 |
4.E+03 |
2.E+07 |
|
2.E+06 |
8.E+04 |
4.E+08 |
|
2.E+06 |
8.E+04 |
4.E+08 |
| Mule |
L |
3.E+05 |
9.E+03 |
5.E+07 |
|
1.E+06 |
3.E+04 |
2.E+08 |
|
0 |
0 |
0 |
| M |
3.E+05 |
9.E+03 |
5.E+07 |
|
1.E+06 |
3.E+04 |
2.E+08 |
|
0 |
0 |
0 |
| U |
3.E+05 |
9.E+03 |
5.E+07 |
|
1.E+06 |
3.E+04 |
2.E+08 |
|
0 |
0 |
0 |
| Donkey |
L |
6.E+04 |
2.E+03 |
1.E+07 |
|
3.E+05 |
1.E+04 |
5.E+07 |
|
7.E+05 |
2.E+04 |
1.E+08 |
| M |
6.E+04 |
2.E+03 |
1.E+07 |
|
3.E+05 |
1.E+04 |
5.E+07 |
|
7.E+05 |
2.E+04 |
1.E+08 |
| U |
6.E+04 |
2.E+03 |
1.E+07 |
|
3.E+05 |
1.E+04 |
5.E+07 |
|
7.E+05 |
2.E+04 |
1.E+08 |
| Pig |
L |
2.E+04 |
9.E+02 |
4.E+06 |
|
3.E+04 |
1.E+03 |
5.E+06 |
|
0 |
0 |
0 |
| M |
2.E+04 |
9.E+02 |
4.E+06 |
|
3.E+04 |
1.E+03 |
5.E+06 |
|
0 |
0 |
0 |
| U |
2.E+04 |
9.E+02 |
4.E+06 |
|
3.E+04 |
1.E+03 |
5.E+06 |
|
0 |
0 |
0 |
| Camel |
L |
9.E+02 |
3.E+01 |
2.E+05 |
|
3.E+03 |
1.E+02 |
5.E+05 |
|
0 |
0 |
0 |
| M |
9.E+02 |
3.E+01 |
2.E+05 |
|
3.E+03 |
1.E+02 |
5.E+05 |
|
0 |
0 |
0 |
| U |
9.E+02 |
3.E+01 |
2.E+05 |
|
3.E+03 |
1.E+02 |
5.E+05 |
|
0 |
0 |
0 |
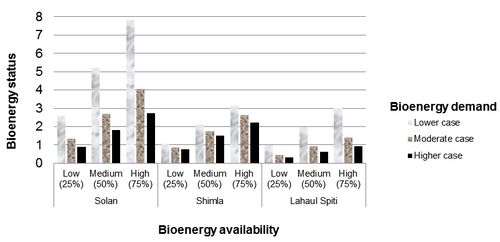
Considering the multiple uses of woody biomass, agro residues and animal dung, the actual availability of these bioresources for fuel purposes are accounted in high (75%), medium (50%) and low (25%) supply scenarios. Figure 6 highlights these bioenergy availability scenarios (considering moderate case production for woody biomass and animal dung) and their prospects of meeting the lower, moderate and upper case bioenergy demands in the three districts. The bioenergy resource status of the three districts are represented in Figure 7. In solan, higher case bioenergy demand cannot be met by the low (25%) bioenergy availability scenario even after including agro residues and biogas energy from animal dung. This scenario points at a bioenergy deficit status for the region (Figure 7). However, moderate and lower case demand is being met by the fuelwood resources. In Shimla, even lower case bioenergy demand is met by the low (25%) availability scenario of woody biomass. Additional bioenergy from agro and animal residues (low) fail to meet the moderate and higher case demand. As seen in Figure 7, this scenario represents a critical bioenergy status for Shimla. However, medium (50%) availability of woody biomass is sufficient for a higher case demand. In Lahaul Spiti, high (75%) availability of woody biomass sustains at least moderate case demand, while medium (50%) availability sustains only lower case demand. Even a high total bioenergy availability scenario, cannot sustain the higher case demand of the region. This indicates a very critical bioenergy deficit status in the cold district of Lahaul Spiti.
Figure 6: Different availability scenarios of bioenergy resources and cases of bioenergy demand in Solan, Shimla and Lahaul Spiti
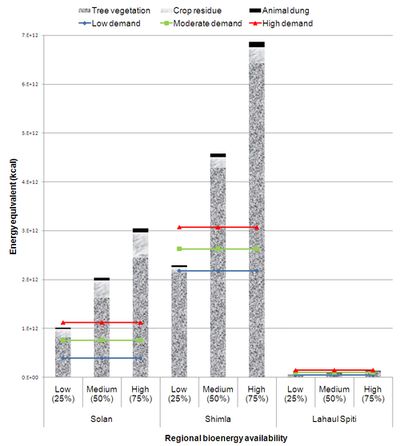
Figure 7: Bioenergy resource status of Solan, Shimla and Lahaul Spiti
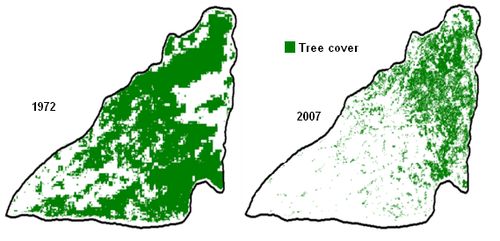
Figures 8a and 8b represent biomass saturation in the proximity of 7 villages in Moolbari watershed for higher (2.63 kg/day) and lower (1.9 kg/day) case bioenergy demand scenarios respectively. It is observed that the villages of Moolbari, Ganeog, Kiuru and Dochi have limited availability of fuelwood resource in their vicinity and people traverse longer distances to meet their needs. The villages of Tikri and Niaog have relatively higher fuelwood availability while Shanohal has the highest among all. The forest fragmentation study conducted in the same watershed reveals the extent of forest degradation that has occurred from 1972 to 2007 (Figure 9a). The overall accuracy of image classification is between 81–89% and results show that the extents of forest cover which was high in 1972 eventually declined by 5.59% in 2007. It is observed that the regions prone to higher forest fragmentation levels inhabit villages like Moolbari, Ganeog, Kiuru and Dochi with lower biomass saturation. This highlights the anthropogenic influence in forest fragmentation occurred over a period of time. A similar analysis of the tree cover changes in Mandhala watershed during the period 1972 to 2007 also exposes the forest fragmentation in its landscape (Figure 9b). Such grassroots level resource constraints are not discerned in the district level bioresource assessment and hence call for further disaggregation in assessment studies.
Figure 8a: Bio–mass saturation map for Moolbari, Case–I

Figure 8b: Bio–mass saturation map for Moolbari, Case–II

Figure 9a: Classified images of Mandhala watershed showing land cover and land use changes from 1972 to 2007
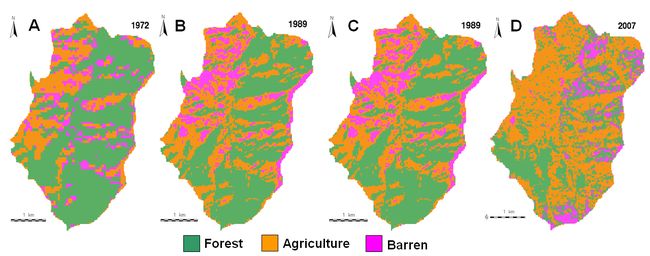
Figure 9b: Tree cover change from 1972 to 2007 in Mandhala watershed
DISCUSSION
The bioenergy resource status of the three districts highlights highly pronounced scarcity of bioresources. The estimations are based on the moderate (average of upper and lower) case of bioenergy production. A possible lower case of production worsens the bioenergy status further. Increase in population results in increasing bioenergy demand and its impact is felt more on regions with higher PCFC. Especially in critical bioenergy deficit regions like Lahaul Spiti, with the highest PCFC an energy crisis is imminent. The dwindling forest resources may not suffice the domestic, commercial and industrial needs of an ever increasing population. This results in shortage of fuelwood availability even for sustenance. In such situations people tend towards alternative bioenergy resources in an inefficient and ad hoc manner with dire consequences of pollution and conflicts with other traditional utilities. Efficient utilization of fuelwood, agro residues and animal dung could however reduce the pressure on forest resources. This demands site specific and innovative solutions with ultimate priority for the bioenergy deficit regions where even the total estimated bioenergy availability cannot meet the demands of an ever increasing population. Nevertheless, the regions deemed as bioenergy surplus in these estimations should not be marginalized while adopting such methodologies since they are under pressure. Potential bioresource crunch is imminent in the absence of immediate intervention perceptibly leading to deforestation.
Traditional stoves used for burning wood in these hill regions are thermally inefficient. They emit more smoke causing health hazards to women and children. Energy efficient, smokeless and innovative ASTRA cookstoves with thermal efficiency above 30% will reduce the fuel consumption by 42% [61, 65]. In mountains regions the demand as well as utility of fuelwood varies with altitude and hence the traditional designs differ zone–wise. The National Program on Improved Cookstoves (NPIC) introduced in Himachal Pradesh in 1983, has not given the desired results due to technical and institutional problems. The improved and efficient designs were not accepted by the inhabitants who were used to their traditional models. In recent times, need and location specific cookstoves are being designed so as to improve the prospects of social acceptance. Improvements in technical knowhow, institutional support, women awareness, publicity campaigns and subsidies are proposed for long term success of the national program [5].
Biogas from animal residues is an important alternative energy source in fuelwood deficient regions. Compared to traditional burning of animal dung cakes, biogas is efficient, cleaner and easier to distribute in a community based system. The potential of small 1 m3 capacity biogas plants in rural regions is enormous [62]. Dung from stall–fed livestock could be used for biogas generation and the slurry as nitrogen rich manure which is not available during direct burning of dung–cakes. The state has an estimated potential to install nearly 0.332 million family size (2 m3) biogas plants which could produce 0.515 million m3 of biogas per day with energy equivalent to about 1801.1 tonnes of fuelwood. However due to the lacunae in planning, technical, organizational and social aspects, biogas program introduced in the state in 1982 has not been successful [63, 61]. Performance of biogas plants in colder regions is relatively poor. Warmer climate in lowland regions of Solan and Shimla is conducive for biogas generation with the existing technology. The annual energy from biogas generation is 55373 million kcal in Solan, 70081 million kcal in Shimla and 3291 million kcal in Lahaul Spiti, considering the moderate case of production, medium scenario (50%) of availability and lower energy equivalent for conversion. Biogas has enormous potential to replace fuelwood and can save up to 13843, 17520 and 823 tonnes of fuelwood annually in Solan, Shimla and Lahaul Spiti respectively. Livestock in Shimla and Lahaul Spiti also include horse and pony which are mostly stall–fed. It has been observed that a 20 % replacement of cattle dung can be made by horse dung for operating family size biogas plants without much reduction in their gas production or encountering any operational problem [64]. The increased grazing based livestock farming in Lahaul Spiti results in lesser actual availability of animal dung for biogas generation. Stall–fed livestock facilitate dung collection as well as reduce grazing in forests [61]. Hence site specific innovative solutions need to be introduced to revamp and enhance the biogas prospects in these hill regions.
Agro residues generated are to be judiciously utilized for energy without compromising their alternative utilities as fodder, manure and mulch. The annual energy from agro residues is 349463 million kcal in Solan, 221562 million kcal in Shimla and 2678 million kcal in Lahaul Spiti, considering the medium scenario (50%) of availability and lower energy equivalents for conversion. This can save up to 87366, 55390 and 669 tonnes of trees annually in Solan, Shimla and Lahaul Spiti respectively. Process based residue like rice husk has high energy potential if utilized effectively. Commercial energy sources like LPG and kerosene distribution system need revitalization so as to ensure wider absorption into the local energy system. As observed in the land cover analyses, Solan, Shimla and Lahaul Spiti have large open spaces. The extent of waste lands could be prospected through government records for energy plantations. Multiple tree species with high growth and regeneration potential need to be introduced in the regions with bioenergy deficit status as high priority. Species level mapping of fuelwood trees could be carried out using remote sensing and geospatial tools [66]. The exotic Lantana camara weeds spread in the hills of Solan could be replaced with native trees as energy plantations. The upland regions of Lahual Spiti with critical bioenergy deficit support lesser vegetation. Hence certain studies suggest energy plantations in lower altitude tribal villages to sustain the higher energy demands in the higher altitude villages [40]. Energy plantation provides employment opportunities for the mountain people, provides sufficient time for the natural restoration of degraded forests and helps sequester more carbon dioxide from the atmosphere. Joint forest management practices need to be strengthened through local support.
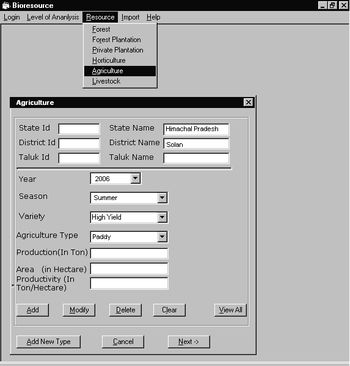
Importantly, the ultimate benefit of regional bioenergy resource assessment exercise is realized through an efficient and user friendly BEPA DSS. An executable file is provided for this application and by running this, a form with Login, Level of Analysis and Resources Menu options are displayed. After logging with the user information, the Level of Analysis option is enabled for hierarchical administrative levels of analysis such as state, district, taluk, town and village levels. This option also enables user to either input retrieve or edit data in the database. This includes data entry of forest type, productivity, year of estimate and spatial extent of the forest. Similar options are available for computing bioenergy from agriculture and livestock sectors. The GIS enabled features of the DSS facilitates simpler interpretation of spatial resource and demand variations as well as their quantification. Figures 10a–b demonstrate some of the visual features of BEPA DSS. The complexity in collating, processing, analyzing, interpreting and outputting information on bioenergy resources is simplified through the DSS designed. This helps the planner to act according to the regional energy scenarios which are often diluted in the national decision making process.
Figure 10a: BEPA DSS visualization of forest bioresource
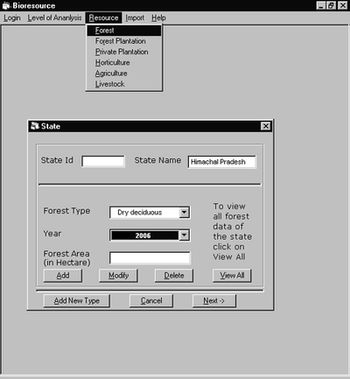
Figure 10b: BEPA DSS visualization of agricultural bioresource
CONCLUSION
The bioenergy resource statuses of Solan, Shimla and Lahaul Spiti districts are assessed for different resource availability scenarios and demand cases. PCFC varies with seasons and regions as 0.48–1.32 kg/person/day (Solan), 1.9–2.68 (Shimla) and 0.89–2.91 kg/person/day (Lahual Spiti). The total tree cover in the study area is 43.51% (Solan), 48.85% (Shimla) and 0.36% (Lahaul Spiti) providing annual woody biomass of 517.3–1111.7 kilo tonnes (Solan), 1253.8–3029.8 kilo tonnes (Shimla) and 18.9–63.8 kilo tonnes (Lahaul Spiti). The annual bioenergy potential of agro residues (considering 50% for fuel purpose) is 349463 million kcal (Solan), 221562 million kcal (Shimla) and 2678 million kcal (Lahaul Spiti). The annual biogas generation potential is 8.7–35.6 million m3 (Solan), 12.9–43.2 million m3 (Shimla) and 0.8–1.9 million m3 (Lahaul Spiti). Bioenergy resource crunch is more pronounced in the higher elevations while scarce resource availability scenarios create similar conditions in lower elevations as well. Possible alternatives are proposed for ensuring proper ecological health in the mountain areas. Reiterating the importance of further disaggregated bioresource analysis, village level forest fragmentation and biomass saturation studies are also performed. Proximity of energy demand centers like villages create shortage of fuelwood and increase deforestation. Enhancing the possibility of regional bioenergy resource planning, a DSS has been designed to support energy planners and policy makers.
ACKNOWLEDGEMENT
We are grateful to NRDMS division, Ministry of Science and Technology (DST), Government of India and Indian institute of Science for the financial and infrastructure support.
REFERENCES
- Bhati JP, Singh R, Rathore MS, Sharma LR, Diversity of mountain farming systems in Himachal Pradesh, India. Sustainable mountain agriculture – Farmers’strategies and innovative approaches. ICIMOD 1992, Kathmandu: Oxford and IBH Publishing Co Pvt Ltd;2
- Rijal K, Energy use in mountain areas–emerging issues and future priorities. ICIMOD 1997, Kathmandu
- Rijal K, Energy use in mountain areas–trends and patterns in China, India, Nepal and Pakistan. . ICIMOD 1999, Kathmandu
- Kumar M, Sharma CM, Fuelwood consumtion patterns at different altitudes in rural areas of Garhwal Himlayas. Biomass and Bioenergy 2009; 33:1413 – 1418
- Aggarwal RK, Chandel SS, Review of Improved Cookstoves Programme in Western Himalayan State of India, Biomass and Bioenergy 2004;27:131 – 144
- Ramachandra TV, RIEP:Regional Intergrated Energy Plan, Renewable and Sustainable Energy Reviews 2009;13(2):285–317
- Ramachandra TV,Vamsee Krishna S, Shruthi BV, Decision Support System to assess regional biomass energy potential, International Journal of Green Energy 2004;11(4):407–428.
- Perimenis A, Walimwipi H, Zinoviev S, Muller–Langer F, Miertus S, Development of a decision support tool for the assessment of biofuels, Energy Policy 2011;39:1782–1793
- Noon CE, Daly MJ, GIS–based biomass resource assessment with BRAVO, Biomass and Bioenergy 1996;10:101–109
- Ayoub N, Wang K, Kagiyama T, Seki H, Naka Y, A planning support system for biomass–based power generation, 16th European Symposium on Computer Aided Process Engineering and 9th International Symposium on Process Systems Engineering, Elsevier 2006
- Frombo F, Minciardi R, Robba M, Sacile R, A decision support system for planning biomass–based energy production, Energy 2009;34:362–369
- Statistical Data of Himachal Pradesh upto 2009–10, Himachal Pradesh Planning Department, Govt. of Himachal Pradesh, Accessed on August 2 2010 < http://hpplanning.nic.in/Statistical data of Himachal Pradesh upto 2009–10.pdf>
- Bhagat RM, Singh S, Kumar V, Kalia V, Sood C, Pradhan S, Immerzeel W, Shrestha B, Developing Himachal Pradesh Agricultural Systems Information Files (HASIF) and Tools for Decision Support Systems for Niche Based Hill Farming, CSKHPAU–ICIMOD 2006,Palampur, Himachal Pradesh
- Champion HG, Seth SK, A revised survey of the forest types in India, Govt of India press 1968, Nasik
- Ramachandra TV, Kamakshi G, Shruthi BV, Bioresource status in Karnataka, Renewable and Sustainable Energy Reviews 2004;8:1–47
- Singh SP, Singh JS, Analytical conceptual plant to reforest Central Himalaya for sustainable development, Environmental Management 1991;15(3):369–379.
- Singh JS, Singh SP, Forest vegetation of the Himalaya, The Botanical Review 1987;53(1);80–192
- Sharma DP, Biomass distribution in sub tropical forest of solan forest division (HP), Indian J Ecol 2009; 36(1):1–5,
- Singh R.P, Primary production and energy dynamics of tropical deciduous forest in Chandraprabha region, Varanasi, Ph.D. thesis, Banaras Hindu University, Varanasi. India.
- Holdgate M, The ecological significance of biological diversity, Ambio 1996, 25(6)
- Agarwal SK, Swarnalata Tiwari, Dubey PS, Biodiversity and environment, APH Publishing corporation, New Delhi
- Singh B, A study of silvicultural practices, biomass,productivity and nutrient cycling in poplar plantations of sub–Himalayan tract of U.P. State, Ph.D. thesis. Kumaun University 1989, Nainital.
- Tripathi SK, Singh,KP, Productivity and nutrient cycling in recently harvested and mature bamboo savannas in the dry tropics, Journal of Applied Ecology 1994;31(1): 109–124
- Das DK, Chaturvedi OP, Mandal MP, Kumar R, Effect of tree plantations on biomass and primary productivity of herbaceous vegetation in Eastern India, Tropical Ecology 2008;49(2): 95–101
- Lodhiyal N, Lodhiyal LS, Pangtey YPS, Structure and Function of Shisham Forests in Central Himalaya, India: Dry Matter Dynamics, Annals of Botany 2001;89(1):41–54
- Chaturvedi OP, Singh, JS, The structure and function of pine forest in Central Himalaya: I. Dry matter dynamics, Annals of Botany 1987;60:237–252.
- Chaturvedi OP, Biomass structure, productivity and nutrient cycling in Pinus roxburghii forest. Ph.D. Thesis. Kumaun University 1983, Nainital.
- Singh SP, JS Singh, An integrated ecological study of eastern Kumaun Himalaya,with emphasis on natural resources, Kumaun University 1982, Nainital
- Singh SP, Adhikari BS, Zobel DB, Biomass, Productivity, Leaf Longevity, and Forest Structure in the Central Himalaya, Ecological Monographs 1994, 64:401–421
- Rawat YS, Plant biomass, net primary production and nutrient cycling in oak forests. Ph.D. Thesis. Kumaun University 1983, Nainital.
- Nihlgard B, Lindgren L, Plant biomass, primary production and bioelements of three mature beech forest in southern Sweden. Oikos 1977;28: 95–104
- Dhaulakhandi M, Rajwar GS, Kumar P, Primary productivity and system transfer functions in an alpine grassland of Western Garhwal Himalaya Tropical Ecology 2000;41(1): 99–101
- Adhikari BS, Rawat YS, Singh SP, Structure and function of high altitude forests of central Himalaya, I.Dry matter dynamics, Annals of botany 1995;75:237–248
- Bhutan Energy Data Directory 2005, Department of Energy 2007, Thimphu
- Chenghui M, Liqiang M, Zhongliang Y, Peng L, Jianfeng S, Biomass and net productivity for spruce plantation, Journal of Forestry Research 1999; 10(1)
- Garkot SC, Singh SP, Variation in NPP and biomass of forest in high mountains of central himalayas, Journal of vegetation Science 1995; 6:23–28
- Crop production statistics information system, Directorate of Economics and Statistics, Government of India. Accessed on January 3 2011 <http://dacnet.nic.in/apy/>
- Tulachan PM, Neupane A, Livestock in mixed farming systems of the Hindukush–himalayas– trends and sustainability, FAO– ICIMOD 1999, Kathmandu, Nepal
- Teri Energy Data Directory and Yearbook 2010, TERI Press 2011, New Delhi
- Rawat YS, Vishvakarma SCR, Todaria NP, Fuel wood consumption pattern of tribal communities in cold desert of the Lahaul valley, North–Western Himalaya, India, Biomass and Bioenergy 2009; 33:1547 – 1557
- Bhatt BP, Sachan MS, Firewood consumption along an altitudinal gradient in mountain villages of India. Biomass and Bioenergy 2004; 27:69–75
- Parikh J, The energy poverty and gender nexus in Himachal Pradesh, India– the impact of clean fuel access policy on women’s empowerment, integrated research and action for development (IRADe) WECS, Energy Sector Synopsis Report, Government of Nepal, Accessed ob February 26 2011 <http://www.dfid.gov.uk/r4d/PDF/Outputs/Energy/R8346_finrep_parikh.pdf>
- Vishvakarma SCR, Kuniyal JC, Singh GS, Indigenous Agroforestry system of North Western Himalaya. research for mountain development– some initiatives and accomplishments, gyanodaya prakashan, Nainital 1998; 99–118.
- Rai SN, Chakrabarti SK. Demand and supply of fuel wood and timber in India, Indian Forester 2001; 263–79.
- Bhatt BP, Negi AK, Todaria NP, Fuel wood consumption pattern at different altitudes in Garhwal Himalaya. Energy 1994; 19(4):465–8.
- Pandey V, Singh JS. Energy flow relationship between agro and forest ecosystem in central Himalaya, Environment Conservation 1984;11:45–53.
- Mahat TBS, Grigflin DM, Shephered KP. Human impacts on some forests of the middle hills of Nepal. Part 4: A detailed study in South–east Sindhu Palanchock and Northeast Kabhere Palanchock, Mountain Research and Development 1987;7: 114–34.
- Kishore VVN, Renewable energy engineering and technology, TERI press 2008, New Delhi
- Ramachandra TV, Joshi NV, Subramanian DK. Present and prospective role of bioenergy in regional energy system. Renewable and Sustainable Energy Reviews 2000;4:375–430.
- Bhattacharya SC, Salam PA, Runqing H, Somashekar HI, Racelis DA, Rathnasiri PG, Yingyuad R, An assessment of the potential for non–plantation biomass resources in selected Asian countries for 2010, Biomass and Bioenergy 2005; 29:153–166
- Abdallah MH, Energy potential from economically available crop residues in the sudan, Energy 1991;16(8):1153–1156
- Gemtos TA, Tsiricoglou T, Harvesting of cotton residue for energy production, Biomass and Bioenergy 1999; 16: 51–59
- Wilaipon P, Physical characteristics of maize cob briquette under moderate die pressure, American Journal of Applied Sciences 2007;4(12): 995–998
- Department of Animal Husbandry, Government of Himachal Pradesh, Accessed on January 3 2011 <http://hpagrisnet.gov.in/animal–husbandry/Ahd%20Docs/18th%20Livestock%20Census–2007.aspx>
- Recent trends in biogas technology for poverty reduction and sustainable development, United Nations ESCAP, Accessed on March 14 2011 < http://www.unapcaem.org/publication/F–Biogas.PDF>
- Energy Sector Synopsis Report 2010, Water and Energy Commission Secretariat, Kathmandu, 2010, Accessed on March 14 2011 < http://www.wec.gov.np/>
- Rhode D, Madsen DB, Brantingham PJ, Dargye T, Yaks, yak dung, and prehistoric human habitation of the Tibetan Plateau, Developments in Quaternary Science 2007;9:205–224
- Tao J, Mancl K, Estimating manure production, storage size, and land application area, Accessed on March 17 2011 <http://ohioline.osu.edu/aex–fact/pdf/0715.pdf>
- Mapping Himachal Pradesh Census Indicators 2001 and trends, CSKHPAU–ICIMOD 2006,Palampur, Himachal Pradesh
- Mehta AC, National Institute of Educational Planning and Administration , Accessed on March 17 2011 <http://www.educationforallinindia.com/New%20Modules/module%20on%20enrolment%20and%20population%20projections.pdf>
- Ramachandra, TV, Sreekantha , Purnima GB, Bioenergy status of Sharavathi river basin,Western Ghats, India, Energy & Environment 2007;18(5):591–613.
- Ramachandra TV, Geographical System Information approach for regional biogas potential assessment, Research Journal of Environmental Sciences 2008;2(3):17–184
- Singh,SP, Vatsa DK, Verma HN, Problems with biogas plants in Himachal Pradesh Bioresource Technology 1997;59:69–71
- Kalia AK, Singh SP, Horse dung as a partial substitute for cattle dung for operating family–size biogas plants in a hilly region, Bioresource Technology 1998; 64:63–66
- Ramachandra TV, Subramanian DK, Joshi NV, Gunaga SV, Harikantra RB, End use efficiencies in the domestic sector of Uttara Kannada District, Energy Conversion & Management 2000; 41: 833–845
- Ramachandra TV, Mapping of fuelwood trees using geoinformatics, Renewable and Sustainable Energy Reviews 2010; 14: 642–654
- Ramachandra TV, Vijaya Prasad BK, Samapika Padhy, Bioresource inventory using remote sensing for regional energy planning, Proceedings of ISRS National Symposium on Remote Sensing Applications for Natural Resources Retrospective & Perspective, Bangalore 1999: 245-256.
BACK « TOP » NEXT