|
BIO-MONITORING TO ASSESS RIVER HEALTH
Western Ghats is the primary catchment for most of the rivers in peninsular India. Pristine forests in this region are rich in biodiversity and are being cleared due to unsound developmental activities. This has given rise to concerns about land use/land cover changes with the realization that land processes influence climate. Rapid land-use changes have undermined the hydrological conditions, there by affecting all the components in the hydrological regime. The development programmes based on ad-hoc decisions, is posing serious challenges in conserving fragile ecosystems. Considerable changes in the structure and composition of the land use and land cover in the region have been very obvious during the last four decades. Pressure on land for agriculture, vulnerability of degraded ecosystems to the vagaries of high intensity of rainfall and high occurrence of steep erosion and landslide-prone areas, lack of integrated and coordinated land use planning are some of the reasons for rapid depletion of the natural resource base. These changes have adversely affected the hydrological regime of river basins resulting in diminished river / stream flows. This necessitates conservation of ecosystems in order to sustain the biodiversity, hydrology and ecology. In this situation, in order to resolve present problems and to avoid a future crisis, a comprehensive assessment of land use changes, its spatial distribution and its impact on hydrological regime was carried out and accordingly, appropriate remedial methods are being explored for the sustainable utilization of the land and water resources of the catchment.

Figure 1: Study region - Uttara Kannada district with rivers (Source: Energy & Wetlands Research Group, CES, Indian Institute of Science)
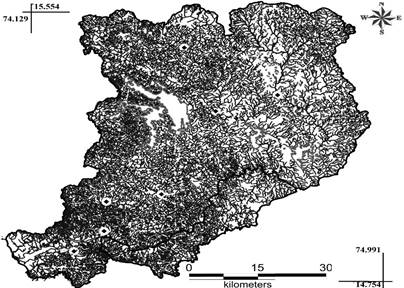
Figure 2: River Kali with sampling sites
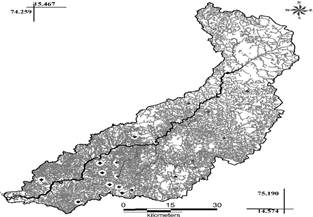
Figure 3: River Bedthi with sampling sites

Figure 4: River Aghanashini with sampling sites
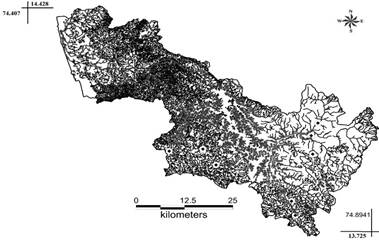
Figure 5: River Sharavathi with sampling sites
A total of 140 diatom taxa were identified across sites (Figure 2-5: River basin wise sampling locations), 61 of them reaching a relative abundance of over 5% in at least one site. The species compositions were dominated by Gomphonema gandhii Karthick and Kociolek, Achnanthidium minutissimum Kützing, Achnanthidium sp., Gomphonema sp., Gomphonema parvulum Kützing, Nitzschia palea (Kützing) W.Smith, Nitzschia frustulum (Kützing) Grunow var. frustulum, Navicula sp., Navicula cryptocephala Kützing, Cyclostephanos sp., Cymbella sp., Eolimna subminuscula (Manguin) Moser Lange-Bertalot and Metzeltin, Sellaphora pupula (Kützing) Mereschkowksy, Eunotia minor (Kützing) Grunow in Van Heurck, Nitzschia amphibian Grunow f. amphibia, Cyclotella meneghiniana Kützing, Gomphonema difformum Karthick and Kociolek, Navicula rostellataKützing, Cocconeis placentula Ehrenberg var. euglypta (Ehr.) Grunow, Brachysira sp., Stauroneis sp., Encyonema minutum (Hilse in Rabh.) D.G. Mann, Cyclotella sp. and Nitzschia sp. The species composition contains cosmopolitan to possible Western Ghats endemic species and in general species from oligotrophy to highly eutrophic condition were also observed. The current study also documents some of the species for the first time in Western Ghats and many new species descriptions are underway. In some sampling locations, water quality show tendency towards alkalinity in the streams drained from agriculture and urban catchment. The highest ionic and nutrient values correspond to the agriculture catchment dominated streams, particularly in the leeward side of the mountains. Oxygenation was generally close to saturation; the lowest values are due to wastewater water inflows in few localities. Streams closer to industries and city reflect higher amount of nutrients and is reflected by pollution tolerant tax (Figure 6). The most oligotrophic sites were located in mountain watercourses, while downstream sites were generally more polluted, becoming eutrophic in condition. The detailed water chemistry variables are presented in Table 1 (Source: Ramachandra T V, Subash Chandran M.D., Joshi N V, Karthick B and Vishnu D. Mukri, 2015. Ecohydrology of Lotic Ecosystems of Uttara Kannada, Central Western Ghats, In: Ramkumar, M., Kumaraswamy, K. and Mohanraj, R. (Eds.). Environmental management of River Basin ecosystems, Springer Earth System Sciences, DOI 10.1007/978-3-319-13425-3_29).
Table 1: water chemistry variables in 45 sites (streams) across river basins
Variables |
Mean |
Std. dev |
Median |
Min |
Max |
pH |
7.22 |
0.49 |
7.14 |
6.03 |
8.16 |
WT (°C) |
25.31 |
2.70 |
25.07 |
19.00 |
33.00 |
EC (µScm-1) |
160.55 |
207.10 |
107.67 |
41.55 |
1164.67 |
TDS (mg L-1) |
122.24 |
204.98 |
60.30 |
20.88 |
1299.67 |
Alkalinity (mg L-1) |
54.55 |
50.32 |
30.00 |
6.81 |
180.00 |
Chlorides (mg L-1) |
32.39 |
40.40 |
22.72 |
5.90 |
220.24 |
Hardness (mg L-1) |
51.26 |
71.05 |
28.00 |
10.00 |
348.00 |
Calcium (mg L-1) |
13.88 |
16.14 |
8.02 |
1.60 |
78.56 |
Magnesium (mg L-1) |
16.35 |
16.73 |
9.36 |
1.17 |
65.95 |
DO (mg L-1) |
6.96 |
1.68 |
7.23 |
2.93 |
10.87 |
Phosphates (mg L-1) |
0.36 |
0.56 |
0.04 |
0.00 |
2.30 |
Nitrates (mg L-1) |
0.74 |
1.10 |
0.13 |
0.03 |
4.30 |
Sulphates (mg L-1) |
25.73 |
20.84 |
16.87 |
0.00 |
74.10 |
Sodium (mg L-1) |
25.77 |
72.18 |
9.09 |
4.11 |
370.00 |
Potassium (mg L-1) |
6.33 |
15.72 |
1.30 |
0.19 |
75.00 |
The species composition contains cosmopolitan to possible Western Ghats endemic species and in general species from oligotrophy to highly eutrophic condition were also observed. Among the species observed in this study, two species were possibly endemic to Western Ghats (G. gandhii, G. difformum and few other species yet to identify). In few sites these species were very dominant reaching more than 80% of the total assemblages. The remaining dominant taxa were cosmopolitan and well documented in international literatures (Krammer and Lange Bertalot, 1986-1991). It is important to note that the indices that were developed and tested in European rivers, lacks Western Ghats endemic taxa. Most sites were oligo-mesotrophic and only a few of the streams were eutrophic. The differences in the water quality of these rivers were reflected in the values for the diatom indices, by the relative abundances of indicators of trophic/saprobic stage and by different types of diatom community.
Diatom Assemblages: Among the 113 taxa the most common and dominant diatom taxa are Eolimna subminuscula, Achnanthidium sp., Navicula sp., Nitzschia palea, Gomphonema parvulum, Gomphonema sp., Gomphonema gandhii, Achnanthidium minutissima and Cyclostephanos sp. Species richness varied from 4 to 29 with an average of 15. Shannon-Wiener diversity varied from 0.71 to 2.94 with an average of 1.76. According to the pH classification, diatom assemblages were characterized by a high proportion of neutrophilous diatom species (64.62%) followed by alcaliphilous species (26.64%). Salinity classification based on the diatom species assemblages infer the fresh to brackish water species were the dominant form with 86.16% followed by brackish to freshwater (7.84%) and exclusively freshwater (5.3%) flora.
Nitrogen autotrophic taxa, which tolerate elevated concentrations of organically bound nitrogen, were dominant with 53.31%. Species which require 100% oxygen saturation were prevailing community with 42.98% followed by low level (30% oxygen saturation) oxygen requirement species by 29.08%. The composition of diatom community with respect to saprobity in the order or oligosaprobous, β-mesosaprobous, α-mesosaprobous, α-meso-/polysaprobous and polysaprobous were 7.8%, 46.09%, 10.58%, 26.56% and 8.97% respectively. The species occurs in the eutraphentic and oligo to eutraphentic were equally dominant with respect to the trophic state explained by diatoms.
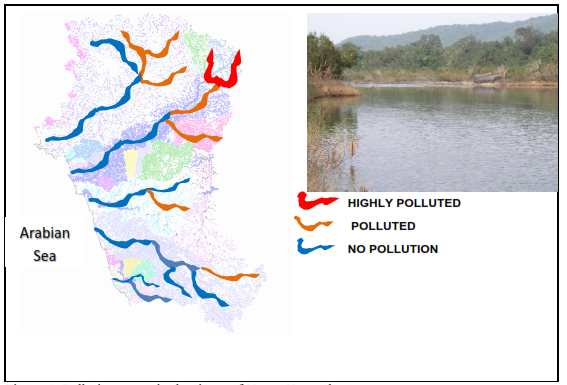
Figure 6: Pollution status in the rivers of Uttara Kannada
|
T.V. Ramachandra
Centre for Sustainable Technologies, Centre for infrastructure, Sustainable Transportation and Urban Planning (CiSTUP), Energy & Wetlands Research Group, Centre for Ecological Sciences, Indian Institute of Science, Bangalore – 560 012, INDIA.
E-mail : tvr@iisc.ac.in
Tel: 91-080-22933099/23600985,
Fax: 91-080-23601428/23600085
Web: http://ces.iisc.ac.in/energy
Vinay S.
Energy & Wetlands Research Group, Centre for Ecological Sciences, Indian Institute of Science, Bangalore – 560 012, INDIA.
E-mail: svinay@iisc.ac.in
Bharath Settur
Energy & Wetlands Research Group, Centre for Ecological Sciences, Indian Institute of Science, Bangalore – 560 012, INDIA.
E-mail: setturb@iisc.ac.in
Bharath H. Aithal
Energy & Wetlands Research Group, Centre for Ecological Sciences, Indian Institute of Science, Bangalore – 560 012, INDIA.
E-mail: bharathh@iisc.ac.in
Citation: Ramachandra T V, Vinay S, Bharath Settur and Bharath H. Aithal, 2017. Profile of Rivers in Karnataka, ENVIS Technical Report 129, Sahyadri Conservation Series 71, Energy & Wetlands Research Group, CES, Indian Institute of Science, Bangalore 560012
| Contact Address : |
| |
Dr. T.V. Ramachandra
Energy & Wetlands Research Group,
Centre for Ecological Sciences, Indian Institute of Science, Bangalore – 560 012, INDIA.
Tel : 91-80-23600985 / 22932506 / 22933099
Fax : 91-80-23601428 / 23600085 / 23600683 [CES-TVR]
E-mail : tvr@iisc.ac.in, energy@ces.iisc.ac.in,
Web : http://wgbis.ces.iisc.ac.in/energy |
|