 |
FOREST ECOSYSTEM: GOODS AND SERVICES
|
 |
| T.V. Ramachandra Subash Chandran M.D. Bharath Setturu Vinay S Bharath H. Aithal G. R. Rao |
| Energy & Wetlands Research Group, Centre for Ecological Sciences,
Indian Institute of Science, Bangalore, Karnataka, 560 012, India. E Mail: tvr@iisc.ac.in; Tel: 91-080-22933099, 2293 3503 extn 101, 107, 113 |
Forest Ecosystem – Goods and services |
FAO (2000) has defined forest as an area with an expected tree canopy of more than 10%; and a total area of more 0.5 hectares where trees reach at least 5 meters in size. Among the terrestrial biomes, forests occupy about 31 % (4,033 million hectare) of the world’s total land area and of which 93% of the world’s forest cover is natural forest and 7% is planted (FAO, 2010; TEEB, 2010). Forest ecosystems account for over two-thirds of net primary production on land–the conversion of solar energy into biomass through photosynthesis making them a key component of the global carbon cycle and climate (MEA, 2005). Forest can be defined as a terrestrial unit of living organisms (plants, animals and microorganisms), interacting among themselves and with the environment (soil, climate, water and light) in which they live. Forest ecosystem services can provide both direct and indirect economic benefits. The forests of the world harbor very large and complex biological species diversity and hence, it becomes a complex thing to assign a specific definition or explanation for it. The species diversity is an indicator for biological diversity and the species richness increases as we move from the poles to the equatorial region.
India’s forest has been classified into four major groups, namely, tropical, sub-tropical, temperate, and alpine (Champion and Seth, 1968). These major groups are further divided into 16 type groups: Tropical (wet evergreen, semi-evergreen, moist deciduous, littoral and swamp, dry deciduous, thorn, dry evergreen), Sub-tropical (broad leaved hill forests, pine, and dry evergreen), Temperate (montane wet, Himalayan moist temperate, Himalayan dry temperate), and Alpine (sub-alpine, moist alpine and dry alpine scrub). Tropical forest in particular contributes more than the other terrestrial biomes to climate relevant cycles and biodiversity related processes (Pearce and Pearce, 2001). These forests constitute the earth’s major genetic reservoir and global water cycles (Anderson and Bojo, 1992). They represent a huge economic asset for the region where they occur.
13. Ecosystem Goods and Services
The ecosystem provides various fundamental benefits for our survival such as food; soil production, erosion and control; climate regulation; water purification; bioenergy, etc. These benefits and services are referred to as ‘Ecosystem services’ and are very crucial for the survival of humans and other organisms on the earth. The ecosystems, if in a good condition perform functions which are of bio-geophysical in nature. These functions result in the flow of various services and benefits for humans and their society (Kumar and Kumar, 2008). Ecosystem Functions can be defined as ‘the capacity of natural processes and components to provide goods and services that satisfy human needs, directly or indirectly’ (De Groot et al., 2002). MEA (2005) defines ecosystem services as the benefits people obtain from ecosystems. It includes provisioning services such as food and water, regulating services such as flood and disease control, cultural services such as spiritual, recreational and cultural benefits, and supporting services such as nutrient cycling that maintains the conditions for life on earth. Sustainable ecosystem service delivery depends on the health, integrity and resilience of the ecosystem. Policy-makers, interest groups and the public require reliable information on the environmental, social and economic value of regulating services to make informed decisions on optimum use and on the conservation of ecosystems (Kumar et al., 2010).
The ecosystem goods and services grouped into four categories (MEA, 2005; Hassan et al., 2005; Fischlin et al., 2007), are:
- Provisioning services – includes products i.e., food (including roots, seeds, nuts, fruits, spices, fodder), fibre (including wood, textiles) and medicinal and cosmetic products.
- Regulating services – which are of immense importance to the human society such as (a) carbon sequestration, (b) climate and water regulation, (c) protection from natural hazards such as floods, avalanches or rock-fall, (d) water and air purification and (e) disease and pest regulation.
- Supporting services – such as primary and secondary production and biodiversity; a resource that is increasingly recognized to sustain many of the goods and services that humans enjoy from the ecosystem.
- Cultural services – which satisfy human spiritual and aesthetic appreciation of ecosystems and their components.
The goods and services of the forest ecosystems (de Groot et al., 2002) are listed in Table 7.
Table 7: Goods and services from natural ecosystems
FUNCTIONS |
ECOSYSTEM PROCESSES AND COMPONENTS |
Provisioning functions |
|
Food |
Conversion of solar energy into edible plants and animals. |
Raw materials |
Conversion of solar energy into biomass for human construction and other uses. |
Genetic resources |
Genetic material and evolution in wild plants and animals |
Medicinal resources |
Variety of (bio) chemical substances in, and other Medicinal uses of, natural biota. |
Ornamental resources |
Variety of biota in natural ecosystems with (potential) ornamental use. |
Regulation Functions |
|
Gas regulation |
Role of ecosystems in bio-geochemical cycles (e.g. CO2/O2 balance, ozone layer, etc.). |
Climate regulation |
Influence of land cover and biological mediated processes on climate. |
Disturbance prevention |
Influence of ecosystem structure on dampening environmental disturbances. |
Water regulation |
Role of land cover in regulating runoff & river discharge. |
Water supply |
Filtering, retention and storage of fresh water (e.g. in aquifers). |
Soil retention |
Role of vegetation root matrix and soil biota in soil retention. |
Soil formation |
Weathering of rock, accumulation of organic matter. |
Nutrient regulation |
Role of biota in storage and recycling of nutrients (eg. N,P&S). |
Waste treatment |
Role of vegetation & biota in removal or breakdown of xenic nutrients and compounds. |
Pollination |
Role of biota in movement of floral gametes. |
Biological control |
Population control through trophic-dynamic relations. |
Information functions |
|
Aesthetic information |
Attractive landscape features. |
Recreation |
Variety in landscapes with (potential) recreational uses. |
Cultural and artistic information |
Variety in natural features with cultural and artistic value. |
Spiritual and historic information |
Variety in natural features with spiritual and historic value. |
Science and education |
Variety in nature with scientific and educational value. |
Habitat functions |
|
Refugium function |
Suitable living space for plants and animals. |
Nursery function |
Suitable reproduction habitat. |
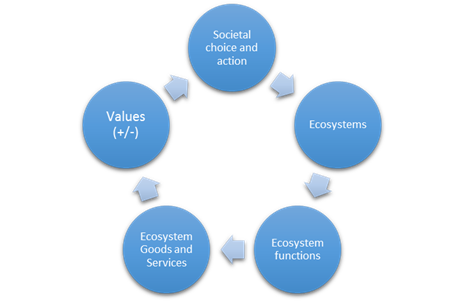
Valuation of Ecosystem Goods and Services: The prime reason for ecosystem mismanagement is the failure to realise the value of ecosystem. Economic valuation of natural resources aid in wise-use and sustainable management through a means for quantification and comparing the various benefits of resources (Boominathan et al., 2008).Valuation of ecosystem is essential to respite human activities apart from accounting their services in the regional planning (Ramachandra et al., 2011). The range of benefits derived from ecosystem canbe direct or indirect, tangible or intangible, can be provided locally or at global scale – all of which makes measurement particularly hard(TEEB, 2010). Economic valuation method would capture the output of ecological production function to arrive at economic values. These values would be used by the social planners to design responses to better manage the ecosystems and related human well being (Kumar and Kumar, 2008). Figure 6 shows the interrelationship of ecosystem, ecosystem functions, economic values and its impact on ecosystem through incentive/disincentive.
Valuation of ecosystems enhances the ability of decision-makers to evaluate trade-offs between alternative ecosystem management regimes and courses of social action that alter the use of ecosystems and the multiple services they provide (MEA 2003, MA 2005). Valuation reveal the relative importance of different ecosystem services, especially those not traded in conventional markets (TEEB, 2010).
The value of natural resources includes use (such as direct use, indirect use and option values) and non-use (derived from the knowledge) values within the Total Economic Value (TEV) framework. Main components of non-use value are bequest value, altruistic value and existence value.
Figure 6: Ecosystems health and economic values
Biodiversity and ecosystems have intrinsic value and people take decisions concerning ecosystems based on considerations of human wellbeing as well as intrinsic values. Ecosystem services are grouped as provisioning, regulating, cultural and supporting services (MEA, 2003), based on the TEV framework with significant emphasis on intrinsic aspects of ecosystem value, particularly in relation to socio-cultural values (UNEP, 2008; Pittini, 2011).
TEEB (The Economics of Ecosystems and Biodiversity), a major international undertaking by the environment ministers of G8+5 countries in 2007 makes a serious attempt to address the economics of ecosystem and biodiversity (TEEB, 2010) based on the established work of MEA (2003). However TEEB (2010) deviates from MEA by excluding the supporting services (such as nutrient cycling and food-chain dynamic) and inclusion of habitat service as a separate category.
Integrated framework for assessing the ecosystem goods and services (de Groot et al., 2002) involves the translation of complex structures and processes into a limited number of ecosystem functions namely production, regulation, habitat and information. These goods and services are valued by humans and grouped as ecological, socio-cultural and economic values.
- Ecological value - The ecological value or importance of a given ecosystem is determined both by the integrity of the regulation and habitat functions of the ecosystem and by ecosystem parameters such as complexity, diversity, and rarity. The goods and services provided by the ecosystems depend on the related functional abilities of the ecosystem and the limits of sustainable use based on ecological criteria such as integrity, resilience, and resistance (de Groot et al., 2002). .
- Socio-Cultural value - Social values and perceptions in addition to ecological criteria, play an important role in determining the importance of natural ecosystems, and their functions, to human society (de Groot et al., 2002). Social reasons play an important role in identifying important environmental functions, emphasizing physical and mental health, education, cultural diversity and identity (heritage value), freedom and spiritual values.
- Economic value - Economic value is the value that a person is willing to give up in order to obtain goods, service, or state of the world. A person’s willingness to pay states the economic preferences attached to the particular environmental benefit.Thus their willingness to pay reflects the economic value (Ramachandra et al., 2005). Economic value establishes a common metric of value (money). All values are estimated using the common metric, which helps in aggregating values of different goods and services (DEFRA, 2007). When the market does not capture the value of environmental goods or services, techniques associated with ‘shadow pricing’ or ‘proxy price’ are used to indirectly estimate its value.
Estimation of the economic values for 17 different ecosystem services for 16 different biomes based on earlier published studies and some original calculations (Costanza et al., 1997) highlight that the annual value of the ecosystem services of the terrestrial and aquatic biomes of the world is in the range of USD 16–54 trillion with an estimated average of USD 33 trillion. This value was found to be 1.8 times higher than the global gross national product (GNP). About 63% of the estimated values of ecosystem services were found to be contributed by the marine ecosystems while about 38% of the estimated values were found to be contributed by the terrestrial ecosystems, mainly from the forests and wetlands.
Forest Ecosystem Services
Forest ecosystem services, like services from other ecosystem, have great economic value (Costanza et al., 1997; Pearce and Pearce 2001; Pearce et al., 2002). Forests worldwide are known to be critically important habitats in terms of the biological diversity they contain and in terms of the ecological functions they serve. Forests, particularly tropical forests, contribute more than other terrestrial biomes to climate relevant cycles and processes and also to biodiversity related processes (Nasi et al., 2002). Forest ecosystem services, as with other nature’s services, have also been claimed to be of great economic value (Costanza et al., 1997; Pearce and Pearce 2001; Pearce and Moran 1994). These ecosystems are extremely important refuges for terrestrial biodiversity, serve as a central component of Earth’s biogeochemical systems and are a source of ecosystem services essential for human well-being (Gonzalez et al., 2005).
The forest ecosystem provides a large number of valuable products such as timber, firewood, non-timber forest product, biodiversity, genetic resources, medicinal plants, etc. The forest trees are felled on a large scale for using their wood as timber and firewood. There are two types of needs for timber: commercial and industrial. The commercial timber production is the local utilization of timber while the industrial timber is used by the industries. According to FAO (2010), wood removals valued just over US$100 billion annually in the period 2003–2007, mainly accounted for by industrial round wood. Further, 11% of world energy consumption comes from biomass, mainly fuel wood (CBD, 2001). 19% of China's primary energy consumption comes from biomass, the figure for India being 42%, and the figure for developing countries generally being about 35% (IEA 1998; UNDP 2000). Non-commercial sources of energy (such as fire wood, agriculturaland horticultural residues, and animal residues) contribute about 54% of the total energy in Karnataka.
Timber and carbon wealth assessment in the forests of India (Atkinson and Gundimeda, 2006) show the opening stock of forest resources as 4,740,858,000 cubic meters and about 639,600 sq. km of forest area at the beginning of 1993-94. Biomass density/ha in Indian forests is about 92 t/ha and carbon values of Indian forests is 2933.8 million tones assessed considering a carbon content of 0.5 Mg C per Mg oven dry biomass (Haripriya, 2002). The closing stock of the timber is 4704 million cum and the estimate of value is Rs. 9454 billion, the stock of the carbon is 2872 million tons with a value estimate of Rs.1811 billion.
Apart from serving as a storehouse of wood which is used for various purposes, there are also equally important non-wood products that are obtained from the forests. The botanical and other natural products, other than timber extracted from the forest system are referred to as non-timber forest products (NTFPs). These resources/products have been extracted from the forest ecosystems and are being utilised within the household or marketed or have social, cultural or religious significance (FAO, 1990). NTFP is a significant component due to its important bearing on rural livelihoods and subsistence. NTFPs are also referred ‘minor forest produce’ as most of NTFP are consumed by local populations, and are not marketed (Arnold and Pérez, 2001). These include plants and plant materials used for food, fuel, storage and fodder, medicine, cottage and wrapping materials, biochemical, animals, birds, reptiles and fishes, for food and feather. Unlike timber-based products, these products come from variety of sources like: fruits and vegetables to eat, leaves and twigs for decoration, flowers for various purposes, herbal medicines from different plant parts, wood carvings and decorations, etc. The values of NTFPs are of critical importance as source of income and employment for rural people living around the forest regions, especially during lean seasons of agricultural crops.
NTFPs provide 40-63% of the total annual income of the people residing in rural areas of Madhya Pradesh (Tewari and Campbell, 1996) and accounted 20-35% of the household incomes in West Bengal. Similarly wild plant resources contributed US$ 194 – 1114per household per year in seven study areas in southern African region (Shackleton et al., 2000). The net present value (NPV) of the forest for sustainable fruit and latex production is estimated at US$6,330/ha considering the net revenue from a single year’s harvest of fruit and latex production as US$422/ha in Mishana, Rio Nanay, Peru (Peters et al., 1989) on the assumption of availability in perpetuity, constant real prices and a discount rate of 5%.
Evaluation of the direct use benefits to rural communities’ from harvesting NTFPs and using forest areas for agriculture and residential space, near the Mantadia National Park, in Madagascar (Kramer et al., 1992; 1995)through contingency valuation (CV) show an aggregate net present value for the affected population (about 3,400 people) of US$673,000 with an annual mean value per household of USD 108.
Estimation of the quantity of the NTFPs collected by the locals and forest department based on a questionnaire based survey in 21 villages of four different forest zones in Uttara Kannada district (Murthy et al., 2005), indicate the collection of 59 different plant species in the evergreen forests, 40 different plant species in the semi-evergreen forests, 12 different plant species in moist deciduous and 15 different plant species in dry deciduous forests and about 42–80 NTFP species of medicinal importance are marketed in herbal shops. Valuation reveal an annual income per household ranges from Rs. 3,445 (evergreen forests), 3,080 (moist deciduous), 1,438 (semi-evergreen) to Rs. 1,233 (dry deciduous).
Assessment of the marketing potential of different value added products from Artocarpus sps. in Uttara Kannada district based on field surveys and the discussions with the local people and industries (Ramana and Patil, 2008), revealed that Artocarpus integrifolia collected from nearby forest area and home gardens is most extensively used for preparing items like chips, papad, sweets, etc. Chips and papads are commercially produced and sold in the markets, and primary collectors get 25% and the processing industry get 50% of of the total amount paid by the consumers.
Forest ecosystems also provide other indirect benefits like ground water recharge, soil retention, gas regulation, waste treatment, pollination, refugium function, nursery function etc. in addition to the direct benefits (De Groot et al., 2002). Forest vegetation aids in the percolation and recharging of groundwater sources while allowing moderate run off. Gas regulation functions include general maintenance of habits through the maintenance of clean air, prevention of diseases (e.g. skin cancer), etc.
Forests act as carbon sinks by taking carbon during photosynthesis and synthesis of organic compounds, which aids in maintaining CO2/O 2 balance, ozone layer and also sulphur dioxide balance. Carbon sequestration potential of 131t of carbon per hectare with the above ground biomass of 349 ton/ha has been estimated in the relic forest of Uttara Kannada (Chandran et al., 2010) and 11.8 Metric ton (1995) in forests in India with the carbon uptake potential of 55.48 Mt (2020) and 73.48 Mt (2045) respectively (Lal and Singh, 2000) projected the total carbon uptake for the year 2020 and 2045 and the value was found to be. The carbon sequestration potential was found to be 4.1 and 9.8 Gt by 2020 and 2045 respectively.
Vegetative structure of forests through its storage capacity and surface resistance plays a vital role in the disturbance regulation by altering potentially catastrophic effects of storms, floods and droughts. Soil retention occurs by the presence of the vegetation cover which holds the soil and prevents the loss of top soil. Pollination is an important ecological service provided by the forest ecosystem and the studies have revealed of forest dwelling pollinators (such as bees) make significant contribution to the agricultural production of a broad range of crops, in particular fruits, vegetables, fiber crops and nuts (Costanza et al., 1997).
Forest also helps in aesthetic benefit, recreational benefit, science and education, spiritual benefits, etc. The scenic beauty of forests provides aesthetic and recreational benefits through psychological relief to the visitors. An investigation of cultural services of the forest of Uttaranchal (Djafar, 2006) considering six services namely aesthetic, recreational, cultural heritage and identity, inspirational, spiritual and religious and educational function, highlight the recreational value of forests US$ 0.82/ha/yr for villager’s per visit. Aesthetic value derived by the preference of the villagers was estimated as US$ 7-1760 /ha/yr derived by the preference of the villagers to live in the sites where there is good scenery. Cultural heritage and identity value was estimated as USD 1-25/ha/yr based on 24 places, 43 plant species and 16 animal species. Spiritual and religious areas was about USD 1-25/ha/yr. Educational value was obtained from the research activity and value was similar to spiritual and religious values.
Ecotourism benefit of the domestic visitor using the travel cost method in the Periyar tiger reserve in Kerala is Rs. 161.3 per visitor (Manoharan et al. 1999), with average consumer surplus at Rs. 9.89 per domestic visitor and Rs. 140 for foreign tourists. The value of eco-tourism (as per 2005) is extrapolated as Rs. 84.5 million. The recreational value assessment of Vazhachal and Athirappily of Kerala (Anitha and Muraleedharan, 2006) reveal that visitor flow on an average is 2.3 lakh (at Vazhachal) and 5.3 lakh (Athirappily) visitors/year and the average fee collection ranges from Rs. 10 (Vazhachal) to Rs.23.5 (Athirappily) lakh / year at. Parking fee for vehicles itself is about Rs. 1.39 (Vazhachal) lakh /year and Rs. 2.7 (Athirappily) lakh/ year. About Rs. 5.6 lakh is earned from visitors entrance fee and parking charges. The estimated aggregate recreation surplus of the sample is equal to Rs 20, 69,214 with an average recreation surplus per visitor of Rs. 2,593.
Recreational value in the protected site of Western Ghats (Mohandas and Remadevi, 2011) based on the relationship between travel cost and visitation rate and the willingness to pay is Rs. 26.7 per visitor and the average consumer surplus per visit is Rs. 290. A similar study carried out in the valley of a national park show the net recreational benefit as Rs.5,88,332 and the average consumer surplus as Rs 194.68 (Gera et al., 2008). The total recreation value of Dandeli wildlife sanctuary using travel cost method during 2004-05 show the total recreation value of Rs. 37,142.86 per Sq. kmwith the total value of Rs. 1,76,43,600 (Panchamukhi et al., 2007). Similarly, based on the willingness to pay for the preservation of watershed in Karnataka estimate show a value of Rs.125.45per hectare and the total value of Rs. 480 million (for 2004-05).
Valuation of forest in Uttarakhand, Himalayas using the benefit transfer method (Madhu Verma, 2007) shows a value of Uttarkhand forests as Rs. 16,192 billion accounting Rs. 19,035 million from the direct benefits (including tourism) and Rs. are the indirect benefits as173,120 million and silt control service is accounted as Rs. 2062.2 million. Carbon sequestration is accounted as Rs.2974/million at US $ 10 per t of C considering the net accumulation of 6.6 Mt C per year in biomass. Aesthetic beauty of the landscape is estimated as 10,665.3 million and pollination service value is accounted to be Rs. 25,610 million/yr. Natural ecosystems also provide unlimited opportunities for environmental education and function as field laboratories for scientific research (De Groot et al., 2002).
Sacred groves present in varied ecosystems viz., evergreen and deciduous forests, hill tops, valleys, mangroves, swamps and even in agricultural fields in Uttara Kannada district represent varied vegetation and animal profiles (Ray et al., 2011).The protection of patches of forest as sacred groves and of several tree species as sacred trees leads to the spiritual function provided by the forest (Chandran, 1993). Sacred groves also play an important role in the cultural service provided by the forest. The groves do not fetch any produce which can be used for direct consumptive or commercial purpose. Creation of hypothetical market fetches price worth Rs. 600/quintal for a woody species and Rs. 40/quintal for non wood product. The value of sacred grove assessed through willingness to pay to preserve the sacred grove in Siddapur taluk of Uttara Kannada district (Panchamukhi et al. 2008), show the value Rs. 7280/per hectare.
The major threat to the forests today is deforestation caused by several reasons such as rise in the population, exploitation activities which include expansion of agriculture land, ranching, wood extraction, development of infrastructure. Shifting cultivation is considered to be one of the most important causes of deforestation (Myers, 1984). The loss of biodiversity is the second most important problem in nearly every terrestrial ecosystem on Earth. This loss is accelerating driven by the over-exploitation of natural resources, habitat destruction, fragmentation and climate change (MEA, 2003). Even though the Convention on Biological Diversity (CBD) has adopted a target of reducing the rate of biodiversity loss at global, regional and national levels by 2010 (Mace, 2005; Fontaine et al., 2007), still the loss of biodiversity is at a high pace. Nearly 75% of the genetic diversity of domesticated crop plants has been lost in the past century (WEHAB, 2002),.About 24% of mammals and 12% of bird species are currently considered to be globally threatened. Despite the essential functions of ecosystems and the consequences of their degradation, ecosystem services are undervalued by society, because of the lack of awareness of the link between natural ecosystems and the functioning of human support systems.
METHOD – Valuation of Ecosystem Goods and Services
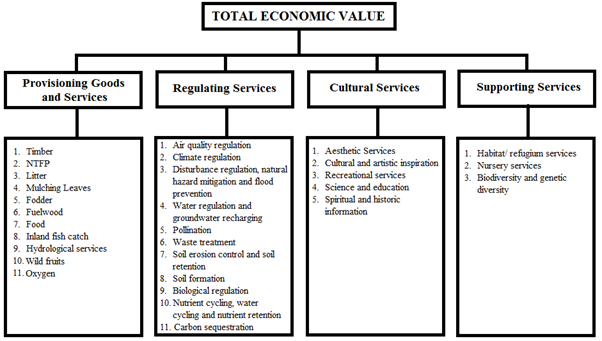
The framework for incorporating the true value of forest in the GDP requires thorough valuation of the benefits derived from forest ecosystems. Taluk wise forest valuation has been done through the quantification of goods, estimation of values based on the market price, and compilation of values of ecosystem services form literatures. Total economic value of the forest ecosystems in Uttara Kannada has been done (which is discussed in the following sections) considering i) provisioning services, ii) regulating services, iii) supporting services and iv) information services (MEA 2003). Various components of provisioning, regulating, cultural and supporting services are listed in Figure 7. The research includes compilation of data from primary (field investigations) and secondary sources (government agencies, published scientific literatures in peer reviewed journals). Data on quantity of timber and non – timber forest products harvested were collected from Divisional Office (Sirsi) of Karnataka Forest Department, Government of Karnataka. Data on the prices of various marketed forest products were collected through market survey. Data on various other provisioning goods and services were compiled from literature pertaining to ecological and socio-economic studies in the district and also through interview with the subject experts.
Figure 7: Classification of forest ecosystem goods and services
Framework of valuation: Figure 7 outlines the method adopted for valuing forest ecosystems (talukwise) in Uttara Kannada district. The work entails:
- Assessment of different land uses in the district: This was done considering remote sensing data of space borne sensors (IRS P6) with spatial resolution of 5.8m. The remote sensing data were geo-referenced, rectified and cropped pertaining to the study area. Geo-registration of remote sensing data has been done using ground control points collected from the field using pre calibrated GPS (Global Positioning System) and also from known points (such as road intersections, etc.) collected from geo-referenced topographic maps published by the Survey of India (1:50000, 1:250000).
Remote sensing data analysis involved i) generation of False Colour Composite (FCC) of remote sensing data (bands – green, red and NIR). This helped in locating heterogeneous patches in the landscape; ii) selection of training polygons (these correspond to heterogeneous patches in FCC) covering 15% of the study area and uniformly distributed over the entire study area; iii) loading these training polygons co-ordinates into pre-calibrated GPS;vi) collection of the corresponding attribute data (land use types) for these polygons from the field. GPS helped in locating respective training polygons in the field; iv) supplementing this information with Google Earth (http://googleearth.com); and v) 60% of the training data has been used for classification, while the balance is used for validation or accuracy assessment. Land use analysis was carried out using supervised pattern classifier - Gaussian maximum likelihood algorithm based on probability and cost functions (Ramachandra et al., 2012). Accuracy assessment to evaluate the performance of classifiers was done with the help of field data by testing the statistical significance of a difference, computation of kappa coefficients and proportion of correctly allocated cases. Statistical assessment of classifier performance based on the performance of spectral classification considering reference pixels is done which include computation of kappa (κ) statistics and overall (producer's and user's) accuracies.
The forest was classified as evergreen, semi evergreen to moist deciduous, dry deciduous, teak and bamboo plantations, scrub forest and grasslands and acacia plantations. The extent of forest fragmentation was assessed for estimating the carbon sequestration potential of forests through the quantification of the extent of interior and fragmented forests at taluk level.
- Quantification of goods and services: compilation of data from primary (field investigations) and secondary sources (government agencies, published scientific literatures in peer reviewed journals). Data on quantity of timber and non – timber forest products harvested were collected from Divisional Office (Sirsi) of Karnataka Forest Department, Government of Karnataka.
-
Valuation of goods and services: Various functions of forests are the results of interaction between structure and processes, which may be physical (e.g. infiltration of water, sediment movement), chemical (e.g. reduction, oxidation) or biological (e.g. photosynthesis and denitrification). Further, various goods and services obtained from the functioning of forest ecosystem were classified as provisioning goods and services, regulating services, cultural services and supporting services. The study uses two approaches of valuation for the computation of TEV of forest ecosystem, namely: ‘market price’ method and ‘benefit transfer’ method of valuation.
Figure 8:Framework for valuation of goods and services from forest ecosystem
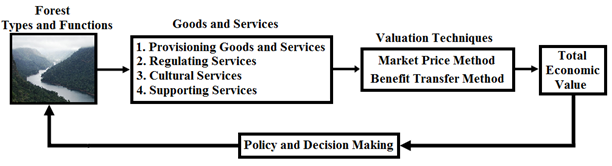
- Market price: This technique estimates the economic values of those goods and services that arebought and sold in established markets. Valuation of provisioning goods and services has been done through ‘market price’ valuation. For those goods and services which do not pass through market transaction process (viz. water utilization for irrigation and power generation, ecological water, wild fruits) well adopted technique of proxy/ shadow prices have been used.
- Benefit transfer: This technique involves the application of value estimates, functions, data and/ or models developed in one context to address a similar resource valuation question in an alternative context (USFWS, 1995).The cost of surveys in terms of time and money could be avoided by this approach. Benefit transfer method of valuation is used to compute the value of regulating, cultural and supporting services. Some of the components of these services were computed based on unit values of those services for different types of forest based on the discussion and interview with subject experts.
2. Quantification of goods and services: The detailed procedure of valuation of different components of ecosystem services is discussed below:
- Provisioning services from forest ecosystem: Goods derived from the forests are quantified as follows:
- Timber: Timber is an important component of value on forestland properties. In many cases, the value of the timber can be several times the value of the land. Timber includes rose wood, teak wood, jungle wood, etc. Timber is mainly prominent in Deciduous forest while is found in less amount in Evergreen forest patches. Plantation forest is mainly abundant in timber producing trees like Acacia, Teak etc. Industrial produce is also present from the forest which includes round wood, soft wood, match wood etc.The data regarding the quantity of timber harvested and sold was obtained from the Karnataka Forest department and the valuation is based on the current market price.
- Non timber forest product: The data on the harvesting of non timber forest product was obtained from the Forest department. The total value of NTFP includes the value of a) NTFPs extracted by Forest Department, b) NTFPs collected by households (Murthy et al., 2005), c) bamboo extracted by the Karnataka Forest department, d) annual bamboo productivity in the forest (NABARD, 2012), e) cane extracted by Forest department and f) annual cane productivity in the forest (Lakshamana, 2007).
- Litter: Litter is used as manure in horticulture and agriculture fields.Quantity of litter productivity per year for different taluks was based on the earlier work (Ramachandra et al., 2000a).
- Mulching leaves: Mulching leaves is used as manure in arecanut gardens. Per year requirement of mulching leaves from forest were quantified by the area of arecanut gardens in each taluka multiplied by the minimum quantity of mulching leaves per hectare of arecanut garden.
- Fodder: Total value of fodder supplied from forest were quantified by using the data from literature (Prasad et al., 1987; Ramachandra et al., 2000) on herb layer productivity in different types of forests, extent of different types of forest and unit market price of the fodder in the district.
- Medicinal Plants: Various medicinal plants used by the local people were identified (Harsha et al., 2002; 2003; 2005, Hegde et al., 2007) and the value of medicinal plants per unit area of forest area (Kumar, 2004; Simpson et al., 1996) was extrapolated to different types of forest in the district.
- Fuelwood: The total value of fuelwood includes the value of fuelwood used for domestic purpose i.e. for cooking and water heatingand also the value of fuelwood used for various industrial and commercial purposes like jaggery making, areca processing, cashew processing, restaurants and bakery, parboiling, cremation,etc.The quantity of fuelwood for domestic usage in different locations of the district was obtained from Ramachandra et al., 2000 and the quantity of fuelwood required for various other purpose were based on field experiments (Balasubramanya and Balachandra, 2001; Kishore et al., 2004; Lokras, 2012; Ramachandra, 1998; Ramachandra et al., 2000a).
- Food: 22 varieties of food products derived from forest were identified and the value of food extracted per unit area of forest obtained from literature (Hebbar et al, 2010; Kumar, 2010; Kumar, 2011) was extrapolated to the total forest area in the taluk. Also the household honey collection which is an important provisioning servicefrom forest was quantified (Ramachandra et al., 2012; Bhat and Kolatkar, 2011) for all talukas and valued.
- Inland fish catch:Inland fishing is an important economic activity and a determinant of nutritional requirement of large number of people. Inland fishing happens in rivers, rivulets, streams, reservoirs, lakes, etc. which are inseparable part of the forest area in the district.The quantity of inland fish catch in different taluks were obtained from Fisheries Department, GoK and the economic value of it was determined.
- Hydrological Services: Most of the water resources come from the forested catchments. Hydrological services is quantified by the quantity of domestic water utilization, water for irrigation purpose (ICAR, 1980; Ramachandra et al., 1999), water for industrial use and water used for power generation (5 hydro power stations and 1 nuclear power station).The quantity of water required for sustenance of forest ecosystem i.e. ecological water available for different types of forest was quantified as per the following equation (Raghunath, 1985, Ramachandra et al., 1999).
Quantity of Ecological Water = Runnoff Coefficient x Annual Precipitation x Forest Area
The value of ‘runoff coefficient’ for different types of forest varied from 0.1 to 0.4.
- Wild fruits: Information on various wild fruits wereobtained from literature (Bhat et al., 2003a; Hebbar et al., 2010).The productivity of wild fruits was estimated based on Bhat et al., (2003a), transect survey data in different types of forestand information from local people. For economic valuation of wild fruits proxy price (in comparison with the price of fruits collected as NTFP) was used.
- Oxygen provision: Value of oxygen provision from forests was quantified based on the values of oxygen production per hectare of subtropical forest (Maudgal and Kakkar, 1992).
These provisioning services were valued as per the equations in Table 8 based on market price method.
Table 8:Valuation method for components of provisioning services of forest
Sl. No. |
Provisioning services |
Equation |
Details |
1 |
Timber |
Q=Quantity of timber; P = Price of timber; i = no. of taluks; j = variety of timber |
|
2 |
NTFP |
Q=Quantity of NTFP; P = Price of NTFP; i = no. of taluks; j = variety of NTFP |
|
3 |
Litter |
Q=Quantity of litter; P = Price of litter; i = no. of taluks |
|
4 |
Mulching Leaves |
Q=Quantity of mulching leaves; P = Price of mulching leaves; i = no. of taluks |
|
5 |
Fodder |
Q=Quantity of fodder; P = Price of fodder; i = no. of taluks |
|
6 |
Fuelwood |
Q=Quantity of fuelwood; P = Price of fuelwood; i = no. of taluks |
|
7 |
Food |
Q=Quantity of food; P = Price of food; i = no. of taluks; j = variety of food product |
|
8 |
Inland fish catch |
Q=Quantity of fish catch; P = Price of fish; i = no. of taluks |
|
9 |
Hydrological services |
Q=Quantity of water utilization for different purpose; P = Price of water used for different purpose; i = no. of taluks |
|
10 |
Wild fruits |
Q=Quantity of wild fruits; P = Price of wild fruits; i = no. of taluks |
|
11 |
Oxygen |
Value of oxygen provision from forests was quantified based on the values of oxygen production per hectare of subtropical forest (Maudgal and Kakkar, 1992). |
|
-
Regulating Services from forest ecosystem: Regulating services provide many direct and indirect benefits to humans. The maintenance of the Earth’s biosphere in a hostile cosmic environment depends on a delicate balance between these regulating services (de Groot et al., 2002). However, regulating services unlike provisioning services poses much greater challenges in valuation. Though regulating services are seldommarketed, the economy heavily depends upon the utility of these services. In the present study, ten variables of regulating services were quantified as per Costanza et al. (1997) and the value of carbon sequestration was estimated for each taluk based on the biomass stock and productivity (Ramachandra et al., 2000a; Ramachandra et al., 2010).
Table 9: Unit values of regulating services from forests (Rs. per hectare)
Sl. No. |
Regulating service |
Unit Value |
1 |
Air quality regulation |
6384 |
2 |
Climate regulation |
10704 |
3 |
Disturbance regulation, natural hazard mitigation and flood prevention |
217872 |
4 |
Water regulation and groundwater recharging |
261360 |
5 |
Pollination |
1200 |
6 |
Waste treatment |
4176 |
7 |
Soil erosion control and soil retention |
11760 |
8 |
Soil formation |
480 |
9 |
Biological regulation |
1104 |
10 |
Nutrient cycling, water cycling and nutrient retention |
44256 |
Source: Costanza et al., 1997.
carbon sequestration and per year value of interest (considering 5% interest rate) over the total stock/ volume of carbon in the forest till date.
- Cultural services from forest ecosystem: Forest has a high cultural value; the main reason can be attributed to the aesthetic beauty, recreational benefit and Kan forest which are the sacred groves present in the district. Sacred groves are communally-protected forest fragments with significant religious connotations (Ray and Ramachandra, 2010). Further, recreational benefits provided by the forest include gaming, walking, hunting etc. Aesthetic beauty of the forest is valuable, the presence of waterfalls and caves adds to the aesthetic value in the district. Science and educational value provided by the forest are also indispensable. The unit value for the services was derived from De Groot et al., 2002 and Costanza et al., 1997 and also the values were finalised in consultation with subject experts. The unit values are presented in Table 10.
Table 10: Unit values of cultural services from forest
Sl. No. |
Cultural Services |
Value |
Source |
1.a |
Recreational services (for interior evergreen forest) |
2,88,000 |
de Groot et al., 2002 |
1.b |
Recreational services (for other types of forest) |
28,944 |
Costanza et al., 1997 |
2.a |
Spiritual and historic information (for interior evergreen forest) |
72,000 |
Discussion with subject experts |
2.b |
Spiritual and historic information (for interior evergreen forest) |
1,200 |
de Groot et al., 2002 |
3 |
Aesthetic Services |
1,500 |
Discussion with subject experts |
4 |
Cultural and artistic inspiration |
480 |
Discussion with subject experts |
5 |
Science and education |
48,000 |
Discussion with subject experts |
- Supporting services from forest ecosystem: The supporting service provided by the forest includes the habitat/ refugium function, nursery function and biodiversity and genetic diversity function. The forest provides living space for a large number of plants and animals thus playing an important role in the refugium function. It also acts as a nursery for immense plants and animals. The forest also serves as a store house of information. To maintain the viability of this genetic library, the maintenance of natural ecosystems as habitats for wild plants and animals is essential. The unit value of habitat/ refugium function and nursery function were derived from literature and the unit value of biodiversity and genetic diversity was estimated based on the flow value of selected provisionservices that represent the least value stock of biodiversity and genetic diversity. The unit values are presented in Table 11.
Table 11: Unit value of supporting services from forest
Sl. No. |
Supporting Services |
Value |
Source |
1 |
Habitat/ refugium services |
73104 |
de Groot, 2002 |
2 |
Nursery services |
9360 |
de Groot, 2002 |
3 |
Biodiversity and genetic diversity |
40000 |
Calculated from the flow value selected provisioning services like NTFP, medicinal plants, etc. |
Total Economic Value
The total economic value (TEV) of forest ecosystem is obtained by aggregating provisiongoods and services, regulating services, cultural services and supporting services.
TEV = Provisioning services + Regulating services + Cultural services + Supporting Services |
The total economic value that has been calculated for one year is divided by the area of forest in each taluk to obtain the per hectare value of forest in respective taluk.
REFERENCES
- Anderson, T and J Bojo. 1992. 'The Economic Value of Forests' in Anil Agarwal (edt.), The Price of Forests, CSE, New Delhi.
- Anitha, V. and P.K. Muraleedharan. 2006. Economic valuation of ecotourism development of a recreational site in the natural forests of southern Western Ghats, KFRI Research Report, Kerala Forest Research Institute, Peechi.
- Arnold, J.E.M. and M. Ruiz Pérez. 2001. 'Can non-timber forest products match tropical forest conservation and development objectives?', Ecological Economics, Vol. 39, No. 3, pp. 437–447.
- Atkinson, Giles and Haripriya Gundimeda. 2006. ‘Accounting for India's forest wealth’, Ecological Economics, Vol. 59, No. 4, pp. 462-476.
- Balasubramanya, M.H., and P Balachandra. 2001. An Exploratory Study of Environmental Pollution by Small Scale Industries Sector in Karnataka, EERC Working Paper Series: IPP-2, IGIDR, Mumbai.
- Bauhus, J., Peter Van der Meer and M. Kanninen. 2010. Ecosystem goods and services from plantation forest. Earthscan, London.
- Beerappa, M. and A.G. Koppad. 2009. 'Assessment of fuel wood collection on depletion of forest resources in Uttara Kannada district', Karnataka Journal of Agricultural Sciences. Vol. 22, No. 4, pp. 935-936.
- Bhat, P. R. and Milind Kolatkar. 2011. Performance and problems of the bee keeping industry in Karnataka, CES Technical Report No. 124, CES, IISc, Bangalore.
- Bhat, D.M., N.S. Prasad, M. Hegde, C.J. Saldanha. 1984. Plant diversity studies in Uttara Kannada district, CES Technical Report No. 9, CES, IISc, Bangalore.
- Bhat, D. M., K. S. Murali and N. H. Ravindranath. 2003. 'Carbon stock dynamics in tropical rain forest of Uttara Kannada district, Western Ghats, India', International Journal of Environment and Pollution,Vol. 19, No. 2, pp. 139-149.
- Bhat, P. R., K. S. Murali, G. T. Hegde, C. M. Shastri, D. M. Bhat, Indu K. Murthy and N. H. Ravindranath. 2003a. 'Annual variation in non-timber forest product yield in Western Ghats, Karnataka, India', Current science,Vol. 85, No. 9, pp. 1350-1355.
- Bourgeon, G. 1989. Explanatory booklet on the reconnaissance soil map of forest area: Western Karnataka and Goa,French Institute, Pondicherry.
- Boominathan M., M.D. Subash Chandran and T.V. Ramachandra. 2008. Economic valuation of bivalves in the Aghnashini Estuary, West Coast, Karnataka, ENVIS Technical Report No. 30, Environmental Information System, CES, Bangalore.
- CBD (Secretariat of the Convention on Biological Diversity). 2001. The Value of Forest Ecosystems. CBD Technical series number-4, Secretariat of the Convention
on Biological Diversity, Montreal. - Champion, H. and S.K. Seth. 1968. A revised survey of the forest types of India. Govt. of India Publication, New Delhi.
- Chandran, M. D. S. 1984. Ecosystem studies and management in Coastal Uttara Kannada. CES Technical Report No. 3, CES, IISc, Bangalore.
- Chandran, M. D. S. 1987. The Impact of Forest based industries on the Evergreen Forest of Uttara Kannada. CES Technical Report No. 34, CES, IISc, Bangalore.
- Chandran, M. D. S. 1993. Vegetational changes in the evergreen forest belt of the Uttara Kannada District of Karnataka State, Ph.D. Thesis submitted to Karnataka University, Dharwad, India.
- Chandran M.D.S., G.R. Rao, K.V. Gururaja and T.V. Ramachandra. 2010. ‘Ecology of the Swampy Relic Forests of Kathalekan from Central Western Ghats, India', Bioremediation, Biodiversity and Bioavailability, Vol. 4, No. 1 (Special Issue), Global Science Books, pp. 54-68.
- Costanza, R., R d’Arge, R de Groot, S Farberk, M Grasso, B Hannon, K Limburg, S Naeem, R V. O’Neill, J Paruelo, R G. Raskin, P Suttonkk and M van den. Belt. 1997. 'The value of the world’s ecosystem services and natural capital', Nature, Vol. 387, No. 6630, pp. 253-260.
- Daily, G.C., P.A. Matson. 2008. Ecosystem services: from theory to implementation. PNAS, Vol. 105, No. 28, pp. 9455–9456.
- Daniels, R.J.R. 1989. A Conservation Strategy for the Birds of Uttara Kannada district, Ph.D. Thesis, Centre for Ecological Science, Indian Institute of Science, Bangalore.
- Daniels, R.J.R., Malati Hegde, N.V. Joshi and Madhav Gadgil. 1991. 'Assigning conservation value: A case study from India', Conservation Biology, Vol. 5, No. 4, pp. 464-475.
- de Groot, R. S., Matthew A. Wilson, Roelof M.J. Boumans. 2002. 'A typology for the classification, description and valuation of ecosystem functions, goods and services', Ecological Economics, Vol. 41, No. 3, pp. 393–408.
- DEFRA. 2007. An Introductory Guide to Valuing Ecosystem Services, Department for Environment, Food and Rural Affairs, London.
- Djafar, Febi. 2006. Cultural Services of Forests: A case study in Garhwal Hills, Uttaranchal, India. NETFOP Report 07. Alterra, Wageningen UR
- FAO. 1990. The major significance of Minor Forest roduct. The local use and value of forest in the West African Humid Forest Zone, Community Forestry Note 6, FAO, Rome.
- FAO. 2000. On definitions of forest and forest change. FRA Working Paper 33. FAO, Rome.
- FAO. 2010. Global Forest Resources Assessment-2010, Forestry Paper 163, FAO, Rome.
- Fontaine, B., P Bouchet, K V Achterberg, M A Alonso-Zarazaga, R Araujo, M Asche, U Aspock, P Audisio and others. 2007. 'The European union’s 2010 target: putting rare species in focus', Biological Conservation, Vol. 139, No. 1-2, pp. 167–185.
- Fischlin, A., G.F. Midgley, J.T. Price, R. Leemans, B. Gopal, C. Turley, M.D.A. Rounsevell, O.P. Dube, J. Tarazona, A.A. Velichko. 2007. Ecosystems, their properties, goods, and services in M.L. Parry, O.F. Canziani, J.P. Palutikof, P.J. van der Linden and C.E. Hanson (Eds.), Climate Change 2007: Impacts, Adaptation and Vulnerability. Contribution of Working Group II to the Fourth Assessment Report of the Intergovernmental Panel on Climate Change, Cambridge University Press, Cambridge.
- Gera, Mohit., Akhilesh Yadav, N. S. Bisht and Giresh Mohan. 2008. 'Valuation of recreational benefits from the Valley of flowers National Park', The Indian forester, Vol: 134, No. 1, pp. 26-35.
- Gonzalez, Patrick., R Hassan, P Lakyda, I McCallum, S Nilsson, J Pulhin, B Rosenburg and B Scholes. 2005. Forest and Woodland Systems in Hassan, R., R. Scholes and N. Ash, Eds. Ecosystems and Human Wellbeing: Volume 1: Current State and Trends. Island Press, Washington.
- Haripriya, G.S. 2001. 'Integrated Environmental and Economic Accounting: An Application to the Forest Resources in India', Environmental and Resource Economics, Vol. 19, No. 1, pp. 73-95.
- Haripriya, G. S. 2002. ‘Biomass carbon of truncated diameter classes in Indian forests’, Forest Ecology and Management, Vol. 168, No. 1-3, pp. 1-13.
- Harsha, V.H., S.S. Hebbar, G.R. Hegde, V Shripathy. 2002. 'Ethno medical knowledge of plants used by Kunabi tribe of Karnataka in India', Fitoterapia, Vol. 73, No. 4, pp. 281-287.
- Harsha, V.H., S.S. Hebbar, V. Shripathi and G.R. Hegde. 2003. 'Ethnomedicobotany of Uttara Kannada district in Karnataka, India', Journal of Ethnopharmacology, Vol. 84, No. 1, pp. 37-40.
- Harsha, V.H., V. Shripathy and G.R. Hegde. 2005. 'Ethno veterinary practices in Uttara Kannada district of Karnataka', Indian Journal of Traditional Knowledge, Vol. 4, No. 3, pp. 253-258.
- Hassan, R., R. Scholes and N. Ash (Eds.). 2005. Ecosystems and Human Wellbeing: Volume 1: Current State and Trends. Island Press, Washington.
- Hebbar, S.S., G. Hegde and G.R.Hegde. 2010. 'Less known wild edible fruits and seeds of Uttara Kannada district', Indian Forester, Vol. 136, No. 9, pp. 1218-1222.
- Hegde, H.V., G.R. Hegde and S.D. Kholkute. 2007. 'Herbal care for reproductive health: Ethnomedicobotany from Uttara Kannada', Complementary Therapies in Clinical Practice, Vol. 13, No. 1, pp. 38-45.
- ICAR. 1980. Handbook of Agriculture, Indian Council of Agricultural Research, New Delhi.
- International Energy Agency (IEA). 1998. Energy statistics and balances of non-OECD Countries 1995-1996. IEA, Paris.
- Inamati, S. S., K. V. Devar, A. Krishna. 2005. 'Regeneration frequency and stand composition of tree species in Devimane Ghat of Uttara Kannada', Karnataka Journal of Agricultural Sciences,Vol. 18, No. 4, pp, 1155-1159.
- Jana, Bipal Kr., Soumyajit Biswas, Mrinmoy Majumder, Pankaj Kr Roy and Asis Mazumdar. 2009. 'Carbon sequestration rate and above ground biomass carbon potential of four young species', Ecological Economics, Vol. 1, No. 22, pp. 112-118.
- Kamath, S. U. (edt.). 1985. Uttara Kannada District. Karnataka State Gazetteer. Government of Karnataka, Bangalore.
- Kant,S., J Nautiyal, and R.Berry. 1996. 'Forests and economic welfare', Journal of Economic Studies, Vol. 23, No. 2, pp. 31-43.
- Kishore, V.V.N., Preety M. Bhandari and Pratul Gupta. 2004.'Biomass energy technologies for rural infrastructure and village power—opportunities and challenges in the context of global climate change concerns', Energy Policy, Vol. 32, No. 6, pp. 801-810.
- Kramer, R., Munasinghe, M., Sharma, N., Mercer, E. and Shyamsundar, P. (1992), 'Valuing a Protected Tropical Forest: A Case Study in Madagascar', paper presented at the IVth World Congress on National Parks and Protected Areas, 10-21 February, Caracas, Venezuela.
- Kramer, R., Sharma, N. and Munasinghe, M. (eds.) (1995), “Valuing Tropical Forests: Methodology and Case Study of Madagascar,” Environment Paper No. 13. World Bank, Washington D.C.
- Kruijssen F and Mysore S. 2010. Integrating biodiversity conservation and livelihood improvement: The role of markets for mango varieties and Garcinia species in India. Biodiversity International, India.Kumar, Bharath L.B. 2010. Impact of non-timber forest products on tribal economy: An econometric analysis in western-ghats of Karnataka, M.Sc. Thesis submitted to University of Agricultural Sciences, Dharwad.
- Kumar, Bharath L. B., B. L. Patil, H. Basavaraja, S. M. Mundinamani, S. B. Mahajanashetty and S. N. Megeri. 2011. 'Participation behaviour of indigenous people in non-timber forest products extraction in western ghats forests', Karnataka Journal of Agricultural Sciences, Vol. 24, No. 2, pp. 170-172.
- Kumar, P. 2004. 'Valuation of medicinal plants for pharmaceutical uses', Current Science, Vol. 86, No. 7, pp. 930-937.
- Kumar, Pushpam., Madhu Verma, M D Wood and D Negandhi. 2010. Guidance Manual for the Valuation of Regulating Services. UNEP, Nairobi.
- Kumar, Manasi. and Pushpam Kumar. 2008. ‘Valuation of the ecosystem services: A psycho-cultural perspective’, Ecological Economics, Vol. 64, No. 4, pp. 808-819.
- Lakshamana, A. C. 2007. Challenges of Rattan Conservation and Development: Guidelines and Policies,
- Lal, J. B. 1992. Economic value of India’s forest stock in Anil Agarwal (edt.), The Price of Forests by CSE, New Delhi.
- Lal, M. and Roma Singh. 2000. 'Carbon sequestration potential of Indian forests', Environmental Monitoring and Assessment, Vol. 60, No. 3, pp. 315-327.
- Lele, S. M. 1993. Degradation, Sustainability or transformation? A case study of villager’s use of Forest lands in Malnad Region of Uttara Kannada district, India, CES Technical Report No.27, CES, IISc, Bangalore
- Lokras, S.S. 2012. 'Development and Dissemination of Fuel-Effcient Biomass Burning Devices', Journal of Indian Institute of Science, Vol. 92, No. 1, pp. 99-110.
- Mace, G.M., 2005. 'Biodiversity: An index of intactness', Nature, Vol. 434, No. 7029, pp. 32–33.
- Mahapatra, A. K. and D. D. Tewari. 2005. 'Importance of non-timber forest products in the economic valuation of dry deciduous forest of India', Forest policy and Economics, Vol. 7, No. 3, pp. 455-467.
- Manjunatha, G. O., V. M. Dabgar, V. M. Dasar and S. K. Patil. 2009. 'Conservation of NWFP species through sustainable harvesting and cultivation in farm and betta lands in Uttara Kannada district', My Forest, Vol.45, No. 4, pp. 437-444.
- Manjunatha, G. O., V. Suryanarayana, G. V. Dasar, S. K. Patil and Nagaraja Hegde. 2009. 'Important indigenous tree species of medicinal importance and their utilization in Uttara Kannada district', My Forest, Vol. 45, No. 4, pp. 475-484.
- Manoharan, T.R. 1996. 'Economics of Protected Areas: A case Study of Periyar Tiger Reserve', Ph. D. Thesis. Forest Research Institute, Dehra Dun.
- Marigoudra, R., Sanjeev Kyatappanavar, R Rathod and A Krishna. 2004. 'Vegetation studies in Bairumbe in Uttara Kannada', Karnataka Journal of Agricultural Sciences, Vol. 17, No. 4, pp. 878-880.
- Mas, Margarita Triguero., Marc Olomi Sola and V.R. Garcia. 2007. Local Perception in Dandeli Wildlife Sanctuary, Karnataka, India. Universitat Autònoma de Barcelona.
- Mas, Margarita Triguero., Marc Olomi Sola, Naveen Jha, Francisco Zorondo Rodriguez And V Ictoria Reyes Garcia. 2009. 'Urban and rural perceptions of protected areas: A case study in Dandeli Wildlife Sanctuary, India', Environmental conservation, Vol. 36, No. 3 pp. 208-217.
- Maudgal, S and Meenakshi Kakkar. 1992. Evaluation of forests for impact assessment of development project in Anil Agarwal (edt.), The Price of Forests, CSE, New Delhi.
- MEA (Millennium Ecosystem Assessment). 2003. Ecosystems and Human Well-Being: A Framework for Assessment, Island Press, Washington, DC
- Mohandas, T. V. and O. K. Remadevi. 2011. 'A study on tourist visitations in protected areas of central western ghats in Karnataka', The Indian Forester, Vol. 137, No. 4, pp. 403-410.
- Murali, K.S., D.M. Bhat and N.H. Ravindranath. 2000. 'Biomass estimation equations for tropical deciduous and evergreen forest'. International Journal of Agricultural Resources, Governance and Ecology. Vol. 4, No. 1, pp. 81-90.
- Murthy, I.K., P.R. Bhat, N.H. Ravindranath and R. Sukumar. 2005. 'Financial valuation of non-timber forest product flows in Uttara Kannada district, Western Ghats, Karnataka', Current Science, Vol. 88, No. 10, pp. 1573-1579.
- Myers, N. 1984. The primary source: Tropical forests and our future, W.W.Norton, New York.
- Nadkarni, M. V. and S. A. Pasha. 1992. Contribution of forest to Agriculture: A study of Arecanut gardens in Uttara Kannada in Anil Agarwal (edt.), The Price of Forests,CSE, New Delhi.
- Nasi, R., S Wunder and J. J. Campos. 2002. Forest ecosystem services: Can they pay our way out of deforestation? A discussion paper prepared for the Forestry Roundtable held in conjunction with the UNFF II, Costa Rica on March 11, 2002.
- Newcome, Jodi., Allan Provins, Helen Johns, Ece Ozdemiroglu, Jaboury Ghazoul, Diane Burgess and Kerry Turner. 2005. The Economic, Social and Ecological Value of Ecosystem Services: A Literature Review, Economics for the Environment Consultancy, London.
- Prasad, S. N., M. S. Hedge, Madhav Gadgil and K. M. Hegde. An Experiment in Ecodevelopment in Uttara Kannada district of Karnataka, CES Technical Report No. 2, CES, IISC, Bangalore.
- Prasad, S. N., M Hedge and M.S. Hedge. 1987. Fuel consumption and Conservation method in urban centres of Uttara Kannada, CES Technical Report 25. CES, IISc, Bangalore.
- Nayak, R.B. 2008. Characterization of soils, cultivation practices and productivity of rice (Oryza sativa) in Upghat region of Uttara Kannada district. M.Sc. Thesis submitted to University of Agricultural Sciences, Dharwad.
- Panchamukhi, P, R., P Trivedi, S Debi, A.K. Kulkarni, and P Sharma. 2008. Natural resource accounting in Karnataka: A study on land and forestry sector (Excluding mining), Centre for Multi-Disciplinary Development Research, Dharwad.
- Pascal, J.P. 1984. Explanatory Booklet on the Forest Map of South India: Belgaum-Dharwar-Panaji, Shimoga, Mercara-Mysore. Karnataka Forest Department and the French Institute, Pondicherry.
- Pearce, D.W., D Moran and Dan Biller. 2002. Handbook of biodiversity valuation: A guide for policy makers, OECD, Paris.
- Pearce, David and Dominic Moran. 1994. The Economic Value of Biodiversity. IUCN-The World Conservation Union. Earthscan, London.
- Pearce, D.W. and Pearce, C. (eds.) 2001. Valuing environmental benefits: case studies from the developing world. Edward Elgar, Cheltenham.
- Peters, C.M., A. H. Gentry and R. O. Mendelsohn. 1989. ‘Valuation of an Amazonian rainforest’, Nature, Vol. 339, No.6227, pp. 655-656.
- Pittini, Michele. 2011. Monetary Valuation for Ecosystem Accounting. Issue paper prepared for the UN/World Bank/EEA Expert Meeting on Ecosystem Accounts, London, December 2011.
- Pomeroy, M., R Primack, and S.N. Rai. 2003. 'Changes in four rainforest plots of the Western Ghats, India, 1939-1993', Conservation and Society, Vol. 1, No. 1, pp. 113-135.
- Prasad, N. S., H.G. Hegde, D.M. Bhat, and M Hegde. 1987. Estimates of standing biomass and productivity of tropical moist forest of Uttara Kannada district, Karnataka, India, CES Technical Report No. 19, CES, IISc, Bangalore.
- Raghunath, H.M. 1985. Hydrology, Wiley Eastern Limited, New Delhi.
- Raghu, C. 2006. Economics of production and marketing of Patchouli in North Karnataka. M.Sc. Thesis submitted to University of Agricultural Sciences, Dharwad.
- Rai, N.D. and C.F. Uhl. 2004. Forest product use, conservation and livelihood: The case of uppage fruit harvest in the Western Ghats, India, Conservation and society, Vol. 2, No. 2, pp. 289-313.
- Rajesh, D, B. 2006. Economic evaluation of vanilla cultivation in Uttara Kannada district of Karnataka. M.Sc. Thesis submitted to University of Agricultural Sciences, Dharwad.
- Ramachandra T.V. 2007. Vegetation Status in Uttara Kannada District, Mapana Journal of Sciences, Vol. 6, No. 1, pp. 1-26.
- Ramachandra, T.V. 1998. 'Energy utilisation in rural industries in Karnataka', International Journal of Ambient Energy, Vol. 19, No. 2, pp.75-92.
- Ramachandra, T. V. and Savitha Ganapathy. 2007. Vegetation analysis in Uttara Kannada district using GIS and remote sensing techniques, ENVIS Technical Report No. 24, Environmental Information System, CES, IISc, Bangalore.
- Ramachandra, T.V. and A.V. Nagarathna. 2001. 'Energetics in paddy cultivation in Uttara Kannada District', Energy Conversion and Management, Vol. 42, No. 2, pp. 132-155.
- Ramachandra, T.V., D.K. Subramanian, N.V. Joshi, S.V. Gunaga and R.B. Harikanta. 2000. 'Domestic energy consumption patterns in Uttara Kannada district, Karnataka state, India', Energy Conservation and Management, Vol. 41, No. 8, pp. 775-831.
- Ramachandra, T.V., N.V. Joshi, D.K. Subramanian. 2000a. 'Present and prospective role of bioenergy in regional energy system', Renewable and Sustainable Energy Reviews, Vol. 4, No. 4, pp. 375-430.
- Ramachandra, T.V., G. Kamakshi and B.V. Shruthi. (2004). 'Bioresource status in Karnataka', Renewable and Sustainable Energy Reviews, Vol. 8, No. 1, pp. 1-47.
- Ramachandra, T, V., R. Rajinikanth and V. G. Ranjini. 2005. 'Economic Valuation of Wetlands', Journal of Environmental Biology, Vol. 26, No. 2, pp. 439-447.
- Ramachandra T.V., M. D. Subash Chandran, K V Gururaja and Sreekantha. 2007. Cumulative Environmental Impact Assessment, Nova Science Publishers, New York.
- Ramachandra, T, V., B. Alakananda, Ali Rani, M. A. Khan. 2011. 'Ecological and Socio-Economic Assessment of Varthur Wetland, Bengaluru , India', Journal of Environmental Science and Engineering,Vol. 53, No. 1, pp. 101-108.
- Ramachandra, T. V., M.D. Subhash Chandran, N.V. Joshi and Balachandran. C. 2012. Beekeeping: Sustainable Livelihood Option in Uttara Kannada, Central Western Ghats. ENVIS Technical Report No. 19, Environmental Information System, CES, IISc, Bangalore.
- Ramana, P. and S. K. Patil. 2008. 'Marketing of value added products from Artocarpus species in Uttara Kannada district of Karnataka', My Forest, Vol. 44, No.1, pp. 49-53.
- Rao., G.R., Divaker Mesta, M.D.Subhash Chandran and T. V. Ramachandra. 2008. Wetland flora of Uttara Kannada in T. V. Ramachandra (ed.), Environmental Education for Ecosystem Conservation. Capital Publishing Company, New Delhi.
- Rao, D.N. 1990. 'Economics of forest products in India: Issues and Perspectives', in Anil Agarwal (edt.), The Price of Forests,CSE, New Delhi, pp. 75-84.
- Ravindranath, N.H., B.S. Somashekhar and Madhav Gadgil. 1997. 'Carbon flow in Indian forests',Climatic Change, Vol. 35, No. 3, pp. 297-320.
- Ray, Rajasri. and T. V. Ramachandra. 2011. ‘Small sacred goves in local landscape: are they really worth for conservation?’, Current Science, Vol. 98, No. 9, pp. 1178-1180.
- Ray, Rajasri., M.D.Subhash Chandran and T. V. Ramachandra. 2011. Sacred goves in Siddapur Taluk, Uttara Kannada, Karnataka: Threats and Management Aspects, ENVIS Technical Report 38, Environmental Information System, CES, IISc, Bangalore.
- Riera, P. 2001. Assessment of methodologies for valuing biological diversity of forest: Report to work programme on conservation and enhancement of biology and landscape diversity in forest ecosystems, Internal Report No. 2, European Forest Institute, Finland.
- Seema, D. and T.V. Ramachandra. 2010. Carbon sequestration potential of ecosystems in Uttara Kannada district, Western Ghats of Karnataka, India. Conference paper, Lake 2010, Bangalore.
- Shackleton, S., C. Shackleton and B. Cousins. 2000. ‘Revaluing the communal lands of southern Africa: new understandings of rural livelihoods’, ODI Natural Resource Perspectives No. 62. The Overseas Development Institute, London.
- Shastri, C.M., D.M. Bhat, B.C. Nagaraja, Murali, K,S; Ravindranath, N, H. 2002. 'Tree species diversity in a village ecosystem in Uttara Kannada district in Western Ghats, Karnataka', Current Science, Vol. 82, No. 9, pp. 1080-1083.
- Simpson, R.D., Roger A. Sedjo and John W. Reid. 1996. 'Valuing biodiversity for use in Pharmaceutical Research', The Journal of Political Economy, Vol. 104, No. 1, pp. 163-185.
- Swamy, S. L., C.B.S. Dutt, M.S.R. Murthy, A. Mishra, S.S. Bargali. 2010. 'Floristic and dry matter dynamics of tropical wet evergreen forest of Western Ghats, India', Current Science, Vol. 99, No. 3, pp. 353-354.
- TEEB. 2010. The Economics of Ecosystems and Biodiversity: Ecological and Economic Foundations, London and Washington: Earthscan.
- Tewari, D.O. and J.Y Campbell. 1996. 'Increased development of non-timber forest products in India: Some issues and concern', Unasylva, Vol. 47, No. 187, pp. 26-31. Source:http://www.fao.org/docrep/w2149e/w2149e06.htm#increased development of non timber forest products in india: some issues and co accessed on 17.11.2012
- UNDP (United Nations Development Programme). 2000. World energy assessment: energy and the challenge of sustainability, UNDP, Department of Economic and Social and Affairs and World Energy Council, New York.
- UNEP. 2008. IEA Training Manual: A training manual on integrated environmental assessment and reporting, UNEP-IISD.
- USFWS. 1995. A manual for conducting Natural Resource Damage Assessment: The role of Economics. Fish and Wildlife Service, US Department of Interior.
- Varadaranganatha, G.H. and S.L. Madiwalar. 2010. 'Studies on species richness, density and density of tree/ shrub species in agro forestry systems'. Karnataka Journal of Agricultural Sciences, Vol. 23, No. 3, pp. 452-456.
- Ved, D.K., A. Mudappa and A. Singh. 2002. Trade status of commercially important medicinal plant species of the project area of Andhra Pradesh community forest management project, FRLHT, Bangalore.
- Verma, Madhu., Shailendra Joshi, Girija Godbole and Aman Singh. 2007. Valuation of Ecosystem Services and Forest Governance: A scoping study from Uttarakhand, LEAD India, 2007.
- WEHAB. 2002. 'A Framework for Action on Biodiversity and Ecosystem Management', Water, Energy, Health, Agriculture and Biodiversity Working Group Report, contribution to the World Summit on Sustainable Development, Johannesburg, South Africa, 26 August – 4 September 2002. United Nations, New York.
Source:https://www1.inbar.int/news/proceedings_guangzhou/3CHALLENGES_OF_RATTAN_CONSERVATION_AND_DEVELOPMENT.ppt, accessed on 02.10.2012