 |
FOREST ECOSYSTEM: GOODS AND SERVICES
|
 |
| T.V. Ramachandra Subash Chandran M.D. Bharath Setturu Vinay S Bharath H. Aithal G. R. Rao |
| Energy & Wetlands Research Group, Centre for Ecological Sciences,
Indian Institute of Science, Bangalore, Karnataka, 560 012, India. E Mail: tvr@iisc.ac.in; Tel: 91-080-22933099, 2293 3503 extn 101, 107, 113 |
|
Ecosystem, LULC Analyses, Ecological Sampling
|
Reference:
-
Ramachandra T.V., Subash Chandran M D., Gururaja K V and Sreekantha, 2007. Cumulative Environmental Impact Assessment, Nova Science Publishers, New York.
-
Ali, Sameer, G. R. Rao, Divakar K. Mesta, Sreekantha, Mukri Vishnu, M. D. Subash Chandran, K. V. Gururaja, N. V. Joshi, and T. V. Ramachandra. Ecological Status of Sharavathi Valley Wildlife Sanctuary. Prism Books Pvt Ltd., Bangalore, 2007
Ecosystems have several fundamental characteristics. First, an ecosystem has structure - non-living (abiotic) and living parts (biotic). Non-living parts include rock, water and air. The living part is the community, which is a set of interacting species. Second, an ecosystem has processes, -energy flows and material recycling. Third, an ecosystem changes over time and can undergo development through a process called succession. Ecosystems have natural boundaries such as forests, rivers, or mountains; however, man-made constructions such as highways, buildings, or sidewalks can also be considered boundaries to smaller ecosystems.
STRUCTURE OF THE ECOSYSTEM: From the structural point of view, all ecosystems consist of the following basic components:
-
Abiotic component: Abiotic components of the ecosystem, include basic inorganic molecules elements and compounds such as soil, water, oxygen, calcium, carbonates, phosphates and a variety of organic compounds. The physical factors like light, temperature, water, atmospheric gases, etc. are also included in them.
-
Biotic component: The biotic component includes all living organisms in the environmental system. An ecosystem consists basically of the following.
-
Producers: Producers are organisms, which are able to manufacture organic compounds from inorganic substances from their environment. Green plants are able to do this by the means of photosynthesis, where the sun provides the necessary energy. Therefore, these green plants are the autotrophic organisms or primary producers in most ecosystems.
-
Consumers: These are organisms, which cannot make organic compounds from inorganic substances. They are dependant upon autotrophic organisms and are the consumers or heterotrophic organisms in an ecosystem. The consumers are further subdivided according to their diet, into:
-
Herbivores or plant eaters which are the primary consumers, e.g. cows, giraffes, elephants, etc;
-
Carnivores or meat eaters which are the secondary consumers; some carnivores are called predators (eg. lions, leopard, fish eagle, etc) which catch their prey, kill it and then eat it; others are called scavengers ( eg. vultures) which usually eat what is left by the predators;
-
Omnivores eat plant and animal material and can be primary, secondary and tertiary consumers simultaneously; a human being is a good example of an omnivore.
-
Decomposers: They are the living components of the ecosystem such as bacteria and fungi and obtain their energy by decomposing the corpses and other dead parts of organisms. The simple organic compounds are further broken down by bacteria and converted into inorganic forms, which are taken up by green plants.
Terrestrial Ecosystem: Biodiversity
Vegetation Studies: The landscape is a mosaic of a variety of elements, which are caused by human impacts through historical times to current period. Land cover of the landscape play a decisive role in the functioning of an ecosystem evident from the following:
The evergreens to semi-evergreen forests are the major sources of perennial water sources throughout the catchment in Western Ghats. On the other hand in the deciduous forest tract, the streams mostly dry up in the summer months. Therefore conservation of evergreen forests and restoration of such forests in all the potential areas, based mainly on rainfall criteria of the catchment are of paramount importance. Bulk of the water into the reservoirs comes from natural forests.
The numerous streams and the banks of the river and its tributaries in the evergreen to semi-evergreen forest belt are lined with characteristic riparian vegetation. The riparian vegetation plays a crucial role in protecting the water bodies from siltation, creating shade conditions to maintain appropriate temperature regime for sustaining populations of endemic fishes, amphibians, phytoplankton, zooplankton and aquatic insects. The natural vegetation ranges from the climax tropical evergreen to semi-evergreen forests along the high rainfall areas of the main hill ranges of the Western Ghats to the moist deciduous forests in the undulating plains and low hills along the eastern drier tracts of the river basin.
Land use and land cover (LULC) changes:
LULC changes in a district can be analysed using temporal remote sensing data with ancillary data and field data. The method followed for LULC analysis is represented in Figure 1.
Figure 1: Method for LULC analyses
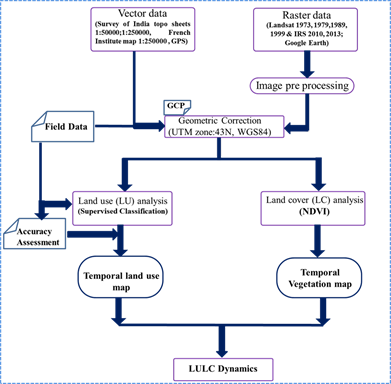
Remote sensing data: Temporal remote sensing data of Landsat satellite are available at public domains at Global Land Cover Facility (GLCF) (http://www.glcf.umd.edu/index.shtml) and United States Geological Survey (USGS) Earth Explorer (http://edcsns17.cr.usgs.gov/NewEarthExplorer/). Base layers such as district, taluk boundary, stream network, etc. are to be digitised from The Survey of India (SOI) topographic maps of 1:50000 and 1:250000 scales (http://surveyofindia.gov.in). Ground control points to register and geo-correct remote sensing data are to be collected using hand held pre-calibrated GPS (Global Positioning System), Survey of India topographic maps and Google earth (http://earth.google.com, http://bhuvan.nrsc.gov.in).
Ancillary data: Ancillary data include cadastral revenue maps (1:6000), the Survey of India (SOI) topographic maps (1:50000 and 1:250000 scales), vegetation map of South India developed by French Institute (1986) of scale 1:250000. Topographic maps provides ground control points (GCP’s) to rectify remote sensing data and scanned paper maps. Vegetation map of South India (1986) of scale 1:250000 (Pascal, 1986) is useful to identify various forest cover types and classify RS data of 1980’s. Other ancillary data includes land cover maps, administration boundary data, transportation data (road network), etc. Pre-calibrated GPS (Global Positioning System - Garmin GPS units) are useful in field data collection, required for RS data classification as well as for validation.
Land use analysis: Land use analysis involves (i) generation of False Color Composite (FCC) of remote sensing data (bands–green, red and NIR). This composite image helps in locating heterogeneous patches in the landscape, (ii) selection of training polygons by covering 15% of the study area (polygons are uniformly distributed over the entire study area) (iii) loading these training polygons co-ordinates into pre-calibrated GPS, (vi) collection of the corresponding attribute data (land use types) for these polygons from the field. GPS helped in locating respective training polygons in the field, (iv) supplementing this information with Google Earth and (v) 60% of the training data has been used for classification, while the balance is used for validation or accuracy assessment. The land use analysis was done using supervised classification technique based on Gaussian maximum likelihood algorithm with training data (collected from field using GPS).
Computation of Area under intact forests/Interrior forests: Fragmentation of forests at the pixel level are estimated through the computation of Pf (the ratio of the number of pixels that are forested to the total number of non-water pixels in the window) as given in equations 1. If Pf = 1, then that pixel belongs to intact forests
Pf = Proportion of number of forest pixels / Total number of non ‒ Water pixels in window
(1)
Pf are computed through a moving window of 5 x 5 pixels, given that the results of the model are scale-dependent and threshold dependent.
Vegetation Sampling Methods:
The study area (district) be divided into 5’ × 5’ equal area grids covering approximately 9 × 9 km2 (Fig 2). Representative grids (based on LULC and agro-climatic zones) are to be chosen for detailed sampling of biodiversity (flora and fauna) and hydrology.

Figure 2: The district with Grids. Chosen grids for field sampling are shaded (for field data collection of vegetation and fauna through transect cum quadrats
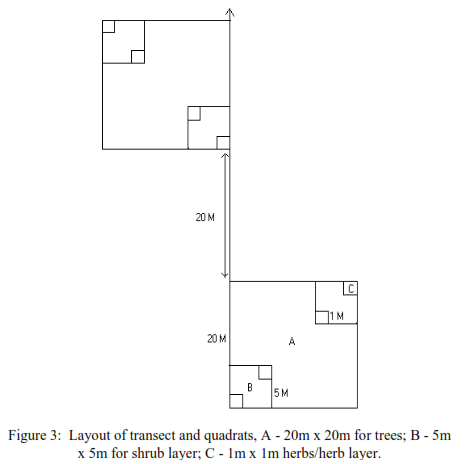
A transect based quadrat method was used for vegetation sampling. The transect length ranged between 120 to 280 m. Quadrats of 20m X 20m area were laid along the transect, on either side of the transect as shown in Figure 3. The inter-quadrat distance was 20 m.
Sampling of Trees: In each quadrat all the trees having girth ≥ 30cm at 1.30 m above the ground are to be enumerated. The girth at breast height (GBH) is to be measured for each tree (cm) and approximate height to be noted (m). The climbers and epiphytes associated with trees are to be noted
Ground Vegetation sampling - Shrub layer: The ground layer of plants (+1m height and higher but GBH < 30cm) are to be sampled using two sub-quadrats of 5 X 5 m each, located within the tree quadrat, as shown in Figure 3. Tree saplings and shrubs as well as tall herbs are to be enumerated in these 25m2 sub-samples.
Sampling of herbs / herb layer: Within the 5 X 5 m sub-quadrats, two quadrats of one square meter each were placed as shown in Figure 1 for sampling the diversity of herb layer (plants less than 1 m). The herb layer included lower plants like the pteridophytes as well as tree seedlings.
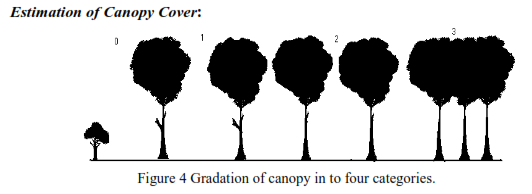
Multi-layered canopy structure as in the tropical rain forests is greatly significant in stopping the force of the torrential seasonal rains, in preventing soil erosion as well as in inducing greater percolation of water into the soil. Within each tree quadrat of 20m x 20m, the nature of canopy cover was observed at 5 points and ranked as 0, 1, 2 and 3 as shown in Figure 4. Mean value of the 5 points is to be taken as the canopy for respective quadrat.
Estimation of Litter Cover on the Ground: The litter cover on the ground is very important in nutrient cycling as well as in percolation of water into the soil. Within each tree quadrat, approximately at the central region, litter is to be collected in an area of 1m x 1m and the weight of ground litter is to be taken. The value obtained was extrapolated for one hectare of sampled forest.
Description of the Study Localities: The following general details were recorded from each sampled locality.
-
Location: Local name of the locality surveyed, hamlet, village, taluk, forest beat and forest range.
-
Patch type: Evergreen, semi-evergreen, moist-deciduous, scrub etc.
-
Legal status
-
Transect Number, Transect length.
-
Nature of the terrain: Steep slope/Moderate/Low to flat/Undulating.
-
The occurrence of a stream associated with the site.
-
Rock outcrops, or rockiness: High/Moderate/Poor to nil.
-
Nature of rocks: Lateritic/non-lateritic.
-
Soil erosion on the site: High/Moderate/Least.
-
Nearest human habitation (distance)
-
Notes on human interference viz., lopping, tree cutting, burning, fuel extraction, litter collection, cattle grazing and any other activities.
-
Sacred value.
-
Non-Timber Forest Produce (NTFP) collection.
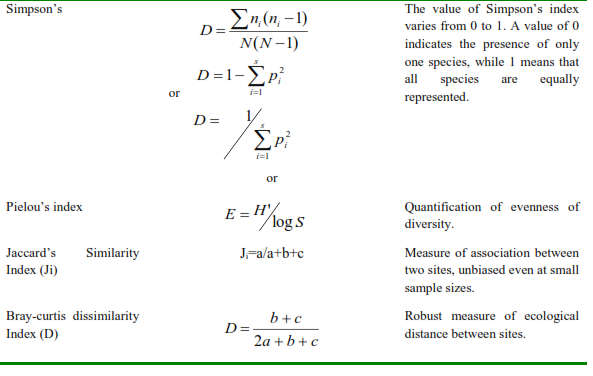
Species Diversity: Diversity is an indicator of status of an ecosystem. It consists of two components, the variety and the relative abundance of species. The higher value indicates higher diversity. Diversity was estimated using the Shannon Wiener’s and Simpson’s methods. A preliminary examination or “reconnaissance” of the study area is to be made to get a general picture of the landscape and its vegetation. Regional and topographic maps, survey maps, online virtual data (Google) would assist in determining access routes, topographic obstacles, study of onsite features, and Geographic Information System (GIS) analysis. This would provide:
-
Major vegetation patterns and plant communities, including their growth forms and dominant species.
-
Correlation between plant communities and features such as topography, geology, soil and water.
-
Past and present human influence on the vegetation.
Identification of unknown plants is to be made either in the field or the plant materials to be collected for later determination. Preserving these specimen in Herbarium would help in further study and analysis.
Ecological Measurements
A number of basic measurements help in describing population and communities. Among these are density, frequency, coverage and biomass. Other important ecological measurements such as population distribution, species diversity and productivity are made from these.
Density: In ecological population studies, numbers of individuals provide basic information. Abundance (N) is the number of individuals in a given area and density (D) is the number expressed per unit area or unit volume. For example, a species may have an abundance of 100 individuals in a particular area. If the total area were 2.5 hectares, then the density of this species would be 40 per hectare (40/ha).
Density is the number of organisms per unit area or unit volume. Much of the area may be habitat unsuitable for that species. Therefore it may be more meaningful to speak of the number per unit habitable area. Thus, in the above example of 100 individuals in 2.5 hectares, if only half the area provides suitable habitat for the species in question, then the species would have an ecological density of 80 per hectare (80/ha).
A problem sometimes encountered in plant sampling is the determination of individuals. When plants are growing in clumps or are producing vegetatively from underground rhizomes the common concept of the individual falters. Then, the individual shoots or stems must be counted; or, if the plants are growing in distinct clumps, whole clump is treated as an individual.
In many kinds of faunal sampling, accurate and absolute density determinations often are difficult or impossible to obtain. However, if a standardised sampling procedure is used, then at least an index of density (ID) may be calculated and used for comparative purposes. Such an index might be the number of individuals per unit of habitat or the number per unit area. Sometimes this is called population density. For example, the number per unit of habitat might be the number of beetles per leaf or the number of parasites per host organism. Density expressed per unit of sampling effort might be the number of grasshoppers per sweep of a net, the number of fish caught per hour, the number of birds seen per kilometre of walking, or the number of mice caught per trap per night.
In comparative studies, one wants to know the number of individuals relative to other populations or relative to the same population at other times. Relative species density (RD) is important in community studies. Relative species density is the total number of individuals of all species. Example, if there are 50 trees in a given area, and 30 of them are Lophopetalum, then the relative species density of Lophopetalum is 30/50 or 60%.
Relative population density is the number of individuals of a given species from one location or time expressed as a proportion of the total number of individuals of that species for all locations or times sampled. If one caught 10 locusts with 100 sweeps of a collecting net in July of one year and 70 locusts in the same location with identical sweeping effort in September, the relative density for July would be 10/80 or 0.125 and September 70/80 or 0.875
Frequency: Frequency (f) is the number of times a given event occurs. In many studies, the term frequency indicates the number of samples in which a species occurs. This is expressed as the proportion of the total number of samples taken that contains the species in question. Thus, if a species were found in 7 out of 10 samples taken, it would have a frequency of 7/10 or 0.7. This is same as saying the probability of finding that species in a sample is 0.7. Since frequency is sensitive to distribution patterns of individuals, it is also useful in describing and testing such patterns. The relative frequency (RF) is the ratio of the number of individuals of a particular species divided by the sum of the frequencies of the species in the community.
Basal Area: The basal area for a tree has been calculated for each transect based on the girth measured using the formula (GBH)²/4π, which is summed for a quadrat and transect. The value arrived has been extrapolated to a hectare so as to make standard comparisons with other tropical forests. For sub-basins the basal area of respective sampled localities were pooled based on different vegetation types and then the value was extrapolated for a hectare of sampled forest.
Importance Value Index: The Importance Value Index gives an overall picture of the importance of the species in the community. It considers the relative values of density, frequency and basal area in a given sample.
Forest Classification: The forest has been classified as Evergreen, Semi-evergreen and Moist deciduous based on the percentage of evergreens present in the sampled localities (Table 1).
Table 1Classification of vegetation.
| Vegetation type | Evergreen trees (%) |
Evergreen |
90 to 100 |
Semi-evergreen |
50 to 90 |
Moist deciduous |
Less than 50 |
Endemic Species: Endemic species are species with restricted range of distribution. A taxon is considered as endemic if confined to a particular area through historical, ecological or physiological reasons. At the global level endemic areas are of high conservation priority because these species can never be replaced if they are lost. The Western Ghats endemism is of high conservation value. During field observations, it was noticed that the endemic vegetation patches were more associated with perennial streams and other damp soils.
The geographical distributions of all plant species identified were listed with the help of the flora (district flora publications such as flora of Shimoga, flora of Karnataka, flora of Hassan, etc.). Similarly the percentages of the Western Ghats endemics were estimated for each transect, and the same have been calculated for the sub-basins also.
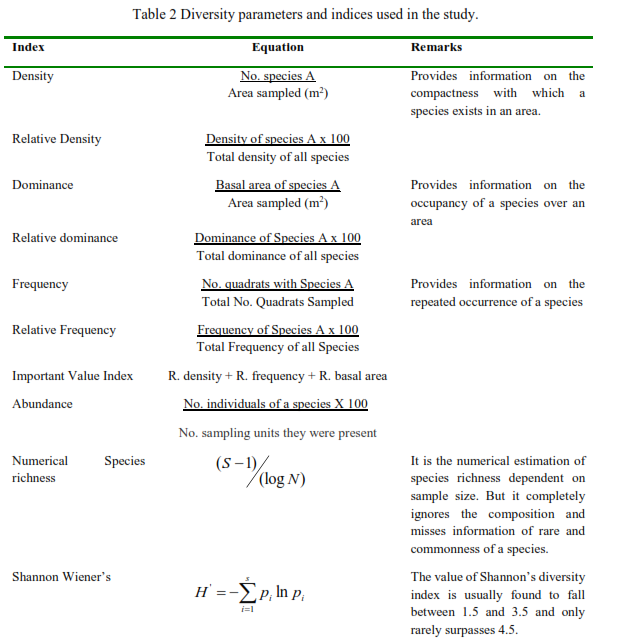
Regeneration status: The regeneration status of various tree species was calculated in the sampled localities based on the representation of trees in different girth classes. The tree species distributed in all girth classes are considered as having good regeneration. The trees with representation in the higher girth classes only might indicate ecological conditions prevalent in the past, when these trees appeared at the site. Various indices that were used in the biodiversity studies, which include both flora and fauna have been listed in Table 2.
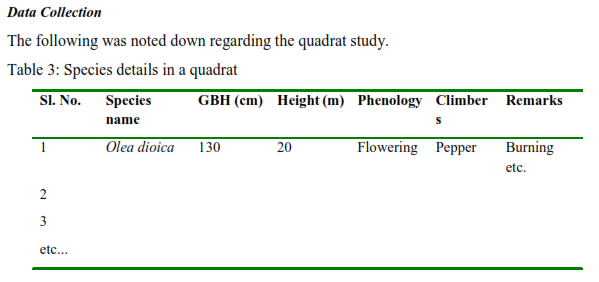
Using GPS the latitude and longitude values of the quadrat positions were noted down. Any special observations like sighting epiphytes, parasites, unequal branching, etc. are also to be mentioned in the remark column.