 |
FOREST ECOSYSTEM: GOODS AND SERVICES
|
 |
| T.V. Ramachandra Subash Chandran M.D. Bharath Setturu Vinay S Bharath H. Aithal G. R. Rao |
| Energy & Wetlands Research Group, Centre for Ecological Sciences,
Indian Institute of Science, Bangalore, Karnataka, 560 012, India. E Mail: tvr@iisc.ac.in; Tel: 91-080-22933099, 2293 3503 extn 101, 107, 113 |
Estimation of carbon sequestration by the terrestrial ecosystems |
Forest ecosystems sequester atmospheric carbon and play a vital role in mitigating climate change. Atmospheric carbon gets stored in the above and below ground biomass, dead organic matter and soil organic matter. Mismanagement of forests leading to deforestation and enhanced emissions during post industrial revolution has increased carbon dioxide concentration in the atmosphere to 400 ppm from 270 ppm during the pre-industrial era. The recent estimates of emissions in 30 developing countries (including Brazil, Bolivia, Indonesia, Myanmar and Zambia) highlight that deforestation and forest degradation are the prime source of CO2 imperilling productive ecosystems.
Figure 5 outlines the approach adopted for budgeting carbon in a district. The forest cover types were identified using vegetation maps. Based on this, forest vegetation is sampled using transect-based quadrats, which is validated and found appropriate especially in surveying undulating forested landscapes of central Western Ghats. Topographic maps of 1:50000 scales were used to do ground surveys and selection of sample plots. The analysis was carried out in two major folds i.e., spatial mapping of carbon sinks, estimating carbon emissions.
Spatial mapping of carbon sinks
Field investigation: The study area is divided into 5’×5’ equal area grids covering approximately 81 km2 (9×9 km) and representative grids in each agro-climatic zone were chosen for further investigations (Fig. 2). Field investigations are to be carried out in chosen grids through quadrat based transects and compile data pertaining to the basal area, height, species, etc. Along a transect of 180 m, 5 quadrats each of 20 m × 20 m are to be laid alternatively on the right and left, for tree study (minimum girth of 30 cm at DBH (Diameter at Breast Height) or 130 cm height from the ground), keeping intervals of 20 m length between successive quadrats. Within each tree quadrat, at two diagonal corners, two sub-quadrats of 5 m × 5 m were laid for shrubs and tree saplings (<30 cm girth). Within each of these 2 herb layer quadrats, 1 sq.m area each, were also laid down for herbs and tree seedlings. Biomass is estimated from forests and also plantations, to evaluate carbon sequestration potential of the respective ecosystem. Land use analysis is performed to account grid wise forest cover, which helped further to estimate biomass at the district level.
Quantification of biomass (Forests): The above ground standing biomass (AGB) of trees refers to the cumulative weight of the tree biomass above ground, in a given area. The change in standing biomass over a period of time is called productivity. Carbon storage in forests is estimated by taking 50% of the biomass as carbon. AGB is a valuable measure for assessing changes in forest structure and an essential aspect of studies of carbon cycle. AGB data at a landscape scale can be used to understand changes in forest structure resulting from succession or to differentiate between forest types. The AGB is calculated using the basal area (equation 1) and below ground biomass calculated from indirect estimation. The carbon storage is computed by considering 50% of total biomass. The region specific allometric equations (Table 4) can be used to compute biomass. Probable relationship between basal area (BA), and forest cover and extent of interior forest (equation 1) based on the field data coupled with land use data. The multiple regression analysis is adopted, for estimating the relationship between a dependent (standing biomass) and independent variables (forest cover, percentage of interior forests-computed from land use analysis). The probable relationship helped in predicting the standing biomass and carbon stock at the district level in all grids.
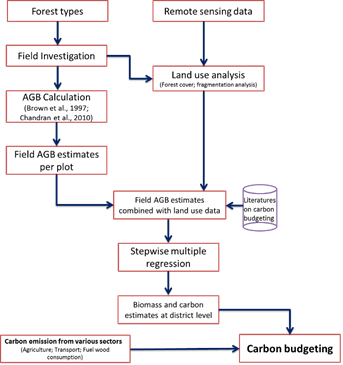
Fig. 5 Method adopted for carbon budgeting
![]() ...1
...1
Statistically, significant equations based on the basal area with land use and interior forest were obtained and given in equations 2, 3, and 4 respectively for coastal, Sahyadri and plains. Validation of basal area based on equation 2-4 was done with the known basal area in the respective grids. Later, basal area (Table 5) for all grids in the respective agro-climatic zones are to be computed considering forest land use and interior forests (in the respective grids) using equations 2, 3 and 4.
For Coastal regions,
![]()
![]() ...2
...2
For Sahyadri Interior region,
![]()
![]() ...3
...3
For plain region,
![]()
![]() . ...4
. ...4
Where n is a number of transects and SE refers to standard error.
Table 4 Biomass computation for different agro zones (Ramachandra et al. 2000a, b)
Index |
Equation |
Significance |
Region applied |
Basal area (BA) (m²) |
|
To estimate basal area from DBH values |
All |
Biomass (T/Ha) |
|
Effective for semi evergreen, moist deciduous forest cover types and having moderate rainfall |
Coastal |
Biomass (T/Ha) |
|
Effective for wet evergreen, semi evergreen forest cover types and having higher rainfall) |
Sahyadri Interior |
Biomass (T/Ha) |
|
Effective for deciduous forest cover types and having lower rainfall |
Plains |
Carbon stored (T/Ha) |
|
Sequestered carbon content in the region by forests |
All |
Annual Increment in Biomass (T/Ha) |
|
Incremental growth in biomass |
Coastal |
|
Sahyadri |
||
|
Plains |
||
Annual increment in Carbon (T/Ha) |
|
Incremental growth in carbon storage |
All |
Net annual Biomass productivity (T/Ha) |
|
Used to compute the annual availability of woody biomass in the region. (Ramachandra et al. 2000) |
Coastal |
|
Sahyadri |
||
|
Plains |
||
Carbon sequestration of forest soil (T/Ha) |
|
Carbon stored in soil |
Coastal |
|
Sahyadri |
||
|
Plains |
||
Annual Increment of soil carbon |
|
Annual increment of carbon stored in soil |
All |
Table 5 Biomass productivities in various types of vegetation
Sno |
Vegetation types |
Biomass (t/ha/year) |
1 |
Dense evergreen and semi evergreen |
13.41 to 27.0 |
2 |
Low evergreen |
3.60 to 6.50 |
3 |
Secondary evergreen |
3.60 to 6.50 |
4 |
Dense deciduous forest |
3.90 to13.50 |
5 |
Savanna woodland |
0.50 to 3.50 |
6 |
Coastal (scrub to moist deciduous) |
|
Forest Soils: Forest soils are major sinks of carbon, approximately 3.1 times larger than the atmospheric pool of 800 GT. The primary way that carbon is stored in the soil is as soil organic matter (SOM) in both organic and inorganic forms. SOM input is determined by the root biomass and litter. SOM is a complex mixture of carbon compounds, consisting of decomposing plant and animal tissue, microbes (protozoa, nematodes, fungi, and bacteria), and associated soil carbon minerals. SOM improves soil structure, enhances permeability while reducing erosion, with bioremediation leads to the improved water quality in groundwater and surface waters. Soil disturbance through deforestation also leads to increased erosion and nutrient leaching from soils, which have led to eutrophication and resultant algal blooms within inland aquatic and coastal ecosystems, ultimately resulting in dead zones in the ocean. Soil carbon is calculated based on the field estimations in top 30 cm soil for different forests (Table 6) and mean soil carbon reported in literature.
Table 6 Soil carbon storage in different forest types
Sno |
Forest Types |
Mean soil carbon in top 30 cm (Mg/ha) |
1 |
Tropical Wet Evergreen Forest |
132.8 |
2 |
Tropical Semi Evergreen Forest |
171.7 |
3 |
Tropical Moist Deciduous Forest |
57.1 |
4 |
Littoral and Swamp Forest |
34.9 |
5 |
Tropical Dry Deciduous Forest |
58 |
6 |
Tropical Thorn Forest |
44 |
7 |
Tropical Dry Evergreen Forest |
33 |