 |
FOREST ECOSYSTEM: GOODS AND SERVICES
|
 |
| T.V. Ramachandra Subash Chandran M.D. Bharath Setturu Vinay S Bharath H. Aithal G. R. Rao |
| Energy & Wetlands Research Group, Centre for Ecological Sciences,
Indian Institute of Science, Bangalore, Karnataka, 560 012, India. E Mail: tvr@iisc.ac.in; Tel: 91-080-22933099, 2293 3503 extn 101, 107, 113 |
|
GIS: Introduction
|
Many of our decisions depend on the details of our immediate surrounding, and require information about specific places on the Earth’s surface. In this regard, recent developments in information technologies have opened a vast potential in communication, analysis of spatial and temporal data. Data representing the real world can be stored and processed so that they can be presented later in a simplified form to suite specific needs. Such information is called geographical because it helps us to distinguish one place from another and to make decisions for one place that are appropriate for that location. Geographical information allows us to apply general principles to the specific conditions of each location, allows us to track what is happening at any place, and helps us to understand how one place differs from another. Spatial information is essential for effective planning and decision-making at regional, national and global levels. The geographical information in the form of maps (based on field surveys), photos taken from aircraft (aerial photography), and images collected from the space borne platforms (satellite) can be represented in digital form, this opens an enormous range of possibilities for communication, analysis, modeling, and accurate decision making, but a degree of approximation.
GIS can be defined as computerized information storage processing and retrieval system that has hardware, software specially designed to cope with geographically referenced spatial data. Collective name for such system is geographical information systems, (GISs). Processing geographical information include:
- Techniques to input geographical information, converting the information to digital form
- Technique for sorting such information in a compact format on computer disks, and other digital storage media
- Methods for automated analysis for geographical data, to search for the patterns, combine different kinds of data, make measurements find optimum sites or routes, and a host of other tasks
- Methods to predict the out come of various scenarios, such as the effects of climate change on vegetation
- Techniques for display of data in the form of maps, images and other kinds of display
- Capabilities for output of results in the form of numbers and tables.
Elements of GIS: Components of geographical data are Spatial and Attribute Database, Cartographic Display System, Map Digitizing System, Database Management System, Geographic Analysis System, Statistical analysis system and Decision support system. The linkages among these components is illustrated in Figure 1.1.
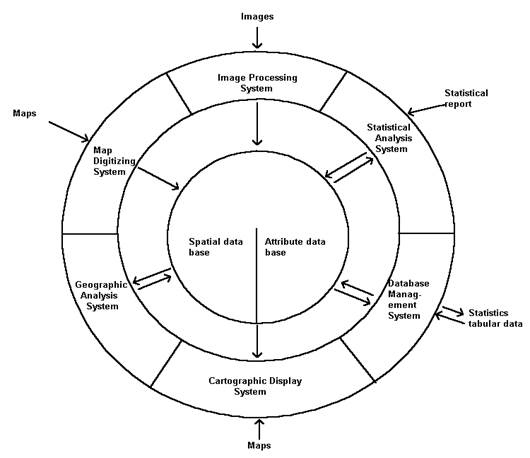 |
Figure 1.1: Components of GIS. |
- Spatial and Attribute Database: Central to the system is the database – a collection of maps and associated information in digital form. Since the database is concerned with earth surface features, it is seen to comprise of two elements – a spatial database describing the geology (shape and position) of the earth surface features, and an attribute database describing the characteristics or quantities of these features. Thus, for example, we might have a property parcel defined in the spatial database and qualities such as its land use, owner, property valuation, etc. in the attribute database.
- Cartographic Display System: Surrounding the central database, we have a series of software components. The most basic of these is the cartographic display system. The cartographic display system allows one to take selected elements of the database and produce map output on the screen or some hardcopy device such as printer or plotter.
- Map Digitizing System: After cartographic display, the next most essential element is a Map Digitization System. With a map digitizing system, one can take existing paper maps and convert them into digital form, thus further developing the database. In the most common method of digitizing, one attaches the paper map to a digitizing tablet or board and then traces the features of interest with a stylus according to the procedures required for digitizing. Many maps digitizing system also allows for some editing of the digitized data. Scanners can also be used to digitize data such as aerial photographs. The results is a graphic image, rather than the outlines of features that are created with a variety of standard graphics file formats for export. These files are then imported into the GIS. Computer assisted design (CAD) and Coordinate Geometry (COGO) are two examples of software systems that provide the ability to add digitized map information to the database, in addition to providing cartographic display capabilities.
- Database Management System: The next logical component in a GIS is Database Management System (DBMS), which is used to input, manage and analyze attribute information along with then spatial data. GIS thus typically incorporates a variety of utilities to manage the spatial and attribute components of the geographic data. DBMS aids to enter attribute data, such as tabular information and statistics, and subsequently extract specialized tabulations and statistical summaries to provide new tabular reports. The DBMS provides the ability to analyze attribute data. Many map analysis have no true spatial component, and for these a DBMS will often function quite well. For example, we might inquire of the system to find all property parcels where the head of the household is single but with one or more child dependents, and to produce a spatial map. Software that provides cartographic display, map digitizing, and database query capabilities are often referred to as Automated Mapping and Facilities Management (AM/FM) system.
- Geographic Analysis System: Up to this point, we have described a very powerful set of capabilities that the GIS offer, the ability to digitize spatial data and attach attribute to the features stored; to analyze these data based on those attribute; and to map to the result. But on inclusion geographic analysis system, we extend the capabilities of the traditional database query to include the ability to analyze data based on their location. Perhaps the simplest example of this is to consider what happens when we are concerned with the joint occurrence of features with different geographies. For example, suppose we want to find all areas of residential land on bedrock types associated with high levels of radon gas. A traditional DBMS cannot solve this problem because bedrock types and landuse divisions simply do not share the same geography. Traditional database query is fine as long as we are taking about attributes belonging to the same features. But when the features are different, it cannot cope. For this we need a GIS. In fact, it is this ability to compare different feature based on their common geographic occurrence that is the hallmark of GIS. This analysis is accomplished by the process of overlay, thus named because it is identical in character to overlaying transparent maps of the two entity groups on top of one another. Like the DBMS, the Geographic Analysis System as highlighted in Figure 1.1 has a two-way interaction with the database; the process is distinctly analytical in character. Thus while it may access data from the database, it may equally contribute the results of that analysis as a new addition to the database. For example we might look for joint occurrence of lands on steep slopes with erodable soil under agriculture and call the results based on existing data and set of specific relations. Thus the analytic capabilities of the Geographic Analysis System and the DBMS play a vital role in extending the database through the addition of knowledge of relationships between features.
- Image Processing System: In addition to these essential GIS elements, remotely sensed image and specialized statistical analysis are also important. This we will discuss in the subsequent sections.
- Statistical analysis system: GIS incorporates a series of specialized routines for analyzing the statistical description of spatial data and for inferences drawn from statistical procedures.
- Decision support system (DSS): Decision support constitutes a vital function of a GIS. It helps in the construction of multi-criteria suitability maps, and address allocation decisions when there is multiple objectives involved while accounting for error in the process. Used in conjunction with the other components of the system, DSS provides a powerful tool in decision-making for resource allocation.
Map Data Representation
A Geographic Information System stores two types of data that are found on a map—the geographic definitions of earth surface features and the attributes or qualities that those features possess. Most systems use nearly one or a combination of both the fundamental map representation techniques: vector and raster.
Vector: This refers to the spatial data represented in the form of point, line or polygon depending on the feature of interest (and scale). With vector representation, the boundaries or the course of the features are defined by a series of points that, when joined with straight lines, form the graphic representation of that feature. The points themselves are encoded with a pair of numbers giving the X and Y coordinates in systems such as latitude/ longitude, etc. The attributes of features are then stored in the database management system (DBMS). For example, a vector map of property parcels might be tied to an attribute database of information containing the address, owner’s name, property valuation and land use. The link between these two data files can be a simple identifier number that is given to each feature in the map (Figure: 1.2).
Raster: In this case, the graphic representation of features and the attributes they possess are merged into unified data files. In fact, we typically do not define features at all. Rather, the study area is subdivided into a fine mesh of grid cells in which we record the condition or attribute of the earth’s surface at that point (Figure 1.2). Each cell has a numeric value (often referred as digital number or spectral signature), representing a feature identifier, a qualitative attribute code or a quantitative attribute value. For example, a cell could have the value “6” to indicate that it belongs to District 6 (a feature identifier), or that it is covered by soil type 6 (a qualitative attribute), or that it is 6 meters above sea level (a quantitative value). Although the data we store in these grid cells do not necessarily refer to phenomena that can be seen in the environment, the data grids themselves can be thought of as images or layers, each depicting one type of information over the mapped region. This information can be made visible through the use of a raster display. In a raster display, such as the screen on your computer, there is also a grid of small cells called pixels (or picture elements). The word pixel is a contraction of the term picture element. Pixels vary in their color, shape or gray tone depending on features in the object. To make an image, the cell values in the data grid are used to regulate directly the graphic appearance of their corresponding pixels. Thus in a raster system, the data directly controls the visible form we see.
Raster versus Vector: Raster systems are typically data intensive since they must record data at every cell location regardless of whether that cell holds information that is of interest or not. However, the advantage is that geographical space is uniformly defined in a simple and predictable fashion. As a result, raster systems have substantially more analytical power than their vector counterparts in the analysis of continuous space and are thus ideally suited to the study of data that are continuously changing over space such as terrain, vegetation biomass, rainfall and the like. The second advantage of raster is that its structure closely matches the architecture of digital computers.
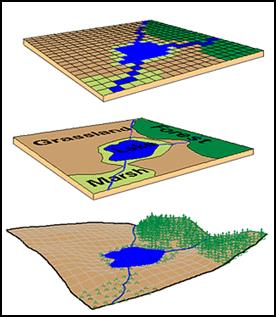 |
Raster |
Vector
|
|
Real World |
As a result, raster systems tend to be very rapid in the evaluation of problems that involve various mathematical combinations of the data in multiple layers. Hence they are excellent for evaluating environmental models such as soil erosion potential and forest management suitability. In addition, since satellite imagery employs a raster structure, most raster systems can easily incorporate these data, and some provide full image processing capabilities.
While raster systems are predominantly analysis oriented, vector systems tend to be more database management oriented. Vector systems are quite efficient in their storage of map data because they only store the boundaries of features and not that which is inside those boundaries. Because the graphic representation of features is directly linked to the attribute database, vector systems usually allow one to roam around the graphic display with a mouse and query the attributes associated with a displayed feature, such as the distance between points or along lines, the areas of regions defined on the screen, and so on. In addition, they can produce simple thematic maps of database queries.
Compared to their raster counterparts, vector systems do not have as extensive a range of capabilities for analyses over continuous space. They do, however, excel at problems concerning movements over a network and can undertake the most fundamental of GIS operations that will be sketched out below. For many, it is simple database management functions and excellent mapping capabilities that make vector systems attractive. Because of the close affinity between the logic of vector representation and traditional map production, a pen plotter can be driven to produce a map that is in distinguishable from that produce by traditional means. As a result, vector systems are very popular in municipal applications where issues of engineering map production and database management predominate.
Geographic database concepts: Regardless of the logic used for spatial representation, raster and vector, we begin to see that a geographic database as a
complete database for a given region and is organized in a fashion similar to a collection of maps. Vector systems come closest to this logic with what are known as coverages. Map like collection that contain the geographic definition of a set of features and their associated attributes tables. However, they differ from maps in two ways. First, each will typically contain information on only a single feature types, such property parcels, soil polygons, and the like. Second, they may contain a whole series of attributes that pertain to those features, such as a set of census information for city blocks.
Raster system also uses this map like logic, but usually divide data sets into unitary layers. A layer contains all the data for a single attribute. Thus one might have a soil layer, a road layer and a land-use layer.
There are subtle differences, for all intents and purposes, raster layer and vector coverage can be thought of as simply different manifestations of the same concepts as the organization of the database into elementary map-like themes. Layers and coverage differ from traditional paper maps, however, in an important way. When a map is digitized, scale differences are removed. The digital data may be displayed or printed at any scale. More importantly, digital data layers that were derived from maps of different scale, but covering the same geographic area, may be combined.
GIS provide utilities for changing the projection and reference system of digital layers. This allows multiple layers, digitized from maps having various projections and reference system, to be converted to a common system.
With the ability to manage differences of scale, projection and reference system, layers can be merged with ease, elimination a problem that has traditionally hampered planning activities with maps. It is important to note, however, that the issue of resolution of the information in the data layers remains. Although features digitized from a poster sized world map could be combined in a GIS with features digitized from very large-scale local map, such as a city street map, this would normally not be done. The level of accuracy and detail of the digital data can be as good as that of the original maps.
Georeferencing: All spatial data files in GIS are georeferenced. Georeferencing refers to the location of a layer or coverage in the space as a definition by a known coordinate referring system. With raster images, a common form of georeferencing is to indicate the reference system, the reference units and the coordinate positions of the left, right, top, and bottom edges of the image. The same is true of the vector data files, although the left, right, top and bottom edges now refer to what is commonly called the bounding rectangle of the coverage; rectangle which defines the limit of the mapped area (corners of a feature). This information is particularly important in an integrated GIS since it allows raster and vector files to be related to one another in a reliable and meaningful way. It is also vital for the referencing of the data values to actual positions on the ground.
GIS Applicability: The society is so complex, and their activities so interwoven, that no problem can be considered in isolation or with out regard for the full range of its interconnections. For example, a new housing development will affect the local school system. The volume of city traffic put constraints on the maintenance of buried pipe networks, affecting health. The action needed to solve such a problems are best taken on the basis of standardized information that can be combined in many ways to serve many users. GISs have this capability.
Environmental and resource management: Decision making is becoming increasing complex as dwindling natural resources and more demanding economic priorities diminish the chances of today’s decision being right tomorrow. Furthermore, environmental awareness is constantly increasing among the general public, particularly among the younger generation. To help us map and monitor changes, and plan appropriate responses that take account of the complex interactions of the Earth system, many countries now have comprehensive programs to capture and archive information on the existing natural resources and known sources of pollution, using technologies such as satellite remote sensing and GIS. The data may be used both to expose conflicts and to examine environmental impacts and even simulate the causes and the alternative will become possible.
Planning and development: The planning and development of new housing, roads, and industrial facilities require data on the terrain and other geographical information. Development often involves building on marginal terrain, increasing the density of the building in the areas already built up, or both. Yet the new structures must fit with in the existing technical infrastructure; here computerization is a great aid. One of the benefits GIS holds for such projects is a minimalization of disruption to the existing infrastructure.
Escalating construction costs have made the optimizing of building and road location extremely important. Minimizing blasting and earthmoving are significant aspect of minimizing costs. Flexibility is vital: plans should be amenable to rapid changes as decisions are made. The influence of special interest groups and individual citizens require that initial plans be presented effectively and in a manner that is easily understood. Simplified, visualized plans are instrumental in conveying both the content of the scheme and the nature of any likely impact on those concerned.
Management and public services: In modern societies, decisions should be made quickly, using reliable data, even though there may be many differing viewpoints to consider and large amount of information to process. Today, the impact of development decisions is ever greater, involving conflicts between society and individuals, or between development and preservation. Information must therefore be readily available to decision makers; the majority of such information is likely to be geographical in nature, and best handled using GIS.
Overviews of administrative units and properties are crucial in the development of both virgin terrain and built-up area, in both developed and developing nations. In many countries, property registration is extensive: even in smaller states, 2 to 3 million properties maybe involved. Moreover, property is also an economic factor in taxation and security for loans; so comprehensive overviews are essential to a well-ordered society. Computerized registers based on GIS technology are now well established in many countries.
Land transportation: In many countries, the greater part of transportation has shifted from rail to road, at the same time, the use of private vehicle has greatly increased. These developments have created traffic problems, which cause loss of time and money. Large goods are now transported by road. In most countries the annual costs of traffic accidents have become extremely high. The automobile industry is now investing heavily in the development of driver information system, and several systems are now in the market. In principle, all of them involve simple GIS function with digital maps and supplementary information.