|
Results and Discussion
Three images from the 200-bands are shown in Fig. 4 and the classified output of the 250 x 250 hyperspectral 200 bands data is shown in Fig. 5. The proportions of each of the 4 minerals were computed based on 10 x 10 groups of pixels for 625 groups [(250 x 250) divided by (10 x 10)]. N-FINDR was used to extract the endmembers from the synthetic mixed pixels, which are shown in Fig. 6. The endmembers identified by the algorithm (drawn in red) have a good match with the actual ones (green in color). Abundances of each of the minerals from the artificial mixed pixels obtained from LMM are as shown in Fig. 7 (b)–(e). Fig. 7 (a) is the 10 times down-sampled image of the original mineral classified image (250 x 250) shown in Fig. 5 to compare hard classification with the abundance map visually. A three-layer MLP architecture was made with 4 input, 1 hidden and 4 output layers.

Fig. 4. A 200 band hyperspectral images generated from spectral libraries of four different minerals - (a) band 1 (b) band 100 (c) band 200.
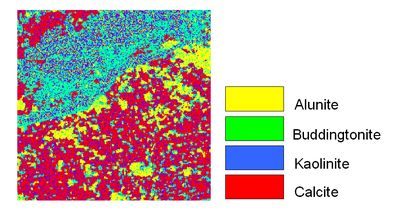
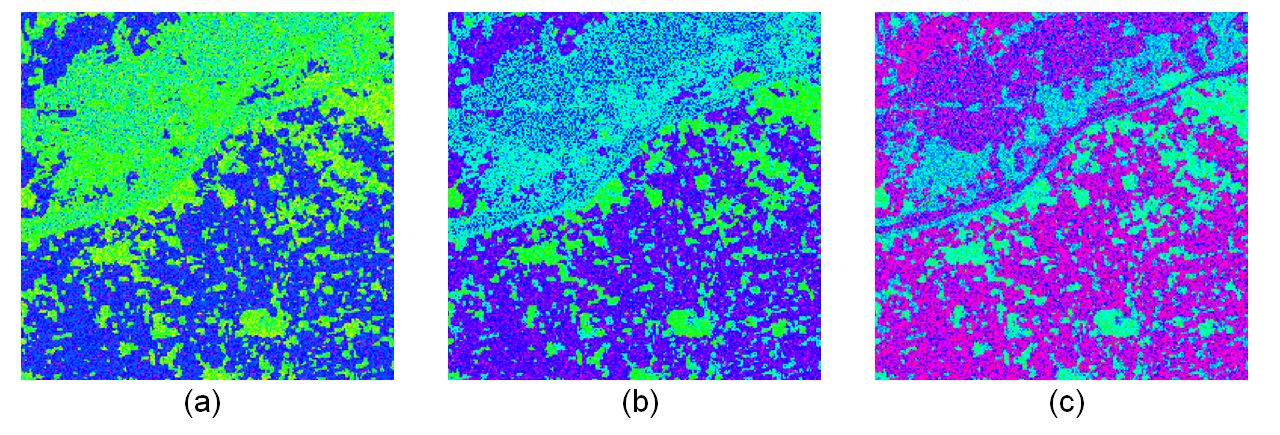
Fig. 5. Mineral classified map.

Fig. 6. Comparison between the true endmembers and endmembers computed from the N-FINDR algorithm. [X-axis: Band number, Y-axis: Reflectance value.]
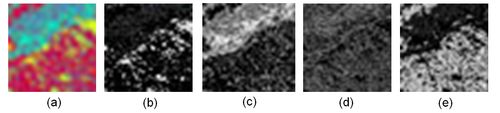
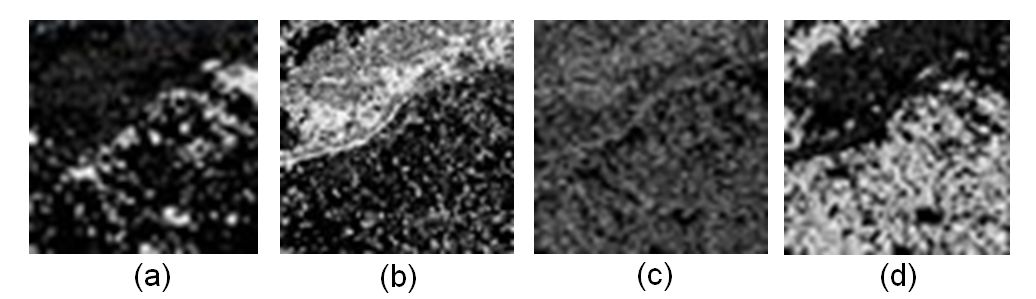
Fig. 7. (a) 10 times down-sampled mineral classified image; (b) – (e) show abundances of the four mineral obtained from the LMM.
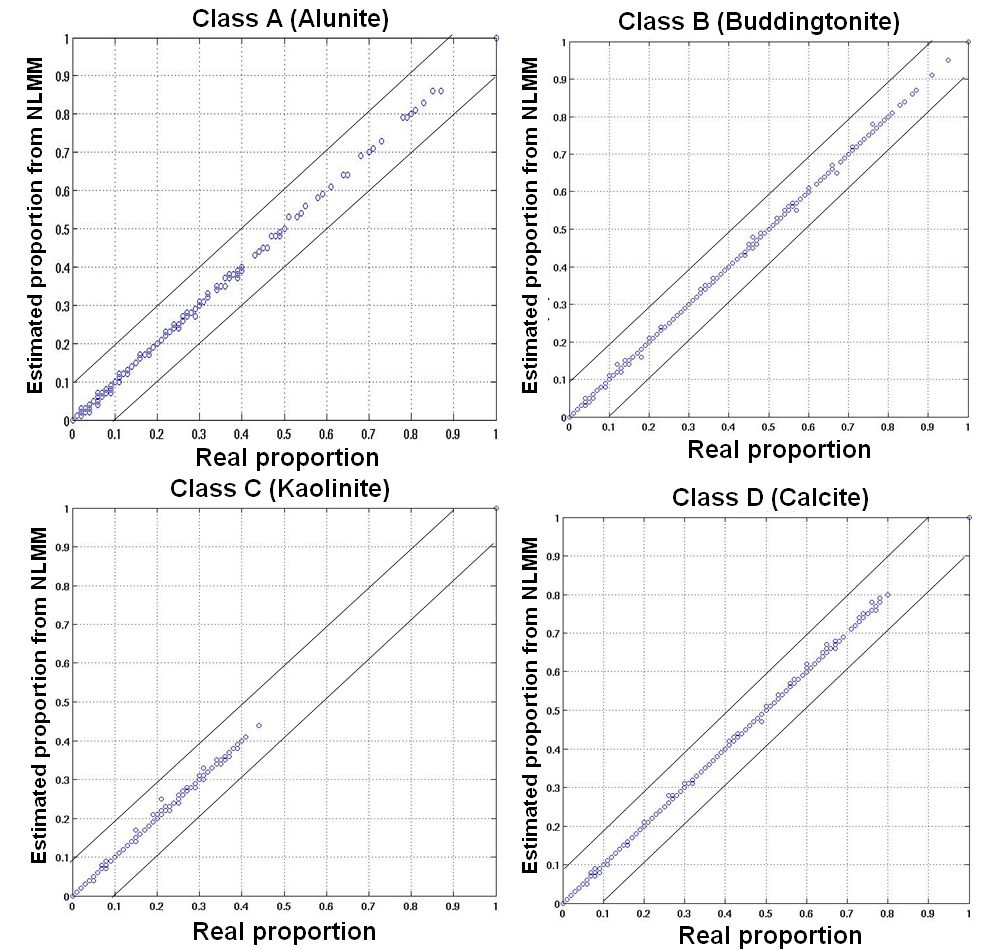
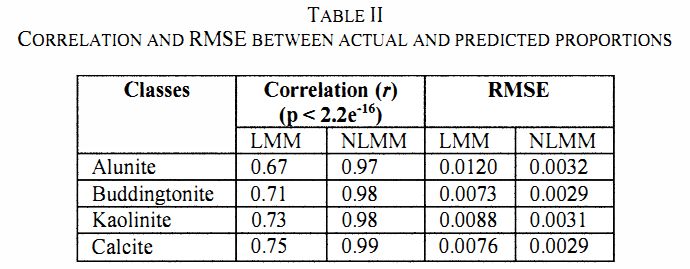
The number of hidden nodes in the hidden layer, learning rate, momentum and epoch were varied in steps to estimate the best abundance values that could account for the non-linearity in the mineral mixtures; until the performance saturated, as shown in Fig. 8. Table I lists the values of the training parameters along with the training time and the overall RMSE of the MLP network for every 500 epochs. Three measures of performance were used to evaluate the output from artificial dataset – RMSE, correlation, Bivariate Distribution Functions (BDFs). BDF is helpful to visualise the accuracy of prediction by mixture models. BDFs were plotted against the real proportions as shown in Fig. 9. Pearson’s product-moment correlation at 95% confidence interval and RMSE between the actual and estimated proportion from LMM and NLMM are given in table II. The average RMSE of the LMM was 0.0089±0.0022 while the average RMSE of the NLMM was 0.0030±0.0001 demonstrating the superiority of the NLMM over the LMM.
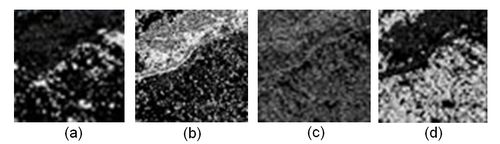
Fig. 8: Abundances maps of the four mineral obtained from the NLMM.
Table I. Details of training for unmixing of simulated dataset
| No. of epochs |
Learning rate |
Momentum term |
Training time (sec) |
Unmixing
time (sec) |
Overall
RMSE |
| 500 |
0.90 |
0.5 |
4 |
8 |
0.0160 |
| 1000 |
0.85 |
0.4 |
5 |
8 |
0.0117 |
| 1500 |
0.80 |
0.3 |
7 |
7 |
0.0030 |
| 2000 |
0.70 |
0.2 |
7 |
6 |
0.0071 |
| 2500 |
0.60 |
0.1 |
8 |
5 |
0.0115 |
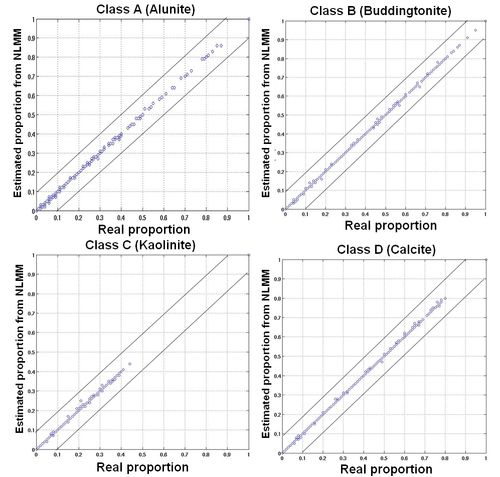
Fig. 9. BDFs of simulated test data for the four minerals obtained LMM.
Table II. Correlation and RMSE between actual and predicted proportions
| Classes |
Correlation (r)
(p < 2.2e-16) |
RMSE |
| LMM |
NLMM |
LMM |
NLMM |
| Alunite |
0.67 |
0.97 |
0.0120 |
0.0032 |
| Buddingtonite |
0.71 |
0.98 |
0.0073 |
0.0029 |
| Kaolinite |
0.73 |
0.98 |
0.0088 |
0.0031 |
| Calcite |
0.75 |
0.99 |
0.0076 |
0.0029 |
The MLP network can successfully approximate virtually any function when trained correctly. This implies that training is the most important step in MLP-based classification. 15% of the LMM based abundances along with the actual abundances were used for training and the MLP model could interpolate to produce many more combinations of class proportions to match the testing samples. The interpolation function minimises the difference between estimated and real class proportions. Since the approach in this work is a hybrid of linear and non-linear estimator, it can be easily adapted to either the linear on non-linear mixture model. Initialisation and training are the two issues in a MLP network that has to be dealt carefully. However, an effective learning algorithm should not depend on initial conditions, which can only affect the convergence rate but should not alter the final results [21]. Often, this is not the case of learning algorithms used for NNs. In order for a mixture model to be effective, initial values must be representative and cannot be arbitrary. Therefore, an important issue for successful application of this approach is the selection of endmembers. One of the potential draw back of the N-FINDR algorithm is that it requires at least one pixel in the image to be pure. This may not be the situation always. In such cases, alternative methods of endmember extraction have to be studied and integrated in the algorithm. Also, the simulated dataset in our work is noise-free (has no noise component), so, further research is required to analyse the impact of the interference of noise.
|


