3.1. ADMINISTRATIVE JURISDICTION FOR MANGROVES
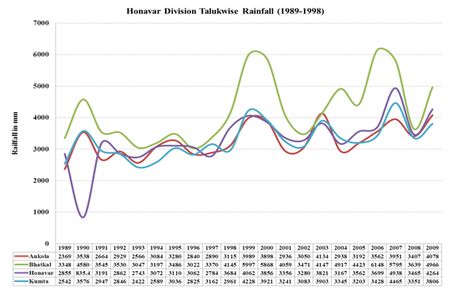
Honavar Forest Division (lat.13º 56’ 15” to 14º 41’ 15”N and long.74º 26’ 0” to 74º 46’ 20”E), is situated towards the Indian west coast and is one of the five forest divisions KanaraForest Circle, that has its jurisdiction over the entire Uttara Kannada district of Karnataka State (Figure 3.1.1). The division covers the forest areas of Kumta, Honavar and Bhatkaltaluks and part of Ankolataluk along the coastal Uttara Kannada. It is bounded byforest divisions of Kundapurto the south,,Sirsi and Sagar toward east, Karwar to the north and the Arabian Sea on the western side. There are four notablewest flowing rivers with their respective estuaries that merge with the Arabian Sea, viz.Gangavali, Aghanashini, Sharavathi and Venkatapur. The division receives heavy rains from the South-west Monsoon averaging nearly 4000 mm per year. The mean maximum & minimum temperature of the region lies in 27.33 (±5.86)ºC and % of relative humidity is 87.5(±7.5).The division has three sub divisions at Kumta,Honavar and Bhatkalsix forest ranges namely Hiregutti, Katgal, Kumta, Honavar, Manki, Gersoppa and Bhatkal. It covers 134082 ha (Table.3.1.1) of forest area which is of tremendous ecological and environmental importance being part of the Western Ghats.The forests are of evergreen, semi-evergreen and of secondary moist deciduous types. Considerable areas of forest tree plantations, many of them dating back to over one century are present here.
Table 3.1.1:Area-wise administrative categories of forests area in HonavarForest Division
(area in ha) |
| Range |
Reserved forest |
Protected forest |
Village forest |
Total forest area |
Total geographical area |
% forest area |
| Proper forest |
Minor forest |
Hakkal |
Betta |
| Bhatkal |
9421 |
9846 |
759 |
0 |
0 |
20026 |
27066.6 |
73.99 |
| Gersoppa |
18084 |
2731 |
|
0 |
0 |
20815 |
23362 |
89.10 |
| Hiregutti |
13162 |
6679 |
|
371 |
444 |
20656 |
29294.4 |
70.51 |
| Honavar |
9258 |
9796 |
|
514 |
0 |
19568 |
24151.6 |
81.02 |
| Katgal |
16175 |
3700 |
|
58 |
0 |
19933 |
23455.5 |
84.98 |
| Kumta |
12942 |
5489 |
|
192 |
1956 |
20579 |
28088.7 |
73.26 |
| Manki |
11297 |
7640 |
253 |
0 |
0 |
19190 |
24151.6 |
79.46 |
| Total |
90339 |
45881 |
1012 |
1135 |
2400 |
140767 |
179570.4 |
|
Source: Working Plan for the Honavar Forest Division 2003 to 2013
Figure 3.1. 1:Honavar Forest Division administrative map

Honavar Forest Division: Salient Features: The human population of Kumta, Honavar and Bhatkaltalukaswithin the division was482,482 as per 2011 census & as per 2007 livestock census the cattle number was 108,338 andthere were also 20,763 buffaloes. The rock formation is granitic and lateritic type and soil is lateritic with several variations in color and texture. The division has one hydroelectric power generation at Gersoppa, the Sharavathi Tailrace project, which caused submergence 700 ha of forest area. The taluk-wise rainfall details are given in Figure 3.1.2
Figure3.1.2.Taluk-wise annual rainfall in Honavar Forest Division(1989 to 1998)
Mangrove area distributionand suitable areas for planting: Areas under mangroves were estimated estuary-wise and total area given in Table 3.1.2. The same table also contains the number of mangrove patches for Honavar Division (1549 patches). Range-wise mangrove areasare given in Figure 3.1.3.Mangrove forests cover about 391 ha only, which makes just 0.28% of total forest area in the district. Suitable areas for mangrove planting constitute about 1019 ha, of which range-wise details are given in Figure 3.1.4. Despite small area mangroves they are highly integral to coastal ecology and productivity, fisheries and bird conservation as well as carbon sequestration and needs to be protected and enhanced with great care. While making this estimate we have not taken private holdings suitable for mangrove planting. If unused estuarine rice fields and abandoned shrimp farms are brought under mangroves, through the Government purchasing such areas from owners or through any other schemes mangroves in the division could be increased several times more. Range-wiseestimates show that Honavar Range with an estimated 129 ha of mangroves leads in area while least was in Manki Range with just 4 ha. Hiregutti Range with 708 ha leads in suitable area for mangrove planting whereas it was practically nil in Manki Range.
Table 3.1.2. Area estimates for mangroves and suitable areas for planting in Honavar Forest Division
| Division Name |
Honavar |
| Total Geographical area (ha) |
179,570.40 |
| Forest area (ha) |
140,767.00 |
| No. of mangrove patches |
1549 |
| Mangrove area (ha) |
390.74 |
| Total area for planting (ha) |
1019.10 |
Table 3.1.3.Range-wise area estimates for mangroves and suitable area for planting in Honavar Forest Division
| Sn. |
Range |
Mangrove area (ha) |
Suitable area for planting (ha) |
No. of mangrove patches |
No. of potential areas for planting |
| 1 |
Bhatkal |
36.4 |
22.8 |
231 |
40 |
| 2 |
Manki |
4.0 |
0.5 |
22 |
3 |
| 3 |
Honavar |
127.8 |
161.1 |
449 |
136 |
| 4 |
Kumta |
50.4 |
90.7 |
468 |
82 |
| 5 |
Katgal |
84.1 |
35.7 |
133 |
19 |
| 6 |
Hiregutti |
88.2 |
708.4 |
246 |
50 |
|
Total Div |
390.74 |
1019.10 |
1549.00 |
330.00 |
To enable mangrove management at grassroots level of forest administration Section-wise and Beat-wise details of areas under mangroves were estimated as well as suitable area available for planting (details in Table 3.1.4& 3.1.5 & Figures 3.1.5 -3.1.8. See also Annexures I-XI)
Figure 3.1.3. Range-wise division of mangrove area in Honavar Forest Division
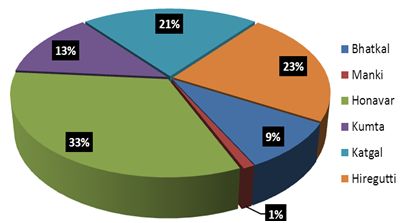
Figure 3.1.4.Rangewise % of potential area for mangrove planting in Honavar Forest Division

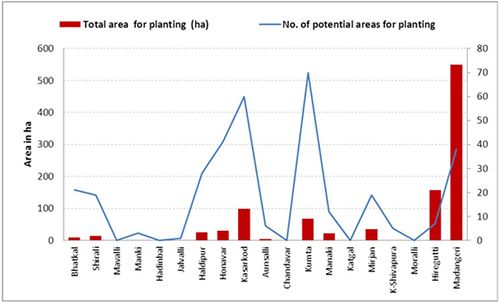
Table 3.1.4:Forest Section-wise area under mangroves and potential area for mangrove planting in Honavar Forest Division
| Sl.No. |
Section |
Section geographical area (ha) |
No. of mangrove areas |
Mangrove area (ha) |
No. of potential areas for planting |
Total area for planting (ha) |
Range |
| 1 |
Belke |
6294.0 |
4 |
0.2 |
0 |
0.0 |
Bhatkal |
| 2 |
Bhatkal |
8074.0 |
103 |
25.4 |
21 |
8.7 |
Bhatkal |
| 3 |
Shirali |
8584.0 |
124 |
10.8 |
19 |
14.1 |
Bhatkal |
| 4 |
Mavalli |
6405.0 |
17 |
3.4 |
NA |
NA |
Manki |
| 5 |
Manki |
6314.0 |
5 |
0.6 |
3 |
0.5 |
Manki |
| 6 |
Hadinbal |
4831.0 |
6 |
0.8 |
1 |
0.5 |
Honavar |
| 7 |
Honavar |
13440.0 |
407 |
117.1 |
129 |
156.1 |
Honavar |
| 8 |
Salkod |
7332.0 |
36 |
10.0 |
6 |
4.5 |
Honavar |
| 9 |
Chandavar |
15410.0 |
468 |
50.4 |
82 |
90.7 |
Kumta |
| 10 |
Katgal |
5907.0 |
4 |
0.2 |
NA |
NA |
Katgal |
| 11 |
Mirjan |
3287.0 |
129 |
83.9 |
19 |
35.7 |
Katgal |
| 12 |
Hiregutti |
5894.0 |
50 |
21.9 |
7 |
157.7 |
Hiregutti |
| 13 |
Madangeri |
7233.0 |
190 |
61.9 |
38 |
549.3 |
Hiregutti |
| 14 |
Gundubala |
8533.0 |
6 |
4.3 |
5 |
1.4 |
Hiregutti |
|
Total |
107538.0 |
1549 |
390.7 |
330 |
1019.1 |
|
Figure 3.1.5: Section wise area (ha) under mangroves
 under mangroves.jpg)
Figure 3.1.6:Section wise number of mangrove patches
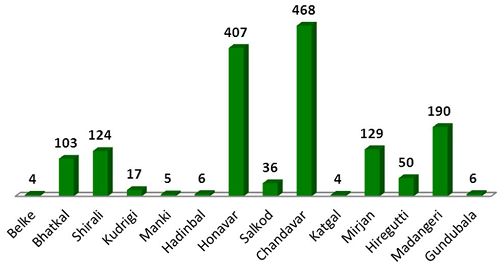
Figure 3.1.7:Section wise total area (ha) suitable for mangroves planting
 suitable for mangroves planting.jpg)
Figure 3.1.8:Sectionwise number of potential areas for mangrove planting
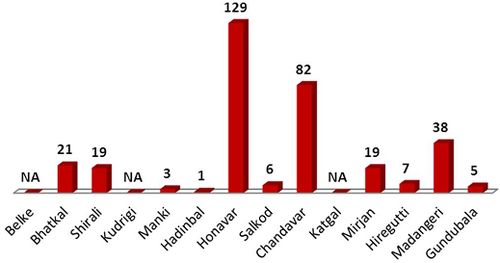
Table 3.1.5: Beat-wise details of number of mangrove areas, total area, and area suitable for planting

Figure. 3.1.9: Beat-wise mangrove area vs number of patches

Fig 3.1.10: Beat-wise potential area for plantation vs no. of suitable areas available for planting