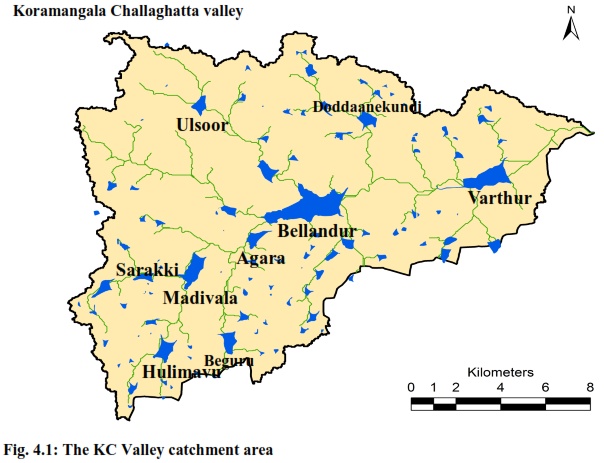
Presently there is a meagre understanding on the nutrient dynamics of urban systems in relation to the size of nutrient pool and type of losses across the transport process that can be understood with a mass-balance approach (Rodriguez and Macias, 2005). Considering the Nutrient inputs from the urban population (organised/un-organised) where we have high nutrient flux due to open sewers, soak pits, septic tanks and to a lesser extent practices like open urination and defecation, the nutrient flux as infiltrations would result in high leaching losses and reason for accumulation of nutrients in groundwater causing contamination. The present population in the city depends on ~30% on groundwater, with potentially high N enrichment due to the above mentioned causes. This requires immediate interventions in regulating and checking this enrichment in ground water sources that requires a proactive action with interdisciplinary knowledge driven decisions and identifying possible accountability on extent of damage already made to the ground water resources and the anticipated costs for the remediation/mitigation. Of the three catchments, the KC valley (Fig. 4.1) spanning over 255 km2 forms the major lake cluster and collects bulk of the overland surface flows of the Bangalore city (~45 %) across the drainage channels mediated by historic storm water drains (Rajukaluves). Bellandur and then Varthur lakes (apparently the largest water bodies of the city i.e. 367 and 190 hectares respectively) form the end of the chain lakes in KC valley catchment before it drains to Kalaveripalli reservoir and Krsihnagiri dam in Tamil nadu and becomes a main feeder to Dakshina Pinakini River. These water bodies are of utmost importance in relation to water storage, and as an indicator of water quality, quantity and the nature of the catchment.
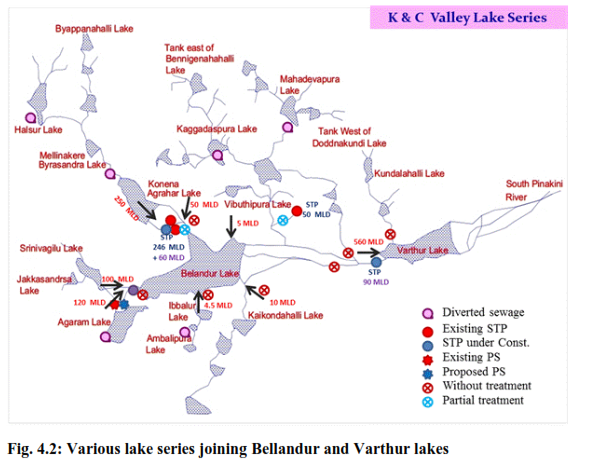
The KC valley catchment harbours about 56 lakes with a potential storage volume of ~200 million m3 (~7.3 TMC), where the both Bellandur and Varthur at present have water storage capacities of ~5.5 and ~1.61 Mm3 that is very small compared to the total catchment yields and the storage capacity of the lake system. However on the basis of historical data in terms of surface area and depth according to the Survey of India, topographic maps (based on contours) the potential storage capacity 18.67 Mm3 and ~6.10 Mm3 for Bellandur and Varthur respectively. This put together accounts to ~25 Mm3 i.e. only one eighth of the potential water storage capacity of the catchment. On account of water balance of the region, the region receives >750 mm rainfall in ~40 % of the catchment area, from 750-850 mm rainfall in >50 % of the area and >850 mm rainfall in <10 % of the total catchment area. The runoff based on the natural topology of the region ranges from 500 to 700 mm. Based on this inputs the total overland flow in the KC valley catchment is around 5.3 TMC i.e. ~35 % of the total run off of Bangalore region. The feeder to Bellandur lakes are a) Ulsoor lake series (north-west); b) Hulimavu lake series C) Sarakki lake series d) Beguru lake series e) Ambilipura lake series f) kaikondarahalli lake series and g) Doddaanekundu lake series According to the studies conducted earlier considering the net water supply to the city. An estimated ~500 MLD of total wastewater flows in the catchment that are partially treated by the STP’s. The existing treatment facility running in the KC valley is the K & C valley STP 248 MLD (163+55+30); Madivala STP (4 MLD) and Kadabesena halli STP (50 MLD) (provided in Fig. 4.2). These treatment units running at ~50 5 of its installed capacity and highly inadequate to treat the wastewater of the region. Though there are new provisions for many new STP’s at crucial important sewerage drawing location proposed by BWSSB under SWD Plan a strategic know how of the drainage basin and the sewerage load is still missing in the conceptual plan. Some of the STP’s in the KC valley have been already commissioned and are projected to work from march, 2017 as an extension of the K and C valley STP for another 60 MLD, Bellandur Ammanikere STP (90 MLD). These systems still needs a huge quantity of electricity to pump sewage from the pumping units located at Agaram lake (additional pumping unit being built) to the STP’s i.e 60 MLD to additional treatment unit to K & C valley and 90 MLD to Bellandur ammanikere STP upstream of Varthur. To save the cost of laying UGD to these centralised STP’s, and capital and OM cost of the present pumping station and the additional pumping requirement a potential option is to treat the wastewater right at the collection node near the mouth of the trunk sewers, by setting up an STP in the land earmarked for public utilities like waste management in this area (Fig. 4.3).
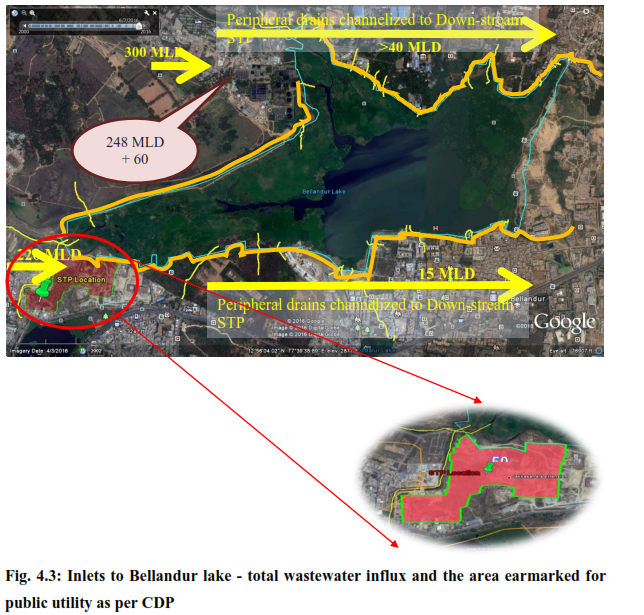
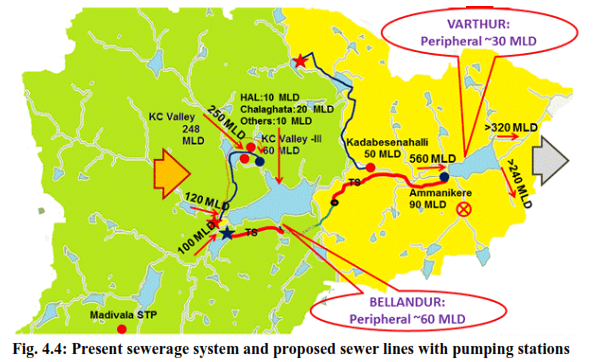
The flow calculations shows a sewage influx of >500 MLD, considering ~5% as evaporation losses around ~25 MLD is lost to atmosphere. Sewage from the residential sector is about 420 MLD (Annexure III). An additional 40 MLD is contributed by the immediate peripheral wastewater influx apart from major inlets from KC valley and Agaram inflow points. These are contributed by the sewerage from HAL, Challaghatta, Ibblur lake etc. Large influx of sewer water into the lakes despite treatment efforts by BWSSB are due to diversions of sewage from major lake inlets directly into Bellandur lake. Similarly the flow estimation of Varthur lake shows 560 MLD of wastewater entering through the major inlet from Ammanikere and additional 30 MLD from the peripheral water influx regions adding up to a total of ~590 MLD into the lake (Fig. 4.4).
In the city considering an average population density of 10,000 person/sq. km i.e. ~100 person/ha with a use of ~20 gN/capita/day, the anthropogenic N flux is ~0.73 tons/ha/yr. As the cost of nutrients have been exceedingly high, this is the right time where the principles of re-use and recycle can be adopted to augment out nutrient requirements where we have huge resource constraint in the state. In case of the K and C valley and other lake series draining into the Bellandur and Varthur lake series assuming that ~50 % of N inflows into sewers. The balance N fraction can losses due to leaching, on land decomposition, decomposition along the flow path of ~15 km through decomposition in water and bacterial and algal uptake during the flow. Even then ~45 tons of N enters into this system every day (TN entering the system ~60-90 mg/l). The total loading rate of N in Bellandur lake ~8.18 gN/m3/day. Where the Bellandur lake traps and transforms ~60 % of the TN and there is a loss of ~40 % (~20-40 mg/l) and around ~60 % of then is cellular N. This N escaping from the system becomes a huge load to adjoining lake systems as Varthur. Provisions for a complete capture of this appreciable N pool will lead to complete resource recovery that is presently undervalued and inadequately and unsuitably used. Similarly considering ~5 gP/capita/day, the anthropogenic P flux is ~0.18 tons/ha/yr and the lading rate is around 3.63 gP/m3/day. ~20 tons of P enters the Bellandur lake system (TP entering the system 15-30 mg/l). Here the net P accumulated in the system is ~70 % and the balalnce flows out through the outlets. The major sources of P are human excrements and extensive use of sodium tri-poly phosphate (STPP) based detergents and to a smaller extent industries in the catchment. These huge urban nutrient pool sizes can be estimated with help of steady state mass balance approach.
The urban sewerage system transports a massive quantity of carbonaceous compounds mainly in the organic form to the downstream regions with the help of the lake systems in Bangalore. The Bellandur lake series comprise of few lake systems that joins at the Bellandur segment. Earlier reports from as per LDA, 2006 show ~ 400-500 MLD of sewage entering the Bellandur Lake. With a water spread area of 380 ha and an average depth of 2 m, the total wastewater influx into the Bellandur lake ~500 MLD, the HRT of the system ~16 days during high flow conditions and ~20 days during low flow conditions considering the flow as ~400 MLD. During monsoon the lateral run-off and the additional storm water further pulls down the average HRT of the lakes ~7-10 days. Considering TOC variation of 120 to 390 mg/l with a flow of ~500 MLD. The total C input into the lake on an average 125 tons/day. Due to stagnation and various stationary zones on the surface of the lake the contents of the lake do not mix completely like a continuously stirred tank reactor (CSTR) and acts as a mixed flow reactor (MFR). For the calculated input of ~125 tC and the present volume of the lake ~5.5 Mm3, the C loading rate is 22.73 gC/m3/d into Bellandur lake. Compared to the loading rates observed in a sewage treatment lagoon and detention ponds these vales are nominal and can be easily managed by mere detention by virtue of the bio-physical and chemical transformations. But, these systems act as incompletely mixed reactors with a negligible surface flow and higher detention resulting in uneven oxic/anoxic zones with varying treatment abilities.
4.1 Waste-Water Treatment Unit Operations and Processes
The wastewater treatment bioprocesses transform minute solids and dissolved organic matter present in wastewaters into organic and inorganic solids that can be settled by application of flocculants.
Process analysis:
- Microbes as bacteria – transforms particulate carbonaceous colloidal matter and dissolved organics present in wastewater into bulkier cellular lumps/tissues and into gases as a metabolic by product.
- The gases escape into the environment
- The cellular masses are removed with the help of sedimentation tanks or clarifiers.
- The main objectives of Bio-treatments are to reduce organic matter in wastewaters mainly measured in the form of BOD, COD and TOC.
- Bio-treatments also remove nutrients (N and P) from wastewaters.
- These bioprocesses are used in tandem with other physico-chemical processes for attaining optimal effluent quality.
- Bio-processes technologies used in wastewater treatment can be broadly divided into three categories – Aerobic, Anaerobic and Anoxic
- These processes can be run either as suspended growth system or attached growth system or as a combination of both.
Working of Conventional Wastewater Treatment Systems: The conventional treatment set up for wastewaters comprise of primary, secondary and tertiary treatments (Table 4.1) that involves various steps
Screening is essentially to remove larger floating solids that take a very long tome for breakdown and decomposition. The screen comprises of an ordered array of flat metal plates that are welded to the horizontal bars at ~ 4 cm – 2 cm spacing. During the course of the water flow, the screens are juxtaposed perpendicular to the flow direction. The large amount of floating materials, sand debris, polymers etc stuck to the screen is removed manually or through other mechanical means. These floatable materials are then carried out as solid waste for proper disposal.
The grit removal process mainly intends to remove heavy and inert inorganic matter. Grit, dense coarse materials, sand, shells, gravel and other heavy inorganic matter tend to settle bt sedimentation in the settling basin within a minute. The materials are then send to proper disposal sites.
The primary clarification happens in a settling basin that is intended for settling of heavier inorganic matter. These clarifiers have detention period of ~ 120 minutes and are mostly circular in shape. The settled materials on various parts of the clarifiers are scraped and pushed towards the centre with the help of rakers and the settled material mostly known as primary sludge are then transported to the through the primary sludge pump to the sludge digesters. Importantly in this exercise ~40 % of BOD and ~70 % of suspended solids are removed.
Secondary treatment involving suspended aerobic processes in carried out with the help of aerobic microbes. At this stage, the wastewater are mostly devoid of particulate inorganic and organic matter and comprise of decomposed or semi-decomposed organic matter i.e. carbohydrates, proteins, lipids, fibres etc., in the presence of oxygen and aerobic bacteria these compounds are broken down into simpler forms as carbon dioxide, ammonia, water etc. The microbial activity transforms these dissolved forms into flocculating biomass and the finer organic matter into settleable mass. The oxygen is provisioned through the help of surface aerators that helps in the growth of aerobic bacteria that are required for the decomposition of organic matter. The powerful surface aerators droves the wastewater through a mechanical churning process from the bottom of the aeration tank units and splatters it over the surface thus ensuring oxygenation mobilisation.
Secondary treatment involving attached growth processes involves of wastewater over a combination of media that acts as substrates for attachment and growth of microbes over the surfaces. In this biological process the surface grown biological microbial assembly absorbs the organic matter the wastewaters and starts multiplying of the surface of the substrates. When the weight of the surface biomass becomes critical is swept away by the trickling waters that captured in the subsequent settling units and are often recycled back. Various types of media can be used for development of the attached microbial communities as gravel, pebbles; granite of ~10-15 cm is often used in trickling filters.
The final round of settling the solids is performed by the secondary clarifiers where the microbial flocks comprising of cellular biomass and organic aggregates are made to settle. Usually these settling clarifiers are circular in shape and with a retention time of ~90-120 min. The same rakers are used to draw the settled sludge to the centre which is then carried for recirculation to the aerobic tanks or the trickling filters. The excess amount of the solid/sludge is transferred to the sludge thickeners that separate the excess water content in the sludge. This biological process ensures ~90% of BOD removal and ~90% of SS removal of the influent wastewater.
Table 4.1: Various wastewater treatment and process parameters
Physical |
Chemical |
Biological |
- Screening
- Comminute
- Flow equalization
- Sedimentation
- Flotation
- Granular-medium filtration
|
- Chemical precipitation
- Adsorption
- Disinfection
- Dechlorination
- Other chemical applications
|
- Activated sludge process
- Aerated lagoon
- Trickling filters
- Rotating biological contactors
- Pond stabilization
- Anaerobic digestion
- Biological nutrient removal
|
WWT Technologies working at Bangalore are
- ASP (Activated Sludge Process)
- EA (Extended Aeration)
- TF (Trickling Filters)
- UASB (Up-flow Anaerobic Sludge Blanket Reactor)
- SBR (Sequential Batch Reactor)
- MBR (Membrane Bio-Reactor)
- MBBR (Moving Bed Biofilm Reactor)
- CAB (Cascading Algal Bioreactor)
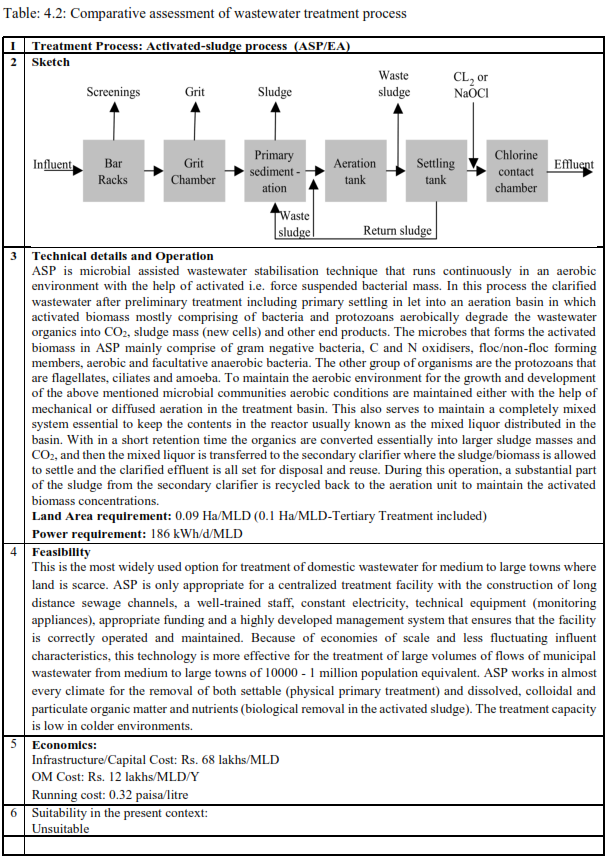
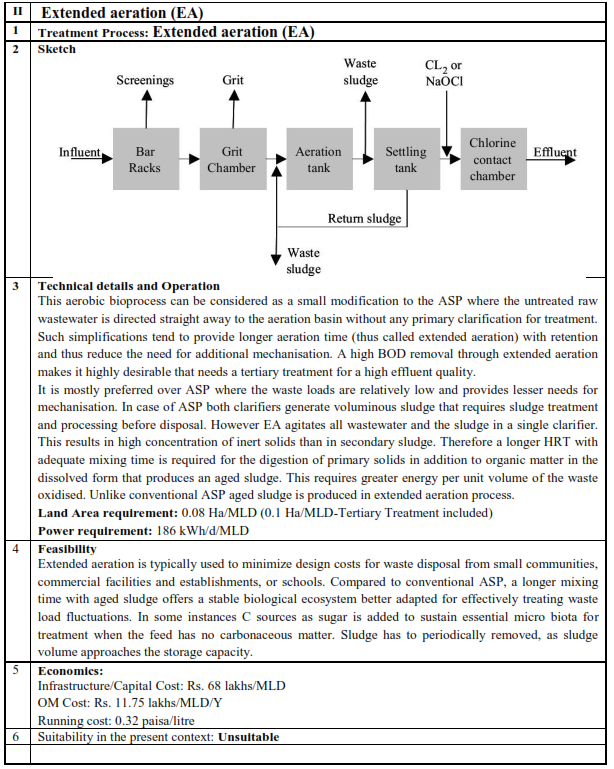
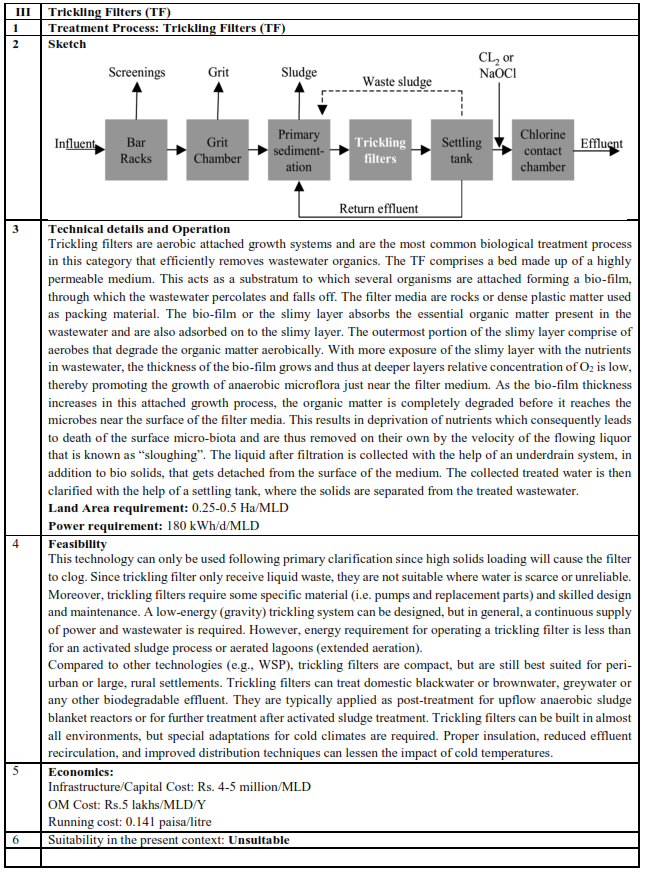
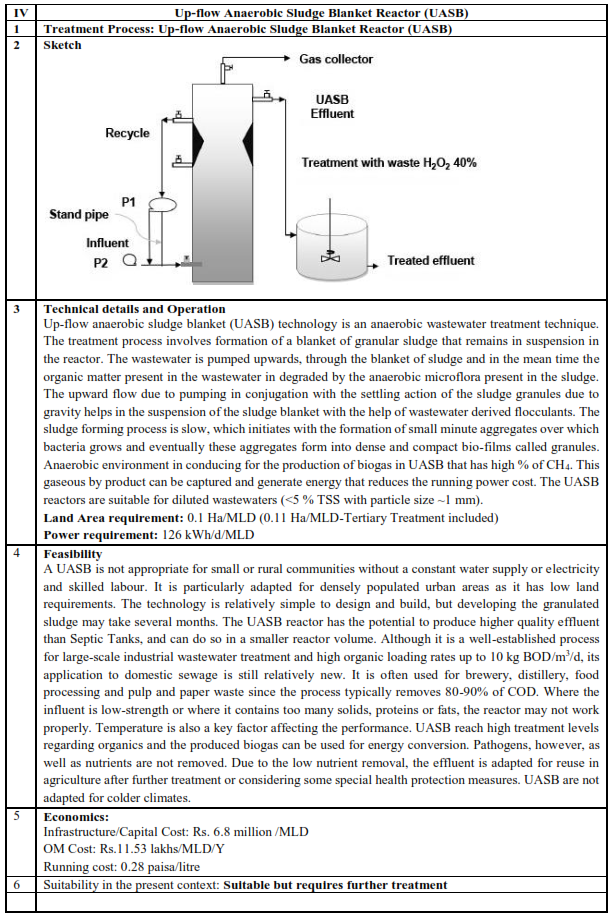
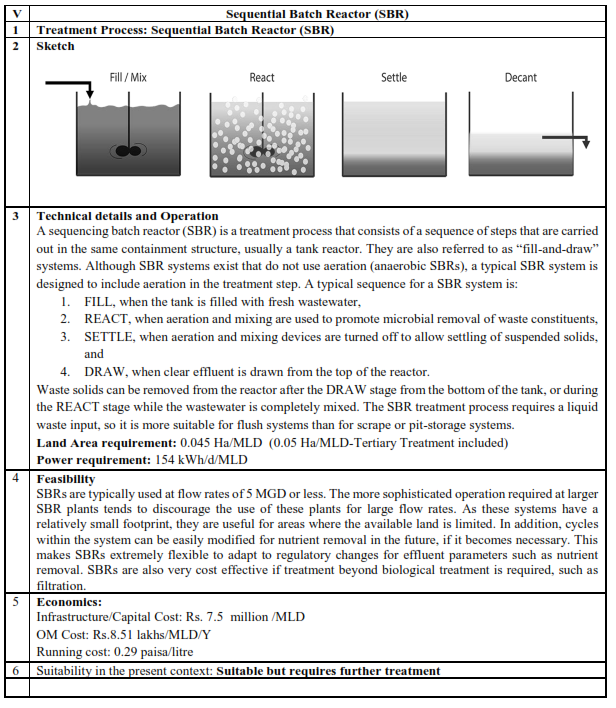
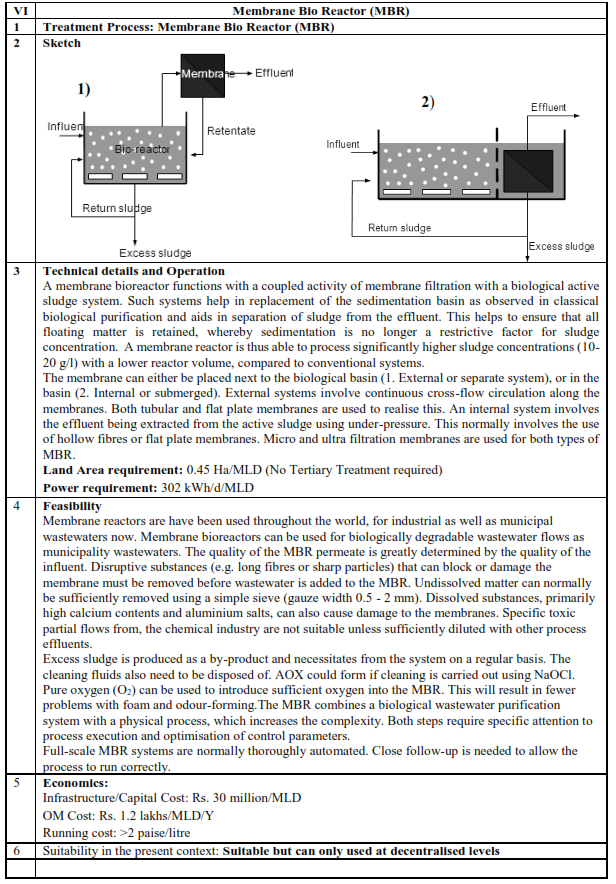
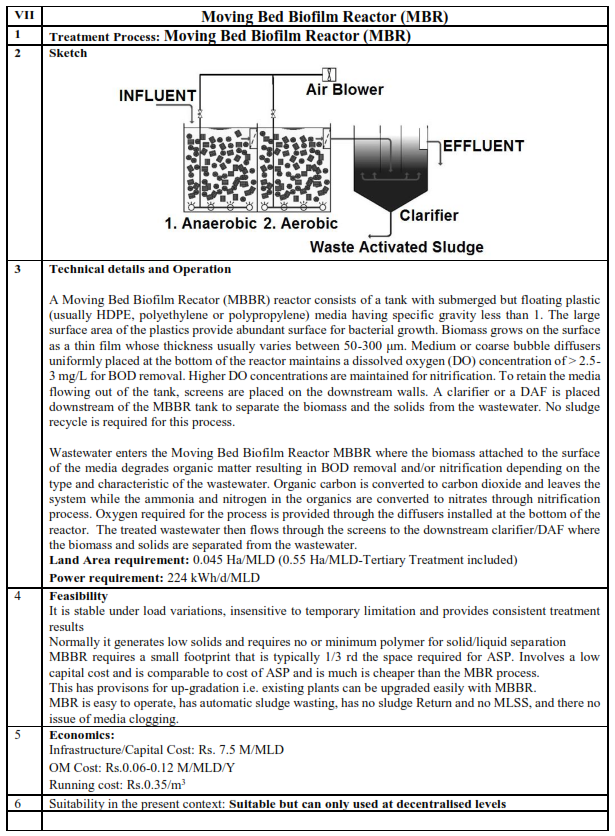
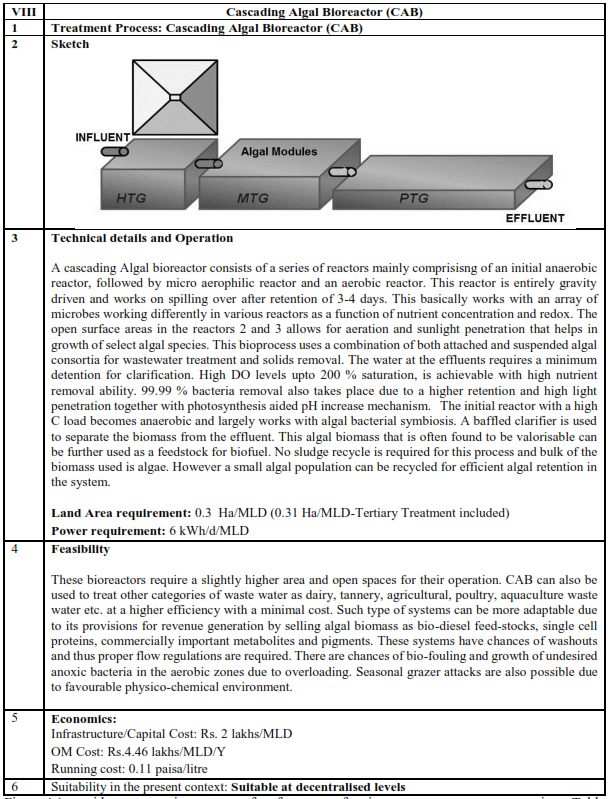
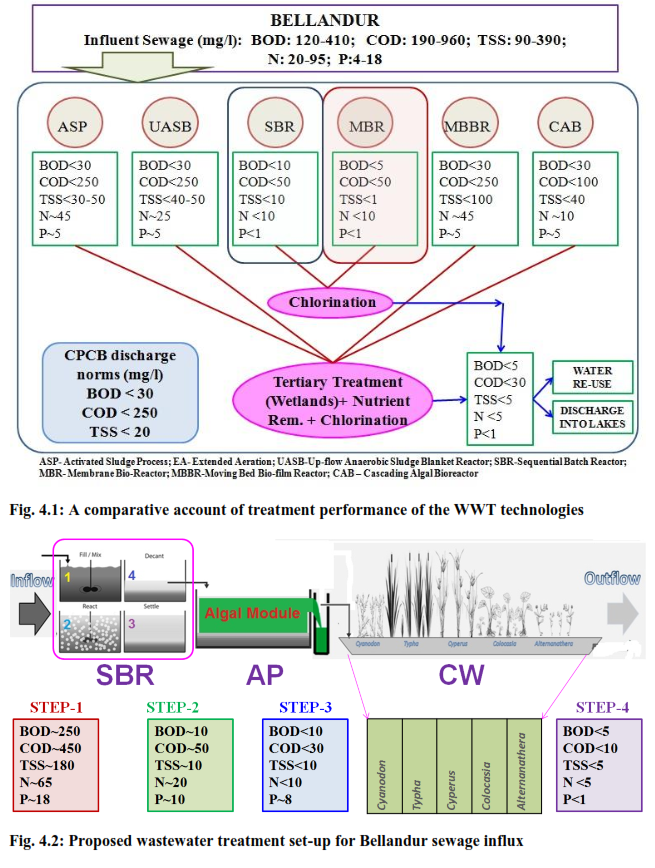
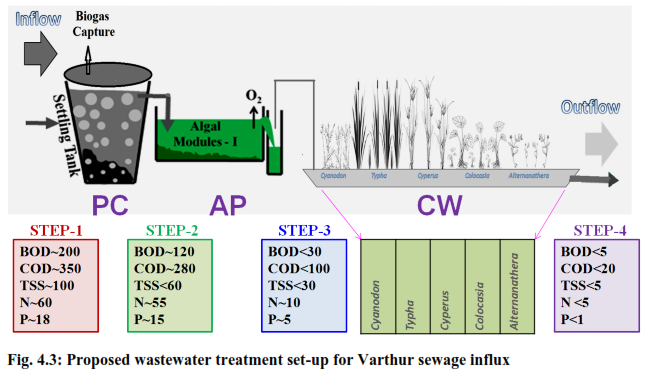
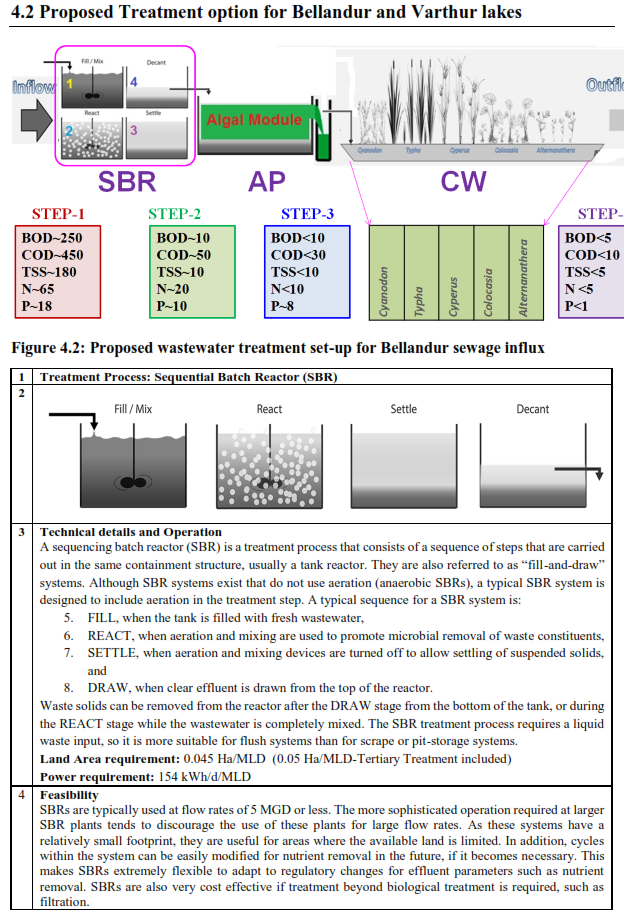
Figure 4.1 provides comparative account of performance of various wastewater treatment options. Table 4.2 lists the treatment efficiency and area requirement for WWTP, while Table 4.3lists the relative advantages of various treatment technologies and Table 4.4 gives the comparative assessment of capital and OM Cost. Proposed wastewater treatment set-up for Bellandur sewage influx is given in Figure 4.2 and for Varthur lake is given in Figure 4.3.
Table 4.2: Treatment efficiency and area requirement for WWTP
Parameter |
Treatment Technologies |
ASP/EA |
UASB+EA |
SBR |
MBR |
MBBR |
CAB |
Treatment efficiency |
BOD, mg/l |
<20 |
<20 |
<10 |
<5 |
<30 |
<30 |
COD, mg/l |
<250 |
<250 |
<100 |
<100 |
<250 |
<100 |
TSS, mg/l |
<100 |
<100 |
<10 |
<5 |
<100 |
<100 |
Bacterial removal (log orders) |
~2-3 |
~2-3 |
~3-4 |
~5-6 |
~2-3 |
~4-5 |
TN rem. Efficiency (%) |
10-20 |
10-20 |
70-80 |
70-80 |
10-20 |
70-80 |
TP rem. Efficiency (%) |
- |
- |
80-90 |
- |
- |
60-70 |
Area Requirements |
Area Requirement (Ha/MLD) |
0.09 |
0.1 |
0.045 |
0.045 |
0.045 |
0.3 |
Sec + Tertiary Treatment |
0.1 |
0.11 |
0.05 |
0.045 |
0.055 |
0.31 |
Table 4.3: Relative advantages of various treatment technologies
Criteria |
ASP/EA |
UASB+EA |
SBR |
MBR |
MBBR |
AP |
Comm |
Comments |
Quality of Treated effluent |
++ |
++ |
+++ |
++++ |
++ |
++ |
|
++++ è very high |
Nutrient Removal potential |
+ |
+ |
+++ |
++ |
+ |
+++ |
|
+++ è high |
Low Land Requirement potential |
++ |
+ ++ |
+++ |
+++ |
+++ |
+ |
|
++è medium |
Low Capital Cost potential |
+++ |
+++ |
++ |
+ |
++ |
+++ |
|
+è low |
Low Power Requirement potential |
++ |
++++ |
+++ |
+ |
++ |
++++ |
|
++++ è very high |
Electricity generation potential |
+ |
++ |
+ |
+ |
+ |
+ + |
|
+++ è high |
Low O & M Skills potential |
+++ |
+++ |
++ |
+ |
+++ |
++++ |
|
|
Table 4.4: Capital and OM Cost
Cost estimation |
Treatment Technologies |
ASP/EA |
UASB+EA |
SBR |
MBR |
MBBR |
CAB |
Capital Cost |
Capital Cost in Rs. (Lakhs/MLD) |
68 |
68 |
75 |
300 |
68 |
2 |
OM Cost |
Power (kWh/d/MLD)
(Tech. + Other Use) |
186 |
126 |
154 |
302 |
224 |
6 |
Power cost [@ Rs. 6 per kWh] Rs./MLD/h |
46 |
31 |
38 |
76 |
56 |
6 |
Annual Power Cost (Lakhs/MLD) |
4.07 |
2.75 |
3.37 |
6.65 |
4.9 |
0.5 |
Annual Repair Costs (Lakhs/MLD) |
2.38 |
2.48 |
1.84 |
-- |
1.94 |
1.76 |
Annual Chemical Costs (Lakhs/MLD) |
5.3 |
6.3 |
3.3 |
-- |
5.3 |
7.2 |
Total Annual OM Costs (Lakhs/MLD) |
11.75 |
11.53 |
8.51 |
-- |
12.14 |
4.46 |
*Annual Man Power Cost (Lakhs) |
14.04 |
14.04 |
8.64 |
-- |
10.32 |
10.68 |
Treatment Cost, paisa/litre (Sec. levels) |
0.32 |
0.28 |
0.29 |
-- |
0.33 |
0.11 |
4.3 Constructed Wetlands
The loss of ecologically sensitive wetlands is due to the uncoordinated pattern of urban growth happening in Bangalore. This is due to a lack of good governance and decentralized administration evident from a lack of coordination among many para-state agencies, which has led to unsustainable use of the land and other resources. Failure to deal with water as a finite resource is leading to the unnecessary destruction of lakes and marshes that provide us with water. This failure in turn is threatening all options for the survival and security of plants, animals, humans, etc. There is an urgent need for:
- Restoring and conserving the actual source of water—the water cycle and the natural ecosystems that support it—are the basis for sustainable water management.
- Reducing the environmental degradation that is preventing in attaining the goals of good public health, food security, and better livelihoods.
- Improving the human quality of life that can be achieved in ways while maintaining and enhancing environmental quality.
- Reducing greenhouse gases to avoid the dangerous effects of climate change is an integral part of protecting freshwater resources and ecosystems.
A comprehensive approach to water resource management is needed to address the myriad water quality problems that exist today from nonpoint and point sources as well as from catchment degradation. Watershed-based planning and resource management is a strategy for more-effective rejuvenation, protection and restoration of aquatic ecosystems and for protection of human health. In this regard, recommendations to improve the situation of the lakes are:
- The need for good integrated governance systems in place with a single agency with statutory and financial autonomy to act as the custodian of lakes for maintenance and action against polluters.
- Effective judicial systems for speedy disposal of conflicts related to encroachment
- Access to information for the public through digitisation of land records and availability of this geo-referenced data with query based information systems
- Measures to clean and protect lakes
- Removal of encroachments from lakes, lake water beds and storm water drains, regular cleaning of lakes.
- Proper measures such as fencing to protect lakes and prevent solid waste from going into lakes
- Install water fountains (music fountains) which enhances the aesthetic value of the lake and also aid as recreation facility to IT professionals (working in IT sector in this locality) and elderly people. This also helps in enhancing oxygen levels through aeration.
- Introduce ducks (which helps in aeration)
- Introduces fish (surface, column and benthic dwellers) which helps in maintaining food chain in the aquatic ecosystem. This has to be done in consultation with fish experts.
- No exotic fish species introduction avoid commercial fish culturing (commercial fishery)
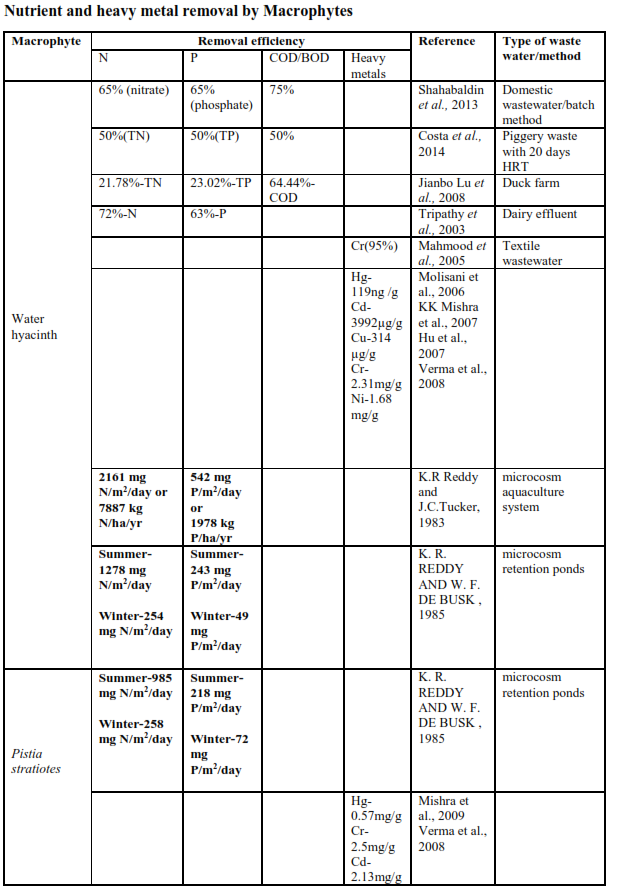
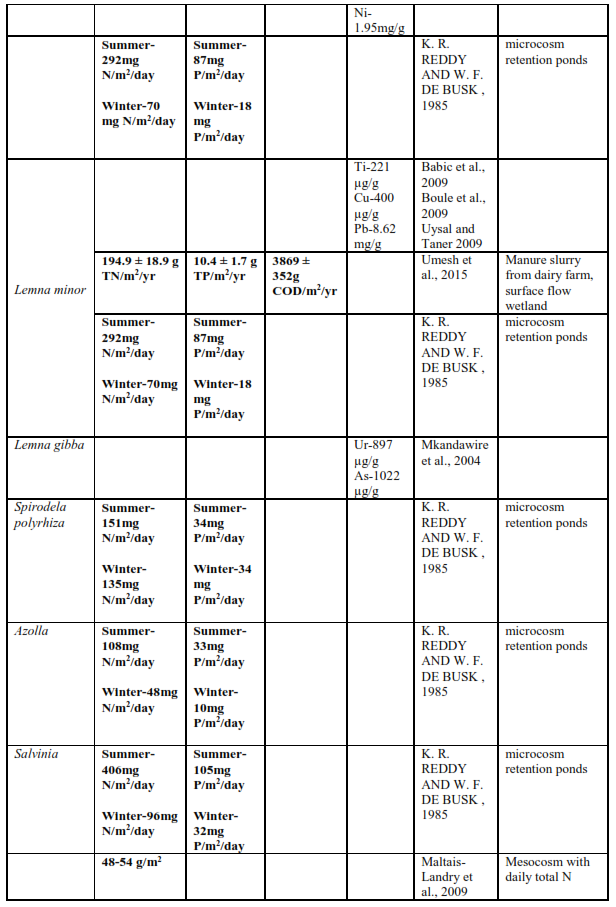
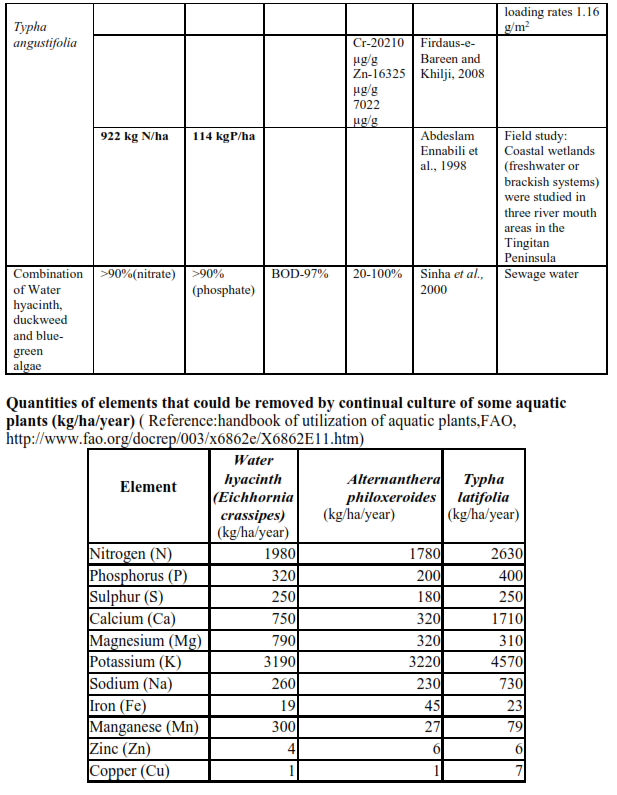
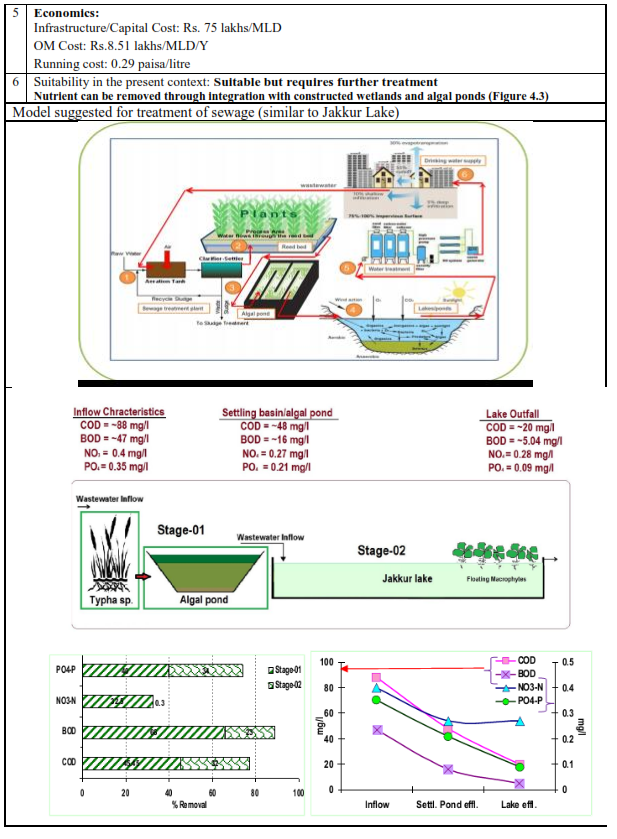
- Decentralised treatment of sewage and solid waste (preferably at ward levels). Sewage generated in a locality /ward is treated locally and letting only treated sewage into the lake (Integrated wetlands ecosystem as in Jakkur lake). Integrated wetlands system consists of sewage treatment plant, constructed wetlands (with location specific macrophytes) and algal pond integrated with a lake. Constructed wetland aid in water purification (nutrient, heavy metal and xenobiotics removal) and flood control through physical, chemical, and biological processes. When sewage is released into an environment containing macrophytes and algae a series of actions takes place. Through contact with biofilms, plant roots and rhizomes processes like nitrification, ammonification and plant uptake will decrease the nutrient level (nitrate and phosphates) in wastewater. Algae based lagoons treat wastewater by natural oxidative processes. Various zones in lagoons function equivalent to cascaded anaerobic lagoon, facultative aerated lagoons followed by maturation ponds. Microbes aid in the removal of nutrients and are influenced by wind, sunlight and other factors (Ramachandra et al., 2014). This model is working satisfactorily at Jakkur. The sewage treatment plant removes contaminants (evident from lower COD and BOD) and mineralises organic nutrients (NO3-N, PO43- P to inorganic constituents. Integration of the conventional treatment system with wetlands [consisting of reed bed (with typha etc.) and algal pond] would help in the complete removal of nutrients in the cost effective way. Four to five days of residence time in the lake helps in the removal of pathogen apart from nutrients. However, this requires regular maintenance through harvesting macrophytes and algae (from algal ponds). Harvested algae would have energy value, which could be used for biofuel production. The combined activity of algae and macrophytes helps in the removal of ~45% COD, ~66 % BOD, ~33 % NO3-N and ~40 % PO43- P. Jakkur lake acts as the final level of treatment that removes ~32 % COD, ~23% BOD, ~ 0.3 % NO3-N and ~34 % PO43- P. The lake water with a nominal effort of sunlight exposure and filtration would provide potable water. Replication of this model in rapidly urbanizing landscapes (such as Bangalore, Delhi, etc.) would help in meeting the water demand and also mitigating water scarcity through recharging of groundwater sources with remediation.
-
Better regulatory mechanisms such as
- To make land grabbing a cognizable, non bailable offence
- Implementation of the polluter pay principle
- Ban on construction activities in the valley zones
- Restriction of diversion of the lakes for any other purposes
- Decentralised treatment of sewage and solid waste and restriction for entry of untreated sewage into the lakes
-
Encouraging involvement of local communities: Decentralised management of lakes through involvement of local communities in the formation of local lake committees involving all stakeholders.
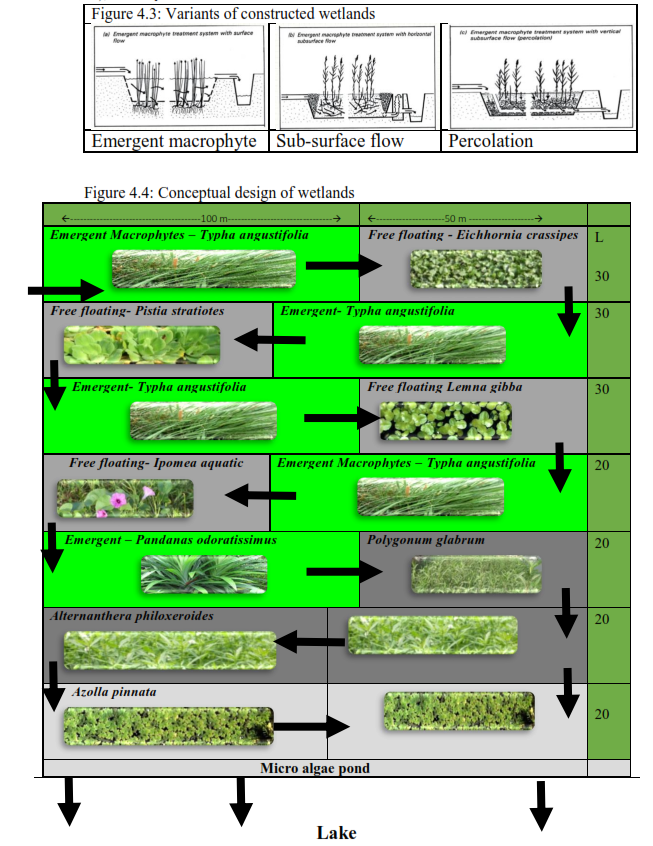
Area required for Constructed Wetlands: Taking advantage of remediation capability of aquatic plants (emergent macrophytes, free floating macrophytes) and algae, constructed wetlands have been designed and implemented successfully for efficient removal of nutrients (N, P, heavy metals, etc.). Different types of constructed wetlands (sub surface 0.6 m depth, surface: 0.4 m, could be either horizontal or vertical) are given in Figure 4.3. Area required for constructed wetlands depends on the influent sewage quality and expected treatment (BOD removal, etc) is given in equation 1 (Vymazal et.al, 1998). Estimates show that to treat 1 MLD influent, area required is about 1.7 hectares. Figure 4.4 gives the design of wetlands to treat 1 MLD.
A = Qd(lnCo – lnCt) / KBOD
where A = area; Qd= ave flow (m3/day); Co & Ct = influent & effluent BOD (mg/L); KBOD = 0.10
For example to treat influent (raw sewage: BOD: 60-80) and anticipated effluent (with BOD 10), area required is about 1.7 to 2 hectares.