Bangalore city and Greater Bangalore: Bangalore is located in the Deccan plateau, toward the south east of Karnataka state extending from 12o49’5”N to 13o8’32”N in latitude and 77o27’29” E to 77o47’2”E in longitude (Figure 1). Spatially Bangalore urban area has spatially increased from 69 sq.km (1901), 161 sq.km (1981), 221 sq.km (2001) to 741 sq.km (2006, Greater Bangalore). The decadal (2001 to 2011) population increase in urban India is 31.8% and in Karnataka is 31.5%. However, Bangalore witnessed dramatic decadal increase of 44%. The population has increased from 4.3 Million (Bangalore city in 2001) to 8.4 Million (in 2011, Greater Bangalore) and the population density has increased from 7880 persons per square kilometre to over 11330 persons per square kilometre. Bangalore receives an annual average rainfall of 750-850 mm. Bangalore located on the ridge with the topography undulating from 700 m to about 962 m AMSL. Taking the advantage of undulating terrain, earlier administrators of the region constructed interconnected water bodies (lakes/tanks) to meet the domestic and irrigation demand in the region. This is evident from historical records, Ganga rulers (870 AD) had constructed Agara, Bellandur and Varthur lake systems to facilitate irrigation, agriculture and other needs (District Gazetteer of Bangalore, Chapter 4, 214-215,http://gazetteer.kar.nic.in/gazetteer/distGazetteer). Similarly earlier sensible rulers had constructed and managed many lakes [Mayisandra (1245 AD), Ramasandra (1340), Allalasandra (1544 AD), Tippasandra (Anekal taluk- 1614 AD), Tirumalapura (1766), Mattikere (1834)] to sustain irrigation, domestic and other anthropogenic needs. Integrated lake management through regular desilting activities were also reported at Ramasandra Lake (1515 AD). The interconnected lake system in Bangalore also aided in transporting storm water from the city centre to outskirts. Bangalore City (spatial extent in 1980’s is 161 sq.km) had about 274 lakes and was aptly known as city of lakes, which helped in recharging groundwater resources, moderating micro climate, supported local livelihood (fish, fodder, etc.), irrigation and domestic water demand apart from recreation facilities.
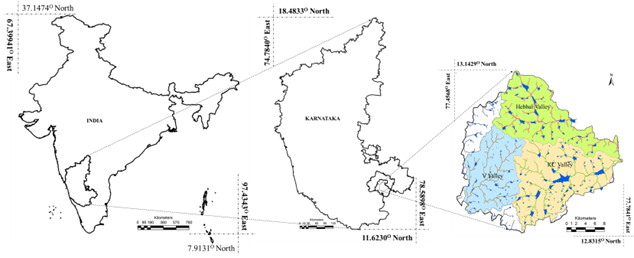
Figure 1: Location of KC-Valley (source: http://ces.iisc.ac.in/energy)
Bangalore landscape with undulating terrain forms three major watersheds (Figure 1) namely Koramangala and Challaghatta valley (K C Valley), Hebbal Valley and the Vrishabhavati Valley (V Valley). K&C valley is the largest catchment (255 sq. km.) in Bruhat Bengaluru (with spatial extent of 741 sq.km), followed by Hebbal valley (207 sq. km.) and Vrishabhavati valley (165 sq. km.). Interconnected lakes in KC and Hebbal valleys’ join at Nagondanahalli village (BBMP Ward 94 – Hagadur) and finally joins Dakshina Pinakin River. Interconnected lake systems in Vrishabhavathi valley joins Arkavathi River which is a tributary of the river Cauvery.
Bangalore is experiencing unprecedented rapid urbanisation and sprawl in recent times due to unplanned unrealistic concentrated developmental activities. This has led to large scale land cover changes with the serious environmental degradation, posing serious challenges to the decision makers in the city planning and management process involving a plethora of serious challenges such as loss of green cover and water bodies, climate change, enhanced greenhouse gases (GHG) emissions, lack of appropriate infrastructure, traffic congestion, and lack of basic amenities (electricity, water, and sanitation) in many localities, etc.
Urbanisation and loss of natural resources (wetlands and green spaces): Urbanisation is one of the demographic issues being investigated in the 21st century, understanding spatial patterns of changes in the land and advance visualization of growth is imperative for sustainable management of natural resources and to mitigate changes in climate. This would help the city planners in planning to mitigate the problems associated with the increased urban area and population, and ultimately build sustainable cities. Urbanisation during 1973 to 2016 (1005% concretization or paved surface increase) has telling influences on the natural resources such as decline in green spaces (88% decline in vegetation), wetlands (79% decline), higher air pollutants and sharp decline in groundwater table. Geo-visualisation of likely land uses in 2020 through multi-criteria decision making techniques (Fuzzy-AHP: Analytical Hierarchal Process) reveals calamitous picture of 93% of Bangalore landscape filled with paved surfaces (urban cover) and drastic reduction in open spaces and green cover. This would make the region GHG rich, water scarce, non-resilient and unliveable, depriving the city dwellers of clean air, water and environment (Source: Ramachandra T V and Bharath H. Aithal, 2016. Bangalore’s Reality: Towards unlivable status with unplanned urbanisation trajectory, Current Science (Guest Editorial)), 110 (12): 2207-2208, 25 June 2016)
2.1 K&C Valley and its importance: Upstream lake series description.
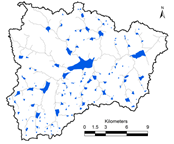
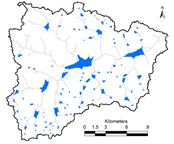
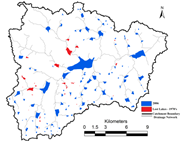
Koramangala Challaghatta Valley (KC Valley): Koramangala Challaghatta Valley (KC Valley) is located to the south eastern portion of Bangalore city (Figure 2.1), with a catchment of 290.44 sq. km. and drains to Dakshina Pinakini River. This region witnessed disappearance of 37.5% lakes during 1970 to 2016 due to various anthropogenic pressure. Figure 2 depicts the lake dynamics during 1970 (the Survey of India 1:50000 topographic sheets) to 2016 (remote sensing data- Google Earth, http://earth.google.com, Bhuvan, http://bhuvan.nrsc.gov.in). The catchment earlier consisted of 132 interconnected lakes (Survey of India Topographical sheet - 1970’s) and now (24th May 2016– Google earth) has about 96 lakes (46 in Bellandur lake catchment and 50 lakes connect to Varthur lake). Interconnected lake system consists of lake series of Hulimavu, Puttenalli, Halasuru, Kaikondralli, Kaggadasapura, Gunjuru-Chikka Bellandur, Kundalalli, Nalluralli. KC valley catchment has a population of 39.6 lakhs (Census of India, 2011) with a population density of 9600 persons per sq. km. The feeder to Bellandur lakes are a) Ulsoor lake series (north-west); b) Hulimavu lake series C) Sarakki lake series d) Beguru lake series e) Ambilipura lake series f) kaikondarahalli lake series and g) Doddaanekundu lake series.
As per the Survey of India, topographic maps (based on contours), the potential storage capacity of lakes in Bangalore (in 1800 with 1452 water bodies in 741 sq.km spatial extent) was ~ 35 TMC or 981 Mm3 (of which ~7.3 TMC in Bellandur (~18.67 Mm3) and Varthur (~6.10 Mm3). However, due to siltation, etc. the current storage volume is about ~5.5 (Bellandur) and ~1.61 Mm3 (Varthur). This necessitates de-silting of lakes that would help in enhancing the storage capacity as well as removal of accumulated nutrients (especially P, Phosphorous, lake sediment has high quantity) apart from enhancing recharging potential of groundwater resources.
Suggestion: De-silting of lakes has to be done on priority to enhance the storage capacity as well as to remove nutrient (N and higher amounts of P) enriched sediments.
Benefits: (i) Efficient harvesting of rainwater, (ii) recharging of groundwater resources, (iii) improvements in micro climate, (iv) removal of nutrient rich silt – could be used in agriculture.
|
|
|
1970’s (SOI Toposheet) |
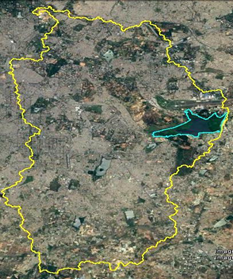
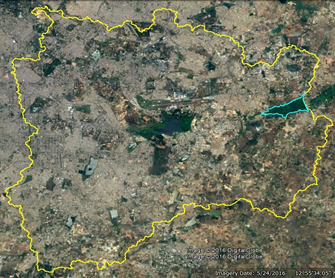
2016 |
Lost Lakes 1970’s to 2016 |
|
|
Remote sensing data (Google Earth, 24th May 2016) Source: EWRG, CES, IISc, |
Figure 2.1: Lake dynamics in K C Valley between 1970’s and 2016
-
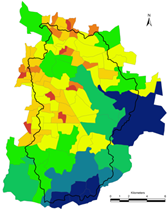
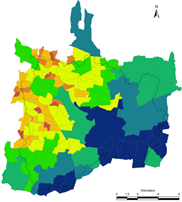
2.1.1 Bellandur Lake (at 12.9464° to 12.9277° N and 77.6420° to 77.6807° E) located in Agaram and Bellandur ward is the largest lake (366.89 hectares; 906 acres 25 guntas) in Bangalore city (BBMP) and spread across six villages (Table 1.1). Bellandur Lake has a catchment area of nearly 279 square kilometers with 46 cascading interlinked lakes. Bellandur lake catchment has a population of 34.8 lakhs (2011) with population density of 138 persons per square kilometre (Figure 2.2).
Table 1.1: Bellandur lake, break up and extent in each village
Taluk |
Hobli |
Village |
Survey number |
Area |
Acre |
Gunta |
Bangalore East |
Varthur |
Ammanikere Bellandur khane |
1 |
284 |
2 |
Bangalore South |
Begur |
Ibbaluru |
12 |
399 |
14 |
Bangalore South |
Begur |
Agara |
43 (A) |
166 |
15 |
Bangalore East |
Varthur |
Kempapura |
6 |
13 |
15 |
Bangalore East |
Varthur |
Belur |
2 |
40 |
15 |
Bangalore East |
Varthur |
Yamalur |
62 |
3 |
4 |
Total Area |
906 |
25 |
As per the RTC, www.bhoomi-karnataka.gov.in |
Spatial analysis using remote sensing data with geo-informatics (367.34 hectares) |
907 |
28.4 |
|
|
 Source: EWRG, CES, IISc, Source: EWRG, CES, IISc,
|
 |
 |
a) Bellandur |
b) Varthur |
Figure 2.2: Population density (persons/hectare) as per 2011 Census
Land use: Land use analyses carried using temporal (1970’s to 2016) remote sensing data shows an increase in built-up (paved surfaces; buildings, roads) from 5.4% (1973) to 92.3% (2016) with the decline in vegetation cover (58.0% to 4.1%), water bodies (4.3% to 1.4%) and other (open lands, agriculture) land uses (32.3% to 2.1%). Predication of likely land uses reveals that 94% of the catchment would be concretised by 2020.
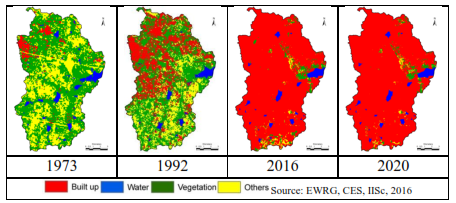
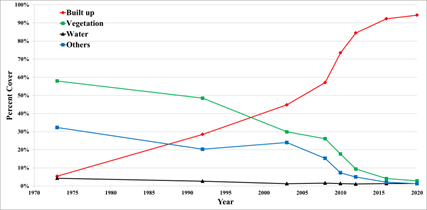
Figure 2.3: Land use dynamics in Bellandur Catchment
2.1.2 Varthur Lake (at 12.9407° to 12.9566° N and 77.67189° to 77.7476° E) is the second largest lake in Bangalore city (BBMP). The lake located in Varthur ward with a spatial extent of 180.8 hectares (447 acres 14 guntas) and spreads across Ammanikere Bellandur Khane village (Table 1.2). Varthur Lake has a catchment area of nearly 279 square kilometers with 96 cascading interlinked lakes. Varthur catchment has a population of 39.5 lakhs (2011) with population density of 97 persons per square kilometre (figure 2.2).
Figure 2.4: Land use dynamics in Varthur Catchment
Table 1.2: Varthur lake, break up and extent in each village
Taluk |
Hobli |
Village |
Survey number |
Area |
Acre |
Gunta |
Bangalore East |
Varthuru |
Ammanikere Bellandur khane |
319 |
447 |
34 |
As per the Akarabhandu, RTC, www.bhoomi-karnataka.gov.in; and recent survey by the revenue department |
As per spatial analysis - remote sensing data with geo-informatics (188.9 hectares) |
467 |
00 |
Land use analyses in Varthur Catchment using temporal (1970 to 2016) remote sensing data (Figure 2.4) shows an increase in built-up (paved surfaces: buildings, roads, etc.) from 3.8% (1973) to 89% (2016) with a sharp decline in vegetation (58.7% to 6.1%), water bodies (4.5% to 1.2%) and other (open lands, agriculture) land uses (33.1% to 5.0%).