|
|
| |
Annexure I
: MACROPHYTES: ESTIMATION OF SPATIAL EXTENT AND BIOMASS PRODUCTIVITY
Aquatic plants are an important component of lake ecosystems and are often regarded as indicators of lake environmental changes; they play an important role in maintaining the structure and function of lake ecosystems. Aquatic plants are the primary producers of aquatic ecosystems, being a kind of food source of many kinds of fish and other aquatic animals. They can regulate the lake water body, degrade various pollutants, and improve the transparency. In addition, aquatic plants can provide habitat to many organisms and increase the spatial niche of aquatic ecosystems. Therefore, it is important to know the distribution of aquatic plants and their communities to analyze the status of aquatic plants in the lake area. Biomass estimation of wetland plants plays an important role in understanding dynamic changes of the wetland ecosystem.
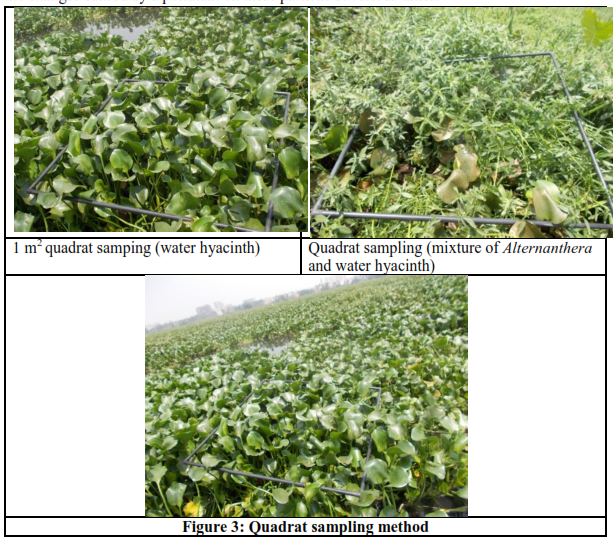
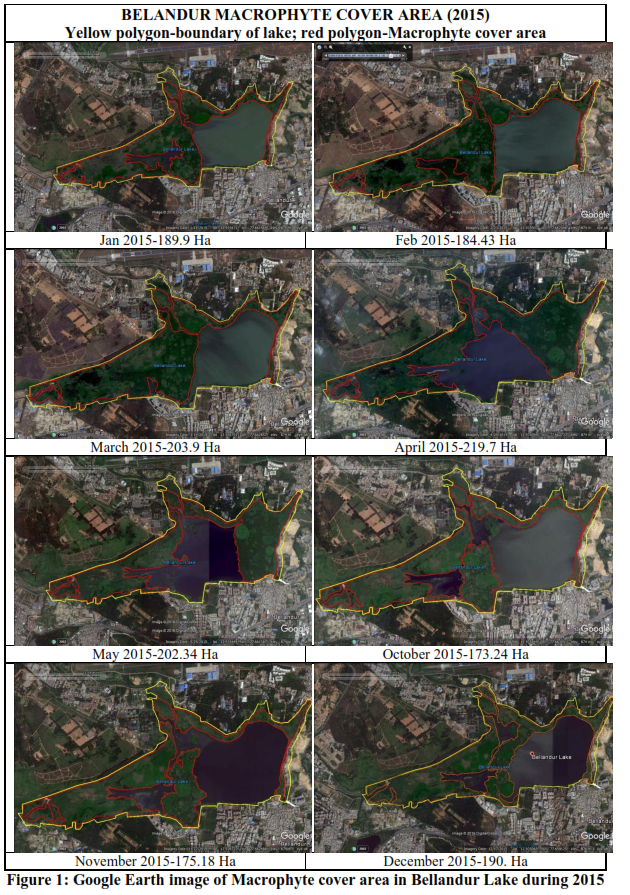
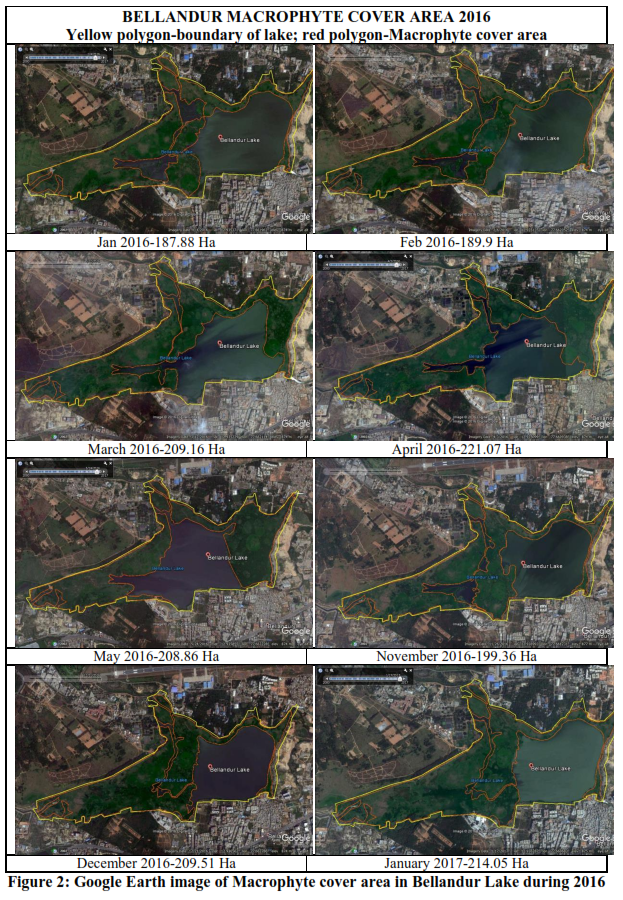
Biomass estimation was undertaken through quadrat method (1mx1m). Spatial extent was assessed using temporal remote sensing data. Data analyses reveal that spatial extent varies from 173.24 ha (Oct 2015 and 180.00 ha in oct 2016) to 219.17 ha (April 2015, 221.07 ha in April 2017). The productivity ranges from 11-33 t /ha (in fresh infested regions, constitute about 45% of spatial coverage), 70-80 t/ha (in the moderate cover regions, constitute about 35% of spatial coverage) and 120 t/ha (in densely packed regions, constitute about 20% of spatial coverage).
Introduction
Aquatic macrophytes is a term given to a vast category of aquatic vascular plants. Plant species normally found growing in wetlands, either in or on the water, or where soils are flooded or saturated long enough for anaerobic conditions to develop in the root zone are called as macrophytes (Cowardin et.al 1979). The aquatic macrophytes occur mainly in the shallow region of lakes ponds, pools, marshes streams and rivers etc. They belong to following 3 categories on the basis of their habit:
- Submerged macrophytes: Largely or completely submerged plants, the roots may or may not be present (Ceratophyllum, Hydrilla, vallisneria etc)
- Emergent macrophytes: Plants not submerged in water, further subdivided into two (a) erect leaved emergent plants: rooted plants with principle photosynthetic surfaces projecting above the water (Typha, Scirpus etc) (b) floating leaved emergent plants: rooted plants with floating leaves (Nymphaea, Nelumbos etc)
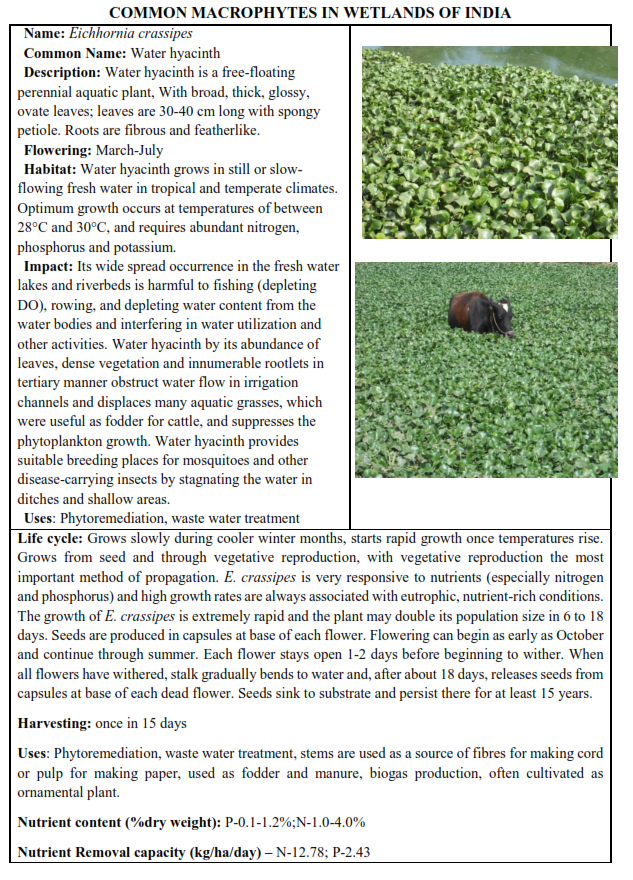
- Floating macrophytes: Entire plant will be floating on the water surface (Eichhornia, Lemna, Pista etc)
Macrophytes are of considerable ecological and economic importance. They contribute significantly to the productivity of water bodies; mobilize mineral elements from the bottom sediments and provide shelter to aquatic macro-invertebrates and fishes. They also respond to changes in water quality and have been used as indicators of pollution. When there is enough room for colonization and abundant availability of nutrients, macrophytes show a high growth rate. They assimilate nutrients directly into their tissues. Due to these they were used to solve eutrophic problems of freshwater bodies and to remove pollutants.
Methods
Estimation of fresh biomass (wet weight) of macrophytes: Macrophyte biomass per unit area was found by random sampling method. Macrophyte samples (triplicates) were collected randomly from 1 m2 quadrats of lake. All the macrophyte samples falling under 1 m2 quadrat were removed and fresh weight (biomass) was determined after draining the water. The coverage area of macrophyte in the Lake during different months of a year was estimated by mapping using Google Earth. The productivity of macrophyte coverage area was calculated by multiplying fresh biomass per m2 and total coverage area. Quadrat method of sampling is followed (50 cmX50cm or 1mX1m for emergent).
Vegetation mapping: This is done 1) to calculate total macrophytic biomass of different species in a water body 2) to understand the distribution pattern of vegetation 3) to monitor the changes caused by a pollutant on these patterns at various times.
-
Treatment of samples: Immediately after collection wash the plants to remove adhered soil, epiphytes etc. Drain out the excess water after washing. Take the fresh weight of sample. Transport the samples to the lab in polythene bags.
-
Biomass estimation: After determining fresh weight of the samples, keep the samples in hot air oven at 105°C for 24 hrs for the determination of dry weight. Biomass is usually estimated as dry matter per unit area.
-
Macrophyte cover: Macrophyte cover of Bellandur Lake was estimated for the years 2015 and 2016 by using Google Earth. The macrophyte cover was higher during the summer season (April). It covered 60% of the lake area during this season.
Literatures regarding Biomass of Water hyacinth: Grown in warm, enriched domestic sewage Eichhornia produces over 17.8 tonnes of wet biomass per hectare per day. Growth rate studies suggest that annual production rates of 212 metric tons of dried plant material per hectare (Wolverton and McDonald, 1976). A hectare of water hyacinths fed on sewage nutrients can yield 0.9-1.8 tonnes of dry plant material per day. DeBusk et al. (1981) have reported a yield of 10.4 g (dw) m-2 d-l in natural flowing waters in Florida (U.S.A.) for water hyacinth maintained at a density of 500 g (dw) m2 by weekly harvesting, equivalent to 8.5 kg (fw) m2 for a six months period from April to September. We calculated for the corresponding period in the southern hemisphere, October to March, at a density of 10 kg (fw) m2, and a harvest every three weeks (average) a productivity of 202 g (fw) m-2, roughly equivalent to 11.7 g (dw) m2 d-l. According to DeBusk et al. (1981) the increase in water hyacinth productivity with biomass level has a maximum at a density of about 20 kg (fw) m2.
E. crassipes specific growth rates, calculated from data shown in Table 1, range within 15.7–29.4 g (dry wt.) m−2 d−1. These results compare well with values reported for plants growing in the warm waters of middle Paraná River (Fitzsimons & Vallejos, 1986). Other studies reported growth rates around 5 g (dry wt.) m−2 d−1 and up to 147 g (dry wt.) m−2 d−1, for cold and warm weather conditions, respectively (Yount & Crossman, 1970; De Busk et al., 1981; Reddy & De Busk, 1985; Cassabianca et al., 1992).
In growth rate studies water hyacinth were observed to produce 250-400 kg of dry plant material per acre per day when grown in nutrient enriched media such as domestic sewage. Based on this growth rate and surface area coverage of 100 tons per acre of wet plant material, 4 acres of water hyacinth could remove all nutrients from waste of 5000 people when harvested at a rate of one-third the surface area every two weeks. (National Academy of Sciences (U.S.)
Productivity of water hyacinth has been reported in many ways, making it difficult for inter comparison of the results. Cornwell et al. (1977) reported that the water hyacinth cultured in sewage effluent covered the pond surface in about 8 weeks (2 Apr.-27 May 1972). The calculated area doubling time was found to be 6.2 d. The area covered by water hyacinth growth is controlled by wind and wave action and the degree of compactness of the plants. Water hyacinth can grow in a vertical as well as horizontal direction, often reaching a height of 100 cm or more in dense stands. Wolverton and McDonald (1979a) observed a linear relationship between total length of plant and standing crop for waterhyacinth cultured in sewage effluent. Under normal conditions, loosely packed water hyacinth can cover the water surface at relatively low plant densities (10 kg wet wt m-2), and can reach a maximum density 50 kg wet wt m-" (Center & Spencer, 1981), before growth ceases.
RESULTS:
Biomass of fresh macrophytes
Densely populated region (multi-tier) about 1’ |
͠ 120 tons/Ha (15-20% lake surface) |
Moderately covered regions |
70-80 (30-40% lake surface) |
New spread regions |
11-33 t/ha (40-45% of spread) |
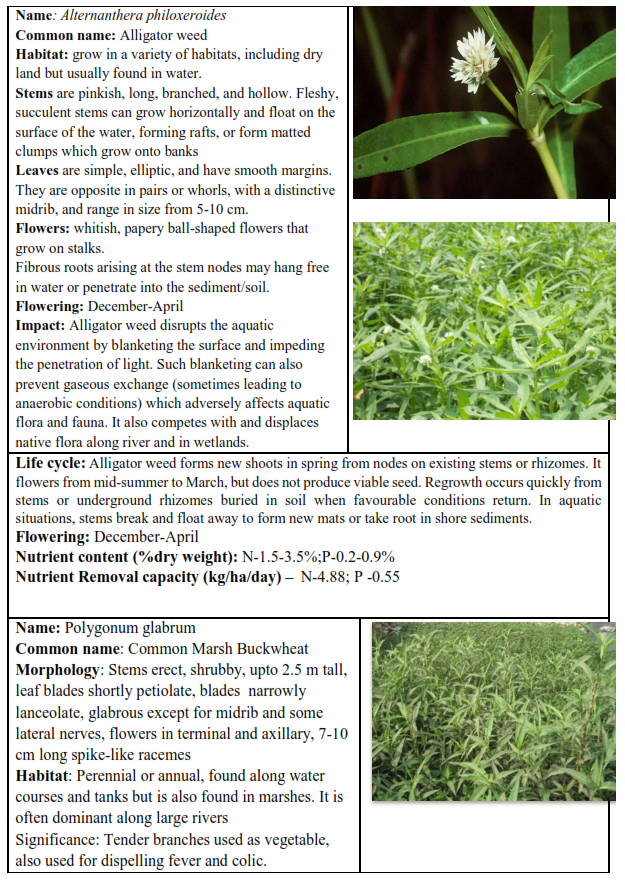
Biomass of mixed macrophyte sample (water hyacinth+ Alternanthera): 70-85 t/ha
Month |
Macrophytes cover area during 2015(Hectares) |
Macrophytes cover area during 2016(Hectares) |
Jan |
189.9 |
187.88 |
Feb |
184.43 |
189.9 |
March |
203.9 |
209.16 |
April |
219.7 |
221.07 |
May |
202.34 |
208.86 |
October |
173.24 |
180.00 |
November |
175.18 |
199.36 |
December |
190.79 |
209.51 |
Table1: Macrophyte cover area of Bellandur Lake during the year 2015 and 2016
References
Bill Wolverton and Rebecca C.McDonald (1976) Dont waste waterweeds, New Scientist 12 August 1976; pp 318-320.
National Academy of Sciences (U.S.) Aquatic Weed Management: Some Prospects for the Sudan and the Nile Basin : Reports of a Workshop Held 24-29 November 1975, Khartoum, Sudan
|
T.V. Ramachandra
Centre for Sustainable Technologies, Centre for infrastructure, Sustainable Transportation and Urban Planning (CiSTUP), Energy & Wetlands Research Group, Centre for Ecological Sciences, Indian Institute of Science, Bangalore – 560 012, INDIA.
E-mail : cestvr@ces.iisc.ac.in
Tel: 91-080-22933099/23600985,
Fax: 91-080-23601428/23600085
Web: http://ces.iisc.ac.in/energy
Durga Madhab Mahapatra
Energy & Wetlands Research Group, Centre for Ecological Sciences, Indian Institute of Science, Bangalore – 560 012, INDIA.
E-mail: durgamadhab@ces.iisc.ac.in
Vinay S
Energy & Wetlands Research Group, Centre for Ecological Sciences, Indian Institute of Science, Bangalore – 560 012, INDIA.
E-mail: nvjoshi@ces.iisc.ac.in
Sincy V
Energy & Wetlands Research Group, Centre for Ecological Sciences, Indian Institute of Science, Bangalore – 560 012, INDIA.
E-mail: sincy@ces.iisc.ac.in
Asulabha K S
Energy & Wetlands Research Group, Centre for Ecological Sciences, Indian Institute of Science, Bangalore – 560 012, INDIA.
E-mail: asulabha@ces.iisc.ac.in
Sudarshan P. Bhat
Energy & Wetlands Research Group, Centre for Ecological Sciences, Indian Institute of Science, Bangalore – 560 012, INDIA.
E-mail: sudarshan@ces.iisc.ac.in
Bharath H. Aithal
Energy & Wetlands Research Group, Centre for Ecological Sciences, Indian Institute of Science, Bangalore – 560 012, INDIA.
E-mail: bharath@ces.iisc.ac.in
Citation: Ramachandra T V, Durga Madhab Mahapatra, Vinay S, Sincy V, Asulabha K S, Sudarshan Bhat, Bharath H. Aithal, 2017. Bellandur and Varthur Lakes Rejuvenation Blueprint, ENVIS Technical Report 116, Environmental Information System, CES, Indian Institute of Science, Bangalore 560012.
|