|
|
Lakes: Contemporary Relevance
Lakes (wetlands) have been aiding in recharging groundwater resources, moderating micro climate, supported local livelihood (fish, fodder, etc.), irrigation and domestic water demand apart from recreation facilities. Washing, household activities, vegetable cultivation and fishing are the regular activities in the lake for livelihood. Multi-storied buildings have come up on some lake beds intervening the natural catchment flow leading to sharp decline and deteriorating quality of water bodies. Unauthorised construction in valley zones, lakebeds and storm water drains highlight the weak and fragmented governance. This is correlated with the increase in unauthorized constructions violating town planning norms (city development plan) which has affected severely open spaces and in particular water bodies. Problems encountered by Bangaloreans due to mismanagement of water bodies in Bangalore are:
- Recurring episodes of fish mortality: Large-scale fish mortality in recent months further highlights the level of contamination and irresponsible management of water bodies. Sustained inflow of untreated sewage has increased the organic content beyond the threshold of remediation capability of respective water bodies. Increasing temperature (of 34 to 35 °C) with the onset of summer, enhanced the biological activities (evident from higher BOD and Ammonia) that lowered dissolved oxygen levels leading to fish death due to asphyxiation.
- Floods: Conversion of wetlands to residential and commercial layouts has compounded the problem by removing the interconnectivities in an undulating terrain. Encroachment of natural drains, alteration of topography involving the construction of high-rise buildings, removal of vegetative cover, reclamation of wetlands are the prime reasons for frequent flooding even during normal rainfall post 2000.
- Heat island: Surface and atmospheric temperatures are increased by anthropogenic heat discharge due to energy consumption, increased land surface coverage by artificial materials having high heat capacities and conductivities, and the associated decreases in vegetation and water pervious surfaces, which reduce surface temperature through evapotranspiration. An increase of ~2 to 2.5 ºC during the last decade highlights implication of explosive urban growth on local climate, necessitating appropriate strategies for the sustainable management of natural resources.
- Ecosystem goods and services: Valuation of tangible benefits (fish, fodder, drinking water, etc.) reveal that wetlands provides goods worth Rs. 10500 per hectare per day (compared to Rs 20 in polluted lake), and sustains the local livelihood. This also emphasises the need for rejuvenation and sustainable management of water bodies.
3.1 Present status of Bellandur Lake
Bellandur Lake is being subjected to increased anthropogenic stress due to sustained inflow of untreated domestic sewage and industrial effluents, dumping of solid waste, encroachment of wetlands and connecting drains (figure 3.1).
In order to understand the pollution status of Bellandur lake, sampling (water, slush, sediment, biota - phytoplankton, zooplankton, macrophytes) was carried out at 70 locations (Figure 3.2 and Figure 3.3) during 8-14th April, 2016 with the help of MEG (Madras Engineering Group), Indian Army. The analyses of samples include physico-chemical (water temperature, pH, electrical conductivity, TDS, turbidity, DO, nitrate, orthophosphate, turbidity, total alkalinity, calcium and magnesium hardness, total hardness, chlorides, COD, BOD, sodium and potassium) as well as biological characterisation (phytoplankton, zooplankton, nacrophytes). The physico-chemical characteristics of Bellandur Lake revealed that the lake has higher amounts of nutrients and ionic components with the dissolved oxygen levels were equal to zero which, indicate pollution/sewage entry into the lake. Thus, Bellandur lake falls under Class E as per CPCB’s Classification of Inland Surface Water. Pollution tolerant phytoplankton and zooplankton population were present in the Bellandur lake water, which indicates pollution as well as eutrophic conditions. Development activities consequent to urbanization around Bellandur Lake had degraded its water quality and enhanced frothing which has become a threat to public health and its water is completely unfit for human use. Also, there is a decline in the biodiversity in the lake.
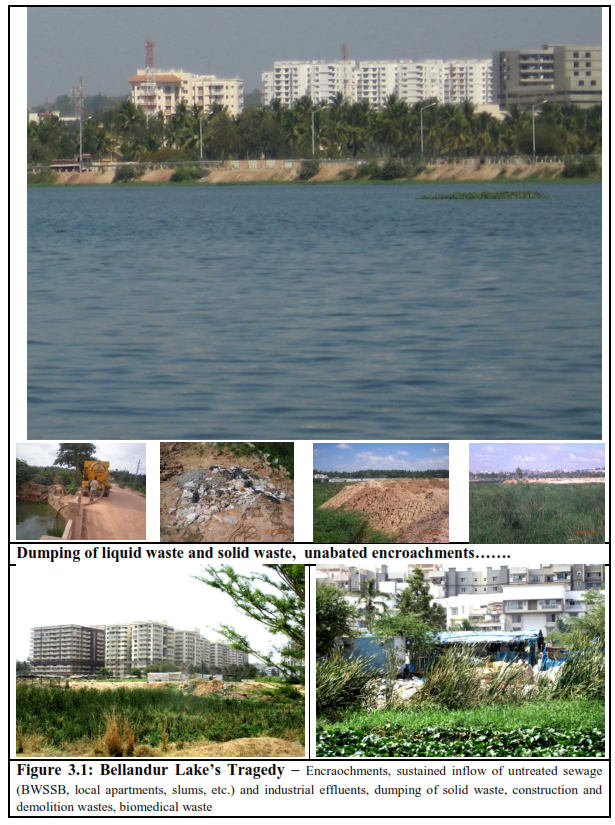
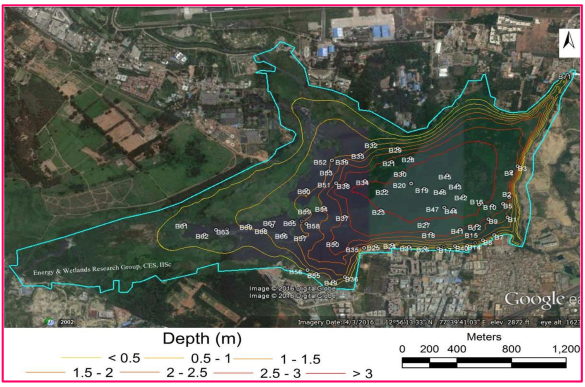
Figure 3.2: sampling points in Bellandur lake
The analysis of physico- chemical parameters like water temperature; pH; total dissolved solids; electrical conductivity; turbidity; dissolved oxygen; chemical oxygen demand; biochemical oxygen demand; total alkalinity; chloride; total hardness; calcium; magnesium; nitrate; orthophosphate; sodium and potassium of lake samples collected from Bellandur lake were done according to the standard protocol.
The analysis of physical and chemical variables in the water of Bellandur lake (based on PCA: Principal Component Analysis and Cluster analysis) reveals the existence of three groups (figure 3.4).
- Cluster 1 (highly polluted sites) includes sampling sites like 49, 51, 54, 59, 61, 63, 64, 65, 66, 67, 68, 69 and 70. This group include sites that have slightly alkaline conditions with low depth and DO levels (= 0 mg/l). It is found that other parameters like water temperature, TDS, EC, turbidity, BOD, COD, chloride, total hardness, calcium, magnesium, nitrate, ortho-phosphate, sodium and potassium are very high as these sites have direct waste water sewage inlets.
- Cluster 2 (moderately polluted sites) includes 1, 2, 3, 4, 5, 8, 9, 10, 11, 12, 13, 14, 15, 16, 17, 18, 19, 20, 21, 22, 23, 24, 25, 27, 30, 55 and 56. In the case of group 2, pH, DO and total alkalinity are higher.
-
Cluster 3 (less polluted sites) has sites such as 7, 26, 28, 29, 31, 32, 33, 34, 35, 36, 37, 38, 39, 40, 41, 42, 43, 44, 45, 46, 47, 48, 50, 52, 53, 57, 58, 60 and 71. Here, depth is high and all the other parameters like water temperature, TDS, EC, turbidity, BOD, COD, chloride, total hardness, calcium, magnesium, nitrate, sodium and potassium are very low.
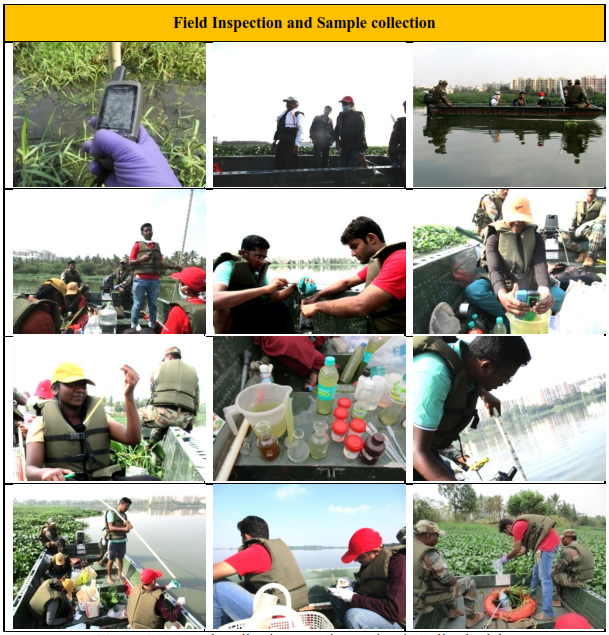
Figure 3.3: Sample collection at various points in Bellandur lake
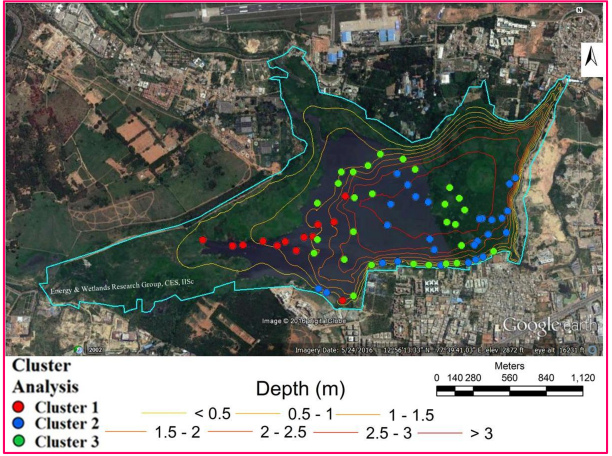
Figure 3.4: Bellandur lake water quality status - based on multivariate analysis
3.2 Present status of Varthur Lake
Sampling was carried out during 4-7th April (2016) in Varthur lake (Figure 3.5) along with MEG, Indian Army. The water samples were collected from 47 different sites and analyzed its water quality as well as planktons (Biomonitoring). Figure 3.6.1 depicts various anthropgenic stress in the Lake, while Figure 3.6.2 portrays the consequences of mismanagement. The physico-chemical analysis revealed that Varthur Lake receives nutrients, organic and ionic components which indicated pollution of the lake. This led to organic matter accumulation at the lake bottom, finally, leading to hypoxic/anoxic conditions. Thus, Varthur Lake falls under Class E as per CPCB’s Classification of Inland Surface Water. Chlorophyceae were found to be dominant in Varthur Lake among phytoplanktons whereas Protozoa and Rotifera were dominant among zooplanktons. Many pollution tolerant phytoplankton and zooplankton population were present in the Varthur lake water, indicating eutrophic conditions.
Figure 3.5: sampling locations in Varthur lake
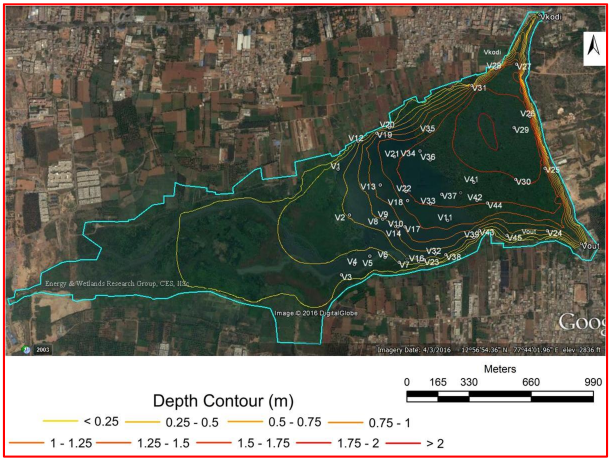
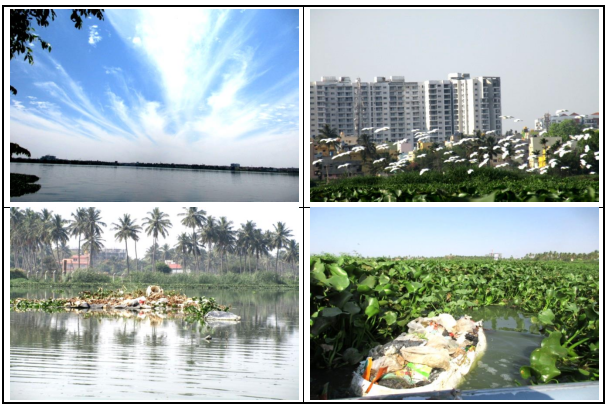
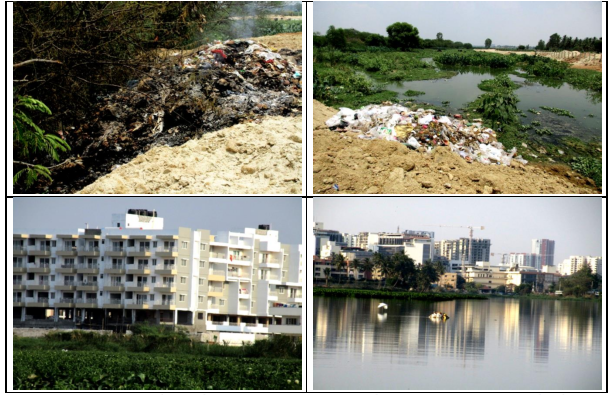
Figure 3.6.1: Varthur Lake –outcome of fragmented governance of common lands
The analysis of physical and chemical variables in the water of Varthur lake based on sampling at 47 sampling sites in Bangalore and subsequent multi-varaiate analysis (PCA and cluster) reveal of two clusters (figure 3.7).
-
Cluster 1 includes sampling sites like 24, 25, 27, 28, 29, 30, 32, 33, 36, 40, 41, 44, 26, 31, 34, 35, 37, 38, 39, 42, 43, 46 and 47 influenced by parameters like water temperature, TDS, EC, COD, total alkalinity, total hardness, magnesium, sodium and depth. These points are near to middle and outlet of the lake but are highly stressed due to anthropogenic activities with solid waste dumping, untreated sewage entry, dumping of building debris etc. Cluster 1 includes moderately polluted points.
-
Cluster 2 has sites such as 1, 2, 3, 4, 5, 6, 7, 8, 9, 10, 11, 12, 13, 14, 15, 16, 17, 18, 19, 20, 21, 22, 23 and 45 with high turbidity, pH, DO, BOD, calcium, chlorides, potassium, nitrate and ortho-phosphate, These points receive untreated sewage water daily thus, lot of suspended particles float at the lake surface. Suspended particles along with high algal and bacterial population contribute to high turbidity values. DO levels are high due to increased photosynthetic activities by algae. High DO levels help in increased rate of nitrification process as a result of which, nitrates in large amounts releases to lake water. With increased amount of ortho-phosphate and nitrate, macrophytes and algae grow well. Cluster 2 includes highly polluted points.
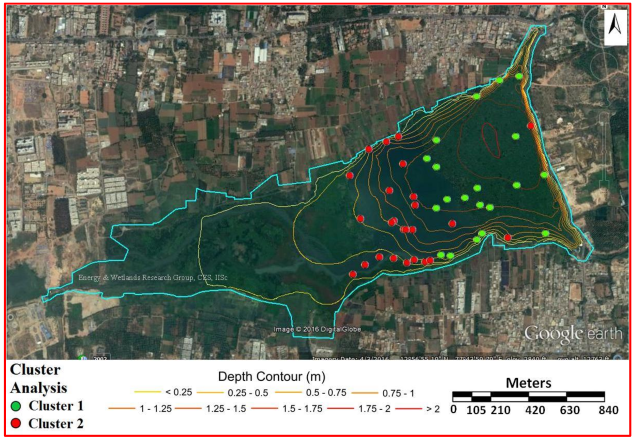
Figure 3.7: the status of Varthur lake based on multi-variate analysis
Table 3.1 highlights the level of contamination – nutrient enrichment, heavy metal contamination, etc.
Table 3.1: key water quality parameters observed in the two lakes over past several years
Parameter |
Bellandur Lake |
Varthur Lake |
Studies referred to |
pH |
6.8-8.4 |
6.9-8.2 |
(Ramachandra et al., 2008, 2009, 2013; 2015, Mahapatra et al., 2011, 2010; 2014; Mahapatra, 2015; Ramachandra et al., 2015). |
Total Bacterial Count (cells/ml) |
104-107 |
105-107 |
Dissolved Oxygen (mg/L) |
0 to 3 |
0-5 |
BOD (5-day 20degC) (mg/L) |
25 to 180 |
32-175 |
COD (mg/L) |
44-330 |
51-280 |
Cadmium (mg/L) |
0.03-0.76 |
0.04-0.25 |
Lead (mg/L) |
0.01-1.77 |
0.04-2.84 |
Chromium (+6) (mg/L) |
0.02-0.67 |
0.014-1.66 |
Nickel (mg/L) |
0.002-0.41 |
0.026-1.89 |
Copper (mg/L) |
0.01-0.461 |
0.02-0.46 |
From the above, it is clear that both the lakes are severely polluted, and have been in this condition for several years
3.3 Heavy Metals in Bellandur and Varthur Lakes:
The presence of heavy metals in the Bellandur and Varthur lakes are indicative of contamination of industrial and untreated municipal wastewater. Heavy metals in the sediment materials are well within the metal levels found in cultivable lands in India and within the critical limits as per Awasthi et al., 2000 (Cd: 3- 6 mg/kg; Pb 250-500 mg/kg; Cu 135-270 mg/kg and Ni 75-150 mg/kg). Values are Cd 7 mg/kg; Co 8 mg/kg; Cu 68 mg/kg; Fe 20 g/kg; Mn 140 mg/kg; Ni 26 mg/kg, Pb 7 mg/kg and Zn 106 mg/kg (table 3.2).
Table 3.2: Elemental and nutrient analysis (heavy metals and essential trace elements)
Sl no. |
Description |
Measuring units |
SLUSH |
SEDIMENT |
1 |
Bulk Density |
kg/cum |
500 |
1700 |
2 |
Organic Carbon |
% |
18 |
8 |
3 |
Nitrogen |
% |
3 |
0.35 |
4 |
Phosphorous |
% |
2.5 |
0.28 |
5 |
Cadmium |
mg/kg |
7 |
2.4 |
6 |
Cobalt |
mg/kg |
8 |
5 |
7 |
Copper |
mg/kg |
68 |
30 |
8 |
Iron |
mg/kg |
20935 |
13580 |
9 |
Manganese |
mg/kg |
140 |
98 |
10 |
Nickle |
mg/kg |
26 |
20 |
11 |
Lead |
mg/kg |
7 |
6.5 |
12 |
Zinc |
mg/kg |
106 |
45 |
13 |
Sodium |
mg/kg |
2175 |
2075 |
14 |
Potassium |
mg/kg |
7750 |
6025 |
15 |
Calcium |
mg/kg |
581 |
608 |
16 |
Magnesium |
mg/kg |
433 |
1452 |
The lake water samples were found to have a slightly high values of heavy metals (Cd: 0.55 mg/L; Cr: 0.4 mg/l; Pb 1.35 mg/l; Cu 0.21 mg/l and Ni 0.27 mg/l) value than the permissible levels (Cd : 0.01 mg/L; Cr: 0.1 mg/l; Pb 0.5 mg/l; Cu 0.2 mg/l and Ni 0.2 mg/l). The vegetable samples grown on these wastewater towards the lower reaches of the Varthur lake also showed high heavy metal content (Cd: 8.5 -11 mg/kg; Cr: 51-131 mg/kg; Pb 24-147 mg/kg; Cu 89-323 mg/ka and Ni from 0.5-91 mg/kg) compared to the Indian safe limits (Cd: 1.5 mg/kg; Cr: 20 mg/kg; Pb 2.5 mg/kg; Cu 30 mg/kg and Ni 1.5 mg/kg) that is alarming.
3.4 SEDIMENTS: Nutrient analyses and valuation of the quantum of Nutrients
The elemental analysis of the lake systems reveal high nutrient potential of the sedimentary material with organic matter (14 – 31%); C (8-18%) N (0.35 – 35%); P (0.28 – 2.5 %) and K (0.6 -0.7%). This concentration of nutrients in the sedimentary material with other trace and essential mineral nutrients are of superior quality and can be used directly as organic manures or as bio-fertilisers in the agricultural fields. In terms of mass percentage of the nutrients and from the available market values of the chemical fertilisers sold in the country, the priced for NPK have been derived and is provided in table 3.2. The worth of the total sedimentary material as nutrient laden supplementary dose to the agricultural lands amounts to Rs 15, 000 crores that can fertilise millions of acres of land.
Table 3.3: Estimation of sedimentary materials and economics
Sl no |
Description |
Unit of measurement |
BELLANDUR LAKE |
VARTHURU LAKE |
1 |
Surface Area |
hectares |
367.34 |
|
190.78 |
|
2 |
Water storage capacity (historical) |
M.cum |
18.67 |
|
6.10 |
|
3 |
Current water storage volume |
M.cum |
5.50 |
|
1.61 |
|
|
SLUSH |
SEDIMENT |
SLUSH |
SEDIMENT |
4 |
Volume |
M.cum |
6.56 |
6.60 |
0.62 |
3.87 |
5 |
Weight |
M.Ton |
3.28 |
11.22 |
0.31 |
6.58 |
|
|
|
|
|
|
|
6 |
Bricks |
Numbers |
820045125 |
2806038275 |
77750000 |
1644325000 |
7 |
Gross Income from Bricks |
Crore Rupee |
410 |
1403 |
39 |
822 |
|
|
|
|
|
|
|
8 |
Number of Truck Loads |
Number |
131207.22 |
448966.12 |
12440.00 |
263092.00 |
9 |
Gross Income as Sand |
Crore Rupee |
328.02 |
1122.42 |
31.10 |
657.73 |
|
|
|
|
|
|
|
10 |
Organic Carbon |
Ton |
590432 |
897932 |
55980 |
526184 |
11 |
Nitrogen |
Ton |
98405 |
39285 |
9330 |
23021 |
12 |
Phosphorous |
Ton |
82005 |
31428 |
7775 |
18416 |
13 |
Cadmium |
Ton |
23 |
27 |
2 |
16 |
14 |
Cobalt |
Ton |
26 |
56 |
2 |
33 |
15 |
Copper |
Ton |
223 |
337 |
21 |
197 |
16 |
Iron |
Ton |
68671 |
152424 |
6511 |
89320 |
17 |
Manganese |
Ton |
459 |
1100 |
44 |
645 |
18 |
Nickel |
Ton |
85 |
224 |
8 |
132 |
19 |
Lead |
Ton |
23 |
73 |
2 |
43 |
20 |
Zinc |
Ton |
348 |
505 |
33 |
296 |
21 |
Sodium |
Ton |
7134 |
23290 |
676 |
13648 |
22 |
Potassium |
Ton |
25421 |
67626 |
2410 |
39628 |
23 |
Calcium |
Ton |
1906 |
6824 |
181 |
3999 |
24 |
Magnesium |
Ton |
1420 |
16297 |
135 |
9550 |
25 |
Organic Matter |
Ton |
1015544 |
1544443 |
96286 |
905036 |
|
|
|
|
|
|
|
26 |
Gross Income from Nitrogen |
Crore Rupee |
59.0 |
23.6 |
5.6 |
13.8 |
27 |
Gross Income from Phosphorous |
Crore Rupee |
287.0 |
110.0 |
27.2 |
64.5 |
28 |
Gross Income from Potassium |
Crore Rupee |
43.2 |
115.0 |
4.1 |
67.4 |
|
Gross Income from Organic Carbon |
Crore Rupee |
4569.9 |
6950.0 |
433.3 |
4072.7 |
|
|
|
|
|
16846.2 |
|
33 |
Cost per kg |
Rupee |
30.24 |
12.83 |
30.24 |
12.83 |
35 |
Rebated Amount per kg |
Rupee |
25 |
12 |
25 |
12 |
34 |
Gross Amount @ 50% yeild |
Crore Rupee |
4100 |
6734 |
389 |
3946 |
|
Gross Amount @ 50% yeild |
|
10835 |
4335 |
|
Gross Amount @ 50% yeild |
|
15170 |
3.5 Depth: Bathymetric Survey |
Bellandur Lake: Bathymetric study involves measuring relative lake depth / sounding at certain intervals using various techniques and instruments. In Bellandur Lake, depth measurements were carried out using graduated staff associated with GPS for position of measurement. At every position of sounding, dual measurements were made i.e., depth of water and depth of slush. Figure 3.8 depicts the position of depth measurements in Bellandur Lake. In order to quantify the sediment deposits in the lake, historical depths need to be known. The Survey of India topographic sheets of 1: 50000 scale were used for understand earlier depth supplemented with the field interviews with the local fishermen (elderly). Depth of water varies from as low as 10 cm near the inlets to over 350 cm near the outlet, and depth of slush varies between 50 cm to 225 cm. Water storage capacity of Belladuru lake now is 5.5 Million cubic meters, and volume of silt deposit is nearly 6.56 Million cubic meters. Table 3.4 lists describes the quantity of silt, sediment, water etc. in the lake. Value of silt deposited in the lake ranges from 1122 crores (as sand) to 1403 crores (moulded to bricks).
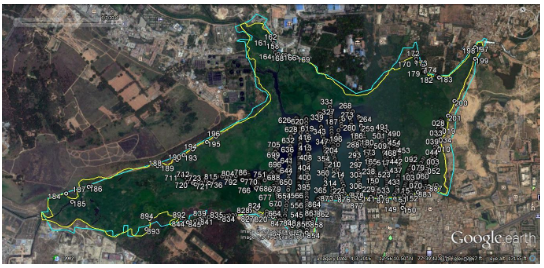
Figure 3.8: Depth measurement locations (Bellandur Lake)
(Lake Boundary: Cyan, Current Water level: Yellow, depth measurements: Points)
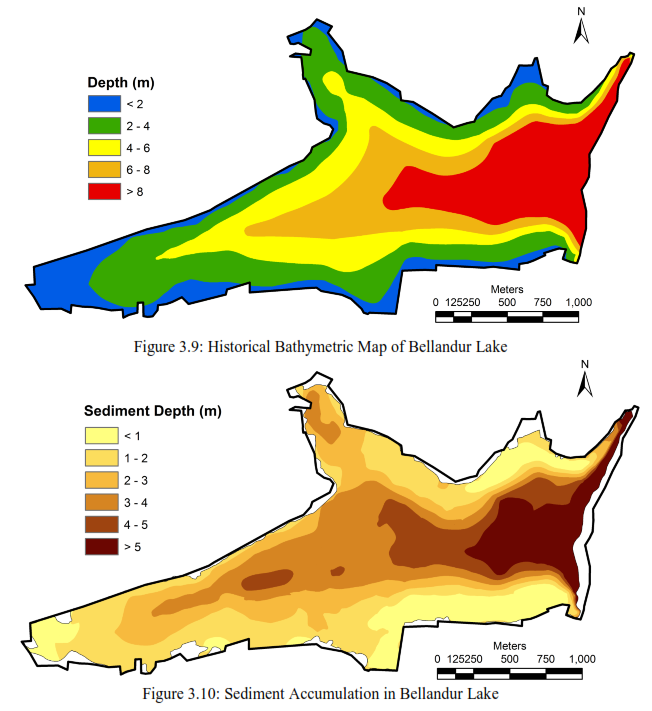
Contours were used in order to develop historical bathymetric map of Bellandur lake. The analysis of contours shows that Bellandur Lake had a capacity of 18.67 Million cubic meters. Based on the bathymetric survey through sounding and depth profile from the topographic sheets, sediment volume in the lake was quantified (Figure 3.9 and 3.10). Volume of sediment present in the lake is about 6.60 Million cubic meters (Table 3.4). If the available sediment is used to mold burnt bricks, it would yield in gross income of rupees 1403 crores in Bellandur lake, and if the sediment is used as sand, gross income of rupees 1122 crores can be obtained.
Table 3.4: Summary of Bathymetric results
Slno |
Description |
Quantity |
1 |
Surface area of Lake (hectares) |
367.3 |
2 |
Storage Volume (Million cubic meters) |
18.67 |
3 |
Current Storage Volume of Water (Million cubic meters) |
5.50 |
4 |
Volume of Slush deposit (Million cubic meters) |
6.56 |
5 |
Volume of Sediment deposits (Million cubic meters) |
6.60 |
6 |
Bulk Density of Sediment (kilograms per cubic meter) |
1700 |
7 |
Weight of Sediment present in the lake (Million Tonne) |
11.22 |
Using Sediment for moulding Burnt Brick |
8 |
Average Weight of Burnt Brick (kilograms) |
4 |
9 |
Number of Bricks that can be manufactured using the sediment (Million) |
2806 |
10 |
Cost of one Brick (Rupee) |
5.00 |
11 |
Revenue generated by manufacturing Burnt Bricks (Crore Rupee) |
1403 |
Using Sediment For Construction |
12 |
Capacity of One truck (Tonne) |
25 |
13 |
Number of Truck loads (thousands) |
449 |
14 |
Cost of Low grade Sand for each truck load (Rupee) |
25000 |
15 |
Revenue Generated from Sediment as sand (Crore Rupee) |
1122 |
Varthur Lake: Figure 3.11 depicts the position of depth measurements in Varthur Lake. Based on the bathymetric survey through sounding and depth profile from the topographic sheets, sediment volume in the lake was quantified (Figure 3.12 and 3.13). Depth of water varies from as low as 10 cm near the inlets to over 220 cm near the outlet, and depth of slush varies between 50 cm to 150 cm. Current water storage capacity of Varthur lake is 1.61 Million cubic meters, and volume of silt deposit is nearly 0.62 Million cubic meters. Volume of sediment present in the lake is about 3.87 Million cubic meters. Table 3.5 lists the quantity of silt, sediment, water etc. in the lake. Value of the accumulated silt ranges from 658 crores (sand) to 822 crore rupees moulded to bricks).
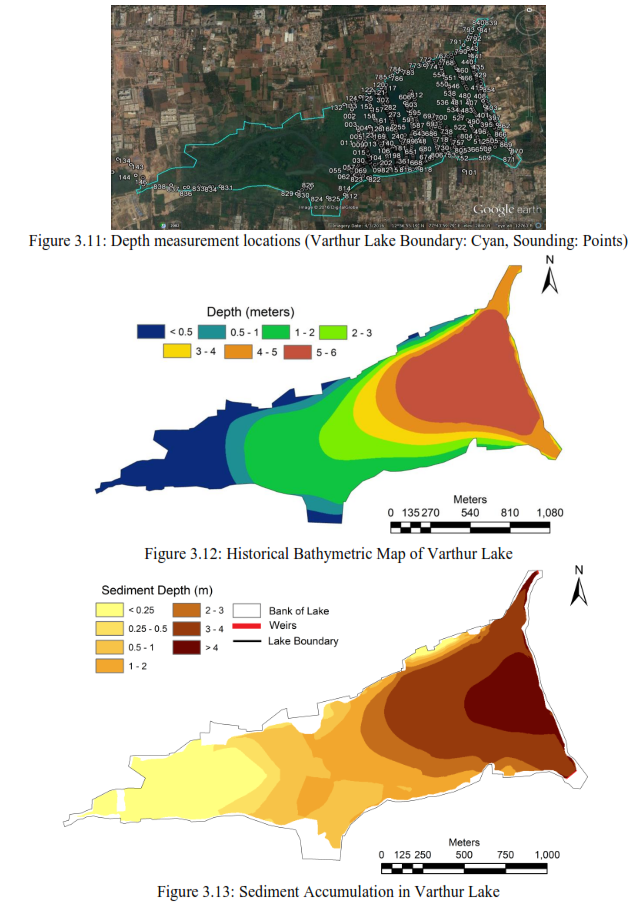
Table 3.5: Summary of Bathymetric results
Slno |
Description |
Quantity |
1 |
Surface area of Lake (hectares) |
190.75 |
2 |
Storage Volume (Million cubic meters) |
6.10 |
3 |
Current Storage Volume of Water (Million cubic meters) |
1.61 |
4 |
Volume of Slush deposit (Million cubic meters) |
0.62 |
5 |
Volume of Sediment deposits (Million cubic meters) |
3.87 |
6 |
Bulk Density of Sediment (kilograms per cubic meter) |
1700 |
7 |
Weight of Sediment present in the lake (Million Tonne) |
6.58 |
Using Sediment for moulding Burnt Brick |
8 |
Average Weight of Burnt Brick (kilograms) |
4 |
9 |
Number of Bricks that can be manufactured using the sediment (Million) |
1644 |
10 |
Cost of one Brick (Rupee) |
5.00 |
11 |
Revenue generated by manufacturing Burnt Bricks (Crore Rupee) |
822 |
Using Sediment For Construction |
12 |
Capacity of One truck (Tonne) |
25 |
13 |
Number of Truck loads (thousands) |
263 |
14 |
Cost of Low grade Sand for each truck load (Rupee) |
25000 |
15 |
Revenue Generated from Sediment as sand (Crore Rupee) |
658 |
3.6 Consequences of Lake Pollution:
-
Fish mortality: Large-scale fish mortality in recent months further highlights the level of contamination and irresponsible management of water bodies. Sustained inflow of untreated sewage has increased the organic content beyond the threshold of remediation capability of respective water bodies. Increasing temperature (of 34 to 35 °C) with the onset of summer, enhanced the biological activities (evident from higher BOD and Ammonia) that lowered dissolved oxygen levels leading to fish death due to asphyxiation.
- Decline in groundwater table and quality: Water table has declined to 300 m from 28 m and 400 to 500 m in intensely urbanised area such as Whitefield, etc. over a period of 20 years with the decline in wetlands and green spaces. The analysis of groundwater samples in 1 km buffer region reveals (i) higher levels of nitrate, (ii) traces of heavy metal and (iii) biological contamination.
- Increased GHG (Greenhouse gas) footprint: Mismanagement of solid and liquid wastes has increased the anaerobic condition leading to emissions of greenhouse gases (methane, CO2, etc.).
-
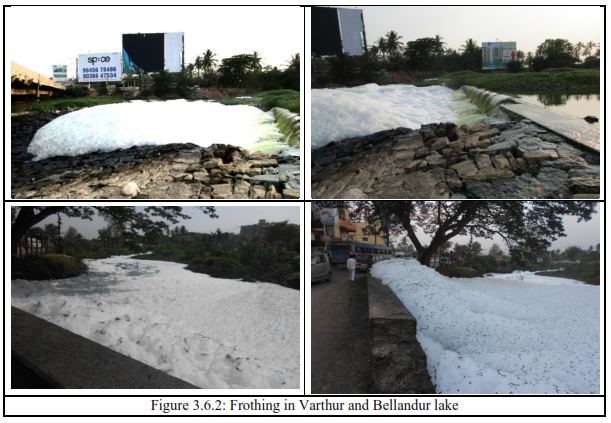
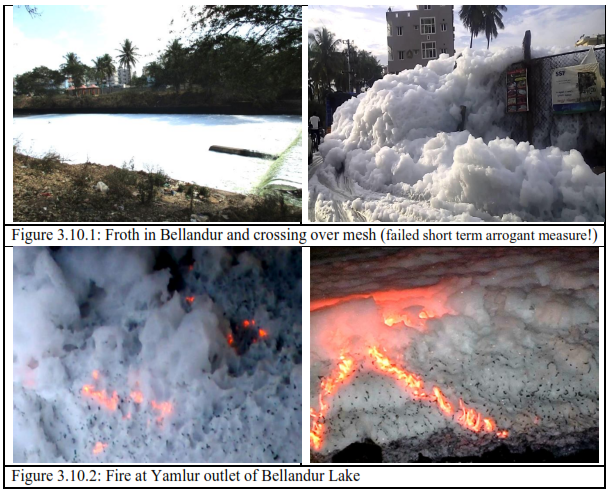
Frothing: Foams are formed in lakes due to sustained inflow of sewage (rich in phosphates). Decomposition of algae, fish and macrophytes, releasing a variety of organic compounds into the water body. These organic compounds act as surfactants (foaming agents) that has a hydrophilic (water attracting) end and hydrophobic hydrocarbon chain (water repelling) at the other end. Also, surface-active agents in wastewater include synthetic detergents, fats, oils, greases and bio-surfactants. These agents rise to the surface of lakes and interact with water molecules thus, reducing the attraction of water molecules to each other (i.e. surface tension of the water). When the surface tension decreases, air mixes with the water molecules and foaming agents resulting in bubbles formation. These bubbles aggregate together and forms foam in lakes. The surface-active agents or surfactants reduce the surface tension of water, allowing air bubbles to persist at the water’s surface. Natural surfactants include carboxylic fatty acids derived from lipids from macrophytes/weeds etc. These are released into water and contribute to a large variety of soluble organic material known as dissolved organic carbon (DOC). Though DOC is produced within lake waters, the major source is the sustained inflow of sewage from the vicinity of the lakes and the watershed. Higher DOC concentrations in lakes, generally impart a brown colour to the water. However, white colour of the lake foam (Figure 3.10.1) indicates that is caused by synthetically produced surfactants released through sewage to surface waters. Synthetic surfactants are widely used in household cleaning products (detergents/soaps), cosmetics and personal care products (shampoo, toothpaste etc.). Common detergents also contains branch-chained alkyl benzene sulfonate surfactants, which are non-biodegradable and results in extremely persistent foam accumulating below the fall levels in the lake and other wastewater outfalls.
Detergents and soaps mostly contain phosphate (P, ~30 % STPP) softeners to enhance the effectiveness of surfactants through the reduction of water hardness. P loading in lakes has contributed to nutrient enrichment with the proliferation of cyano-bacterial blooms and macrophytes (aquatic plants). There are set of advanced detergents that exclude phosphates but contain biodegradable linear alkyl benzene sulfonate surfactants, such as sodium or ammonium lauret or lauryl sulfate. Surfactants are also used by many industries as wetting agents, dispersants, defoamers, de-inkers, antistatic agents, and in paint and protective coatings, pesticides, leather processing, plastics and elastomer manufacturing, and oil extraction and production. A portion of phosphates is up-taken by aquatic plants while the balance gets trapped in the sediments. Pre-monsoon showers coupled with gusty winds leads to the churning of lake water with upwelling of sediments. Vigorous mixing of surface water coupled with high flow across narrow channels, leading to bubble formation that persist and build up as foam (Figure 3.10.1). The foams formed in large quantities moves to shorelines by wind and water currents. Natural foams are usually linked to humic and fulvic acid substances, fine colloidal particles, lipids and proteins released from aquatic or terrestrial plants, saponins (plant glycosides), the decomposition products of phytoplankton containing carbohydrates and proteins and the organic matter in sediments. In these lakes, foam /froth gets accumulated along windward shores. Continuous sewage fed in Bellandur and Varthur lakes, has been witnessing foam at downstream in chocked channels or below fall/discharge point since one decade (this is witnessed since 2000 and the quantum of foam has gone up by manifolds in recent times – post 2012).
Sampling and water quality analysis (subsequent to frothing in May 2015) reveals the presence of higher amount of different physico-chemical parameters like total dissolved solids (332-1246 mg/l); electrical conductivity (460-1470 µS); dissolved oxygen (0-8.16 mg/l); chemical oxygen demand (40-325.33 mg/l); biochemical oxygen demand (24.39-140.8 mg/l); alkalinity (56-520 mg/l); chloride (88.04-191.7 mg/l); total hardness (198-436 mg/l); calcium hardness (56.11-344.27 mg/l); magnesium hardness (18.08-124 mg/l); sodium (9-1046 mg/l) and potassium (0-130 mg/l), indicate pollution/sewage entry into the lake.
- Fire: Foam caught fire (figure 3.10.2) due to compounds with high flammability i.e. hydrocarbons and organic polymers that came from nearby industries in the vicinity of Bellandur lake. Discharge of untreated effluents (rich in hydrocarbon) with accidental fire (like throwing cigarettes, beedi) has led to the fire in the lake on 16th May 2015 (Source: Ramachandra, T. V., Asulabha, K. S., Sincy, V., Vinay, S., Aithal, B. H., Bhat, S. P., and Mahapatra, D. M., 2015. Pathetic status of wetlands in Bangalore: Epitome of inefficient and uncoordinated Governance. ENVIS Technical Report 93, CES, Indian Institute of Science, Bangalore).
3.7 Overall Observation and Recommendations:
Due to the sustained influx of fresh sewage over the last several decades, nutrients in the lake are now well over safe limits. Bellandur and Varthur lakes being the end of the lakes series in the KC valley Varthur Lake has been receiving about ~45% of the city sewage for over last 60 years resulting in eutrophication. There are substantial algal blooms, Dissolved Oxygen (DO) depletion and malodour generation, and an extensive growth of water hyacinth that covers about 70–80% of the lake in the dry season. Sewage brings in large quantities of C, N and P which are responsible for eutrophication, profuse growth of macrophytes and algal bloom.
Recommendations: The restoration and conservation strategies has to be implemented for maintaining the ecological health of aquatic ecosystems, aquatic biodiversity in the region, inter-connectivity among lakes, preserve its physical integrity (shorelines, banks and bottom configurations) and water quality to support healthy riparian, aquatic and wetland ecosystems. The regular monitoring of water bodies and public awareness will help in developing appropriate conservation and management strategies.
The success of rejuvenation depends on:
- Good governance (too many para-state agencies and lack of co-ordination). Single agency with the statutory and financial autonomy to be the custodian of natural resources (ownership, regular maintenance and action against polluters (encroachers as well as those contaminate through untreated sewage and effluents, dumping of solid wastes). Effective judicial system for speedy disposal of conflicts related to encroachment.
- Digitation of land records (especially common lands – lakes, open spaces, parks, etc.) and availability of this geo-referenced data with query based information system to public;
- Removal of encroachment of lakes / wetlands, lake beds and storm water drains (connecting feeders) after the survey based on reliable cadastral maps; Ensure proper fencing of lakes and to make land grabbing cognizable non-bail offence;
- Restriction of the entry of untreated sewage and industrial effluents into lakes; Decentralised treatment of sewage (preferably at ward levels). Letting only treated sewage into the lake (as in Jakkur lake model); Ensure that sewage generated in a locality /ward is treated locally;
- Removal of nutrient rich sediments – to enhance the storage capacity, improve groundwater recharge, to minimise further contamination of treated water, etc.;
- Ban on use of phosphates in the manufacture of detergents; will minimise frothing
- Regular removal of macrophytes (Eichhornia sp., Alternanthera sp. etc.) in the lakes;
- Implementation of ‘polluter pays’ principle as per water act 1974;
- Plant native species of macrophytes in open spaces of lake catchment area;
- Stop solid wastes dumping into lakes / in the lake bed; Banning of filling of a portion of lake with building debris.
- Restrictions on the diversion of lake for any other purposes;
- Complete ban on construction activities in the valley zones.
- Decentralised management of lakes through local lake committees involving all stakeholders
|
|
T.V. Ramachandra
Centre for Sustainable Technologies, Centre for infrastructure, Sustainable Transportation and Urban Planning (CiSTUP), Energy & Wetlands Research Group, Centre for Ecological Sciences, Indian Institute of Science, Bangalore – 560 012, INDIA.
E-mail : cestvr@ces.iisc.ac.in
Tel: 91-080-22933099/23600985,
Fax: 91-080-23601428/23600085
Web: http://ces.iisc.ac.in/energy
Durga Madhab Mahapatra
Energy & Wetlands Research Group, Centre for Ecological Sciences, Indian Institute of Science, Bangalore – 560 012, INDIA.
E-mail: durgamadhab@ces.iisc.ac.in
Vinay S
Energy & Wetlands Research Group, Centre for Ecological Sciences, Indian Institute of Science, Bangalore – 560 012, INDIA.
E-mail: nvjoshi@ces.iisc.ac.in
Sincy V
Energy & Wetlands Research Group, Centre for Ecological Sciences, Indian Institute of Science, Bangalore – 560 012, INDIA.
E-mail: sincy@ces.iisc.ac.in
Asulabha K S
Energy & Wetlands Research Group, Centre for Ecological Sciences, Indian Institute of Science, Bangalore – 560 012, INDIA.
E-mail: asulabha@ces.iisc.ac.in
Sudarshan P. Bhat
Energy & Wetlands Research Group, Centre for Ecological Sciences, Indian Institute of Science, Bangalore – 560 012, INDIA.
E-mail: sudarshan@ces.iisc.ac.in
Bharath H. Aithal
Energy & Wetlands Research Group, Centre for Ecological Sciences, Indian Institute of Science, Bangalore – 560 012, INDIA.
E-mail: bharath@ces.iisc.ac.in
Citation: Ramachandra T V, Durga Madhab Mahapatra, Vinay S, Sincy V, Asulabha K S, Sudarshan Bhat, Bharath H. Aithal, 2017. Bellandur and Varthur Lakes Rejuvenation Blueprint, ENVIS Technical Report 116, Environmental Information System, CES, Indian Institute of Science, Bangalore 560012.
|