|
|
Lakes and water bodies also referred to as wetlands are one of the most productive ecosystems contributing to ecological sustainability thereby providing necessary linkages between land and water resources. The quality and hydrologic regime of these lakes and wetlands is directly dependent on the integrity of its watershed. In last couple of decades, rapid urbanization coupled with the unplanned anthropogenic activities has altered the wetland ecosystem severely across globe. Changes in land use and land cover (LULC) in the wetland catchments influence the water yield and water quality for the lakes. Apart from LULC changes, the inflow of untreated domestic wastewater, industrial effluents, dumping of solid wastes and rampant encroachments of catchment has threatened the sustenance of urban wetlands. This is evident from the nutrient enrichment and consequent profuse growth of macrophytes, impairing the functional abilities of the wetlands. Reduced treatment capabilities of the wetlands have led to the decline of native biodiversity, prevailing unhygienic conditions with mosquito menace, contamination of groundwater levels, affecting the livelihood of wetland dependent population. Decline in the services and goods of wetland ecosystems have influenced the social, cultural and ecological spaces as well as of water management. This necessitates a systematic lake rejuvenation paradigm and associated monitoring of wetlands to mitigate the impacts through appropriate management strategies. A combination of LULC analysis in the catchment using remote sensing data acquired through the space-borne sensors facilitates identification of valley zones and wetland area. This in turn aids in maintaining records for encroachment and consequent action. Factor like nature of the catchment, wastewater quality and quantity influx, garbage dumping etc. related to water quality are the most important pressure driving the productivity of these rapidly disappearing wetland systems and are reasons for today’s dominance of exotic organisms with increasing heterogeneity of biotic components at an intermediate spatial and temporal scale. Nutrient (C, N and P) influx being the most significant reason for the present deterioration of these wetland and water bodies. Suitable catchment management practices with strategic control of untreated industrial and domestic effluents getting into these water bodies will be key for a sustainable city management plan. Recommended de-silting and de-weeding the water bodies, complete treatment of municipal and industrial wastewater, a ban in P use in detergents, removal of encroachments, fencing and green belt around the water bodies, and growth of essential N-rich aquatic vegetation for the livelihood of nearby dependent communities and provision to retain the natural floating islands for in-situ bioremediation. Further strategic planning needs to be adopted at the higher level for increase in consensus for optimal water usage, provisions for rain water harvesting, ground water recharge etc. for fostering sustainable city management.
Recommendations:
-
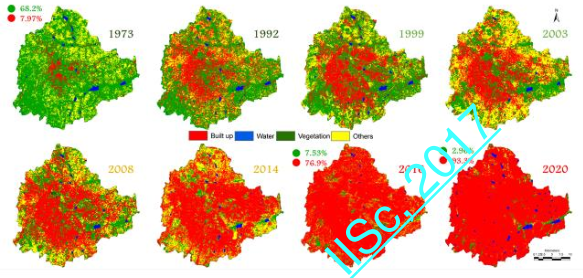
Urbanisation and loss of natural resources (wetlands and green spaces): Urbanisation during 1973 to 2016 (1005% concretization or increase of paved surface) has telling influence on the natural resources such as decline in green spaces (88% decline in vegetation), wetlands (79% decline), higher air pollutants and sharp decline in groundwater table. Figure 1 depicts the unrealistic urban growth during the last two decades. Quantification of number of trees in the region using remote sensing data with field census reveals that there are only 1.5 million trees to support Bangalore's population of 9.5 million, indicating one tree for every seven persons in the city4. This is insufficient even to sequester respiratory carbon (ranges from 540-900 g per person per day). Geo-visualisation of likely land uses in 2020 through multi-criteria decision making techniques (Fuzzy-AHP: Analytical Hierarchal Process) reveals calamitous picture of 93% of Bangalore landscape filled with paved surfaces (urban cover) and drastic reduction in open spaces and green cover. This would make the region GHG rich, water scarce, non-resilient and unlivable, depriving the city dwellers of clean air, water and environment.
Field investigations (during 2015-16) of 105 lakes reveals that 98% lakes have been encroached for illegal buildings (high raise apartment, commercial building, slums, etc.) and 90% of lakes are sewage fed. Also, lake catchments are being used as dumping yards for either municipal solid waste or building debris. Indiscriminate disposal of solid and liquid waste (rich in organic nutrient) has enriched nitrate levels in the surrounding groundwater resources, threatening the residents’ health (such as kidney failure, cancer, etc.). Washing, household activities, vegetable cultivation and even fishing was observed in few contaminated lakes. Unauthorised construction in valley zones, lakebeds and storm water drains highlight the apathy of decision makers while mirroring weak and fragmented governance. This is correlated with the increase in unauthorized constructions violating town planning norms (city development plan) which has affected severely open spaces and in particular water bodies.
Large-scale fish mortality in recent months further highlights the level of contamination and irresponsible management of water bodies. Sustained inflow of untreated sewage has increased the organic content beyond the threshold of remediation capability of respective water bodies. Increasing temperature (of 34 to 35 °C) with the onset of summer, enhanced the biological activities (evident from higher Ammonia and BOD -Biochemical Oxygen Demand) that lowered dissolved oxygen levels leading to fish death due to asphyxiation.
|
Figure 1: Urban growth in Bangalore (based on temporal data acquired through space borne sensors) |
-
Floods: Conversion of wetlands to residential and commercial layouts has compounded the problem by removing the interconnectivities in an undulating terrain. Encroachment of natural drains, alteration of topography involving the construction of high-raise buildings, removal of vegetation cover, reclamation of wetlands are the prime reasons for frequent flooding even during normal rainfall post 2000.
- Decline in groundwater table: Water table has declined to 300 m from 28 m and 400 to 500 m in intensely urbanised area such as Whitefield, etc. over a period of 20 years.
- Heat island: Surface and atmospheric temperatures have increased by anthropogenic heat discharge due to energy consumption, increased land surface coverage by artificial materials having high heat capacities and conductivities, and the associated decreases in vegetation and water pervious surfaces, which reduce surface temperature through evapotranspiration. An increase of ~2 to 2.5 ºC during the past three decades highlights implication of explosive urban growth on local climate, necessitating appropriate strategies for the sustainable management of natural resources.
- Increased carbon footprint: Drastic increase in electricity consumption was observed in certain corporation wards due to the adoption of inappropriate building architecture in tropical climate. Per capita electricity consumption in the zones dominated by high raise building with glass facades ranges from 14000-17000 units (kWh) per year compared to the zones with eco-friendly buildings (1300-1500 units/person/year)3.
Emissions from transport sector is about 43.83% (in Greater Bangalore) on account of large scale usage of private vehicles, and mobility related to job accounts for 60 % of total emissions due to lack of appropriate public transport system and haphazard growth with unplanned urbanisation. Higher fuel consumption, enhanced pollution levels due to the increase of private vehicles, traffic bottlenecks have significantly contributed to carbon emissions. Majority commute longer distances due to lack of integrated land use and mobility planning, thus contributing to emissions. Apart from these, mismanagement of solid and liquid wastes has aggravated the situation. Dumping of solid and liquid waste in water bodies has increased the anaerobic condition leading to emissions of greenhouse gases (methane, CO2, etc.).
Unplanned cities thus not only contribute to global climate change by emitting the majority of anthropogenic greenhouse gases but also are particularly vulnerable to the effects of climate change and extreme weather. This emphaises the need to improve urban sustainability through innovations while addressing technical, ecological, economic, behavioral, and political challenges to create cities that are low-carbon, resilient, and livable.
The smart cities mission launched by the Government of India recently (in June 2015) envisages developing physical, institutional, social infrastructure in select cities with central assistance targeted at improving the quality of life as well as economic visibility of the respective urban centres5. Four strategic components are (i) green field development through smart townships by adopting holistic land management, (ii) pan-city development through adoption of smart applications like transport, reuse and recycle of wastewater, smart metering, recovering energy from solid waste, etc., (iii) retrofitting to make existing area more efficient and livable by reducing greenhouse gas (GHG) footprint, improving power and treated water supply3, improving communication and infrastructure connectivity and security, (iv) re-development of existing built-up area, creation of new layout through mixed land use, adoption of appropriate floor area index (FAI) considering the level of existing and scope for improvement of infrastructure and basic amenities, which helps in keeping the city’s growth within the region’s carrying capacity4 and urban infrastructure becomes inclusive. This entails efficient decision making through (i) integrated land use planning as per the city’s requirements considering mobility, etc., to minimize mobility related to jobs; (ii) enhancement of the functional capacity through user friendly and economic public transport support; (iii) development of mass rapid-transport systems for easy mobility in inter and intra cities; and (iv) effective use of ICT’s as enabling technologies to improve the level of services. These measures have to be implemented quickly as most cities are in a civic and financial disarray because of senseless unplanned rapid urbanisation.
Environmentally sound urban centres with essential basic amenities and advanced infrastructures (such as sensors, electronic devices and networks) would stimulate sustainable economic growth and improvements in citizen services. The deployment of information and communication technology infrastructures for effective governance support social and urban growth through improved economy and active participation of citizens. Indian cities while exhibiting technological innovations and connectedness, should also focus on increased living comfort through adequate infrastructure, green spaces and essential basic amenities to every citizen.
References
- Ramachandra, T.V., Bharath, H.A. and Barik, B., Urbanisation Pattern of Incipient Mega Region in India, TEMA. Journal of Land Use, Mobility and Environment, 2014, 7(1), 83-100.
- Ramachandra, T.V., Bharath H. A.,and Durgappa, D. S., Insights to urban dynamics through landscape spatial pattern analysis, Int. J Applied Earth Observation and Geoinformation, 2012,18,329-343,.
- Ramachandra, T.V., Bharath, H. A.and Sreejith, K., GHG footprint of major cities in India, Renewable and Sustainable Energy Reviews, 2015, 44,473–495
- Ramachandra, T.V., Bharath, H. A., Vinay, S., et al., Trees of Bengaluru, ENVIS Technical Report 75, ENVIS, Centre for Ecological Sciences, IISc, Bangalore, 2014. 75p.
- Smart cities, Url: http://smartcities.gov.in/ (Last accessed on 20th May 2016)
|
T.V. Ramachandra
Centre for Sustainable Technologies, Centre for infrastructure, Sustainable Transportation and Urban Planning (CiSTUP), Energy & Wetlands Research Group, Centre for Ecological Sciences, Indian Institute of Science, Bangalore – 560 012, INDIA.
E-mail : cestvr@ces.iisc.ac.in
Tel: 91-080-22933099/23600985,
Fax: 91-080-23601428/23600085
Web: http://ces.iisc.ac.in/energy
Durga Madhab Mahapatra
Energy & Wetlands Research Group, Centre for Ecological Sciences, Indian Institute of Science, Bangalore – 560 012, INDIA.
E-mail: durgamadhab@ces.iisc.ac.in
Vinay S
Energy & Wetlands Research Group, Centre for Ecological Sciences, Indian Institute of Science, Bangalore – 560 012, INDIA.
E-mail: nvjoshi@ces.iisc.ac.in
Sincy V
Energy & Wetlands Research Group, Centre for Ecological Sciences, Indian Institute of Science, Bangalore – 560 012, INDIA.
E-mail: sincy@ces.iisc.ac.in
Asulabha K S
Energy & Wetlands Research Group, Centre for Ecological Sciences, Indian Institute of Science, Bangalore – 560 012, INDIA.
E-mail: asulabha@ces.iisc.ac.in
Sudarshan P. Bhat
Energy & Wetlands Research Group, Centre for Ecological Sciences, Indian Institute of Science, Bangalore – 560 012, INDIA.
E-mail: sudarshan@ces.iisc.ac.in
Bharath H. Aithal
Energy & Wetlands Research Group, Centre for Ecological Sciences, Indian Institute of Science, Bangalore – 560 012, INDIA.
E-mail: bharath@ces.iisc.ac.in
Citation: Ramachandra T V, Durga Madhab Mahapatra, Vinay S, Sincy V, Asulabha K S, Sudarshan Bhat, Bharath H. Aithal, 2017. Bellandur and Varthur Lakes Rejuvenation Blueprint, ENVIS Technical Report 116, Environmental Information System, CES, Indian Institute of Science, Bangalore 560012.
|