Profile of Bangalore City
Bangalore is one of the fastest growing cities in India and is branded as ‘Silicon Valley of India’ for heralding and spearheading the growth of Information Technology (IT) based industries in the country. With the advent and growth of IT industry, as well as numerous industries in other sectors and the onset of economic liberalisation since the early 1990s, Bangalore has taken lead in service-based industries fuelling substantial growth of the city both economically and spatially. Bangalore has become a cosmopolitan city attracting people and business alike, within and across nations. This profile notes the urban setting and provides an overview of the urban fabric, while discussing various prospects related to infrastructure and governance (Sudhira, et al. 2007).
Bangalore
Bangalore1 is the principal administrative, cultural, commercial, industrial, and knowledge capital of the state of Karnataka. Greater Bangalore2, an area of 741 square kilometres agglomerating the city, neighbouring municipal councils and outgrowths, was ‘notified’ (established) in December 2006 (Figure 1.1 and Figure 1.2). A tiny village in the 12th century, it grew to become one of the fastest growing cities in the world by the 21st century and to figure among the million-plus cities in India3. Bangalore has grown spatially more than ten times since 1949 (Table 1.1).The city enjoys a pleasant and salubrious climate throughout the year. Its tree-lined streets, numerous parks and abundant greenery have led to it being called the 'Garden City' of India. It has also been identified as the country’s ‘Silicon Valley’ and it is one of the technological innovation hubs with a technological achievement index (TAI) of 134 according to the Human Development Report (United Nations Development Programme, 2001). However, with all the hype about growth in IT and IT based industries, Bangalore also houses numerous other leading commercial and educational institutions, and industries like textiles, aviation, space, biotechnology, etc. As an immediate consequence of this growth in the last decade, apart from creating a ripple effect in the local economy, there has also been great pressure on infrastructure and resources like water supply, energy, public transportation, land, etc. The local body and other parastatal agencies responsible for delivery of basic services are facing stiff challenges in catering to this demand.
Table 1.1: Bangalore City Corporation limits over the years
| Year |
Area (sq. km) |
| 1949 |
69 |
| 1963-64 |
112 |
| 1969 |
134 |
| 1979 |
161 |
| 1995 |
226 |
| 2007 |
716 |
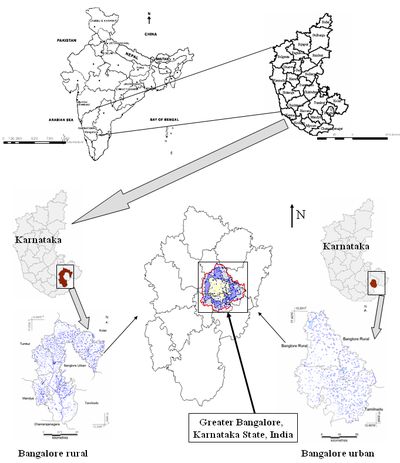
Figure 1.1: Location of– Greater Bangalore
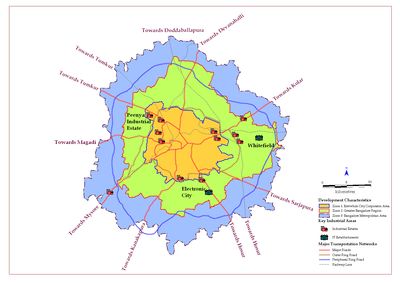
Figure 1.2: Map depicts Development Characteristic over Bangalore with the erstwhile City Corporation limits, Greater Bangalore region and Bangalore Metropolitan area and noting some of the prominent industrial areas.
Quite recently there have been serious attempts by sociologists and urban planners to characterise the city. Heitzman (2004) has analysed the nature of growth that the city experienced with the emergence of the information society, while bringing out the ingredients that led to the transformation of planning methodologies and spatial planning tools for the city. Nair (2005) has exemplified Bangalore as ‘the promise of the metropolis’ while illustrating the urban fabric of Bangalore over the last century. In this profile, an attempt is made to bring out the status of current infrastructure and various facets of planning and governance.
The next section deals with the origin and history of the city followed by a description of climate, geography and environment. The subsequent section considers culture, demography and economics. Lastly, the urban agenda addressing governance and infrastructure discussing the stakeholders involved, challenges in managing urban infrastructure and issues in planning and development are elaborated.
History and Culture
The earliest reference to the name, in the form ‘Bengalooru’, is seen in a ninth century Ganga inscription (hero-stone) from Begur , referring to a battle that was fought in that place. The present name of the city, Bangalore is an anglicised form of Bengalooru which according to the popular belief is derived from Bengaalu - synonymous of Benda kaalu or boiled beans and ooru meaning a town. Tradition associates Hoysala King Vira Ballala (12th Century) with the origin of this name. Vira Ballala, during one of his hunting expeditions in this region, lost his way and after hours of wandering reached the hut of an old woman. This woman is believed to have offered cooked beans to the king. Pleased with her hospitality, the king named the place as ‘benda kaala ooru’ (town of boiled beans). But it is interesting to note that there was already evidence for name of the place much before Hoysalas. Kamath (1990) notes that Bangalore is said to have got its name from benga, the localKannada language term for Pterocarpus marsupium, a species of dry and moist deciduous tree, and ooru, meaning town. However, the founding of modern Bangalore is attributed to Kempe Gowda, a scion of the Yelahanka line of chiefs, in 1537 (Kamath, 1990). Kempe Gowda is also credited with construction of four towers along four directions from Petta, the central part of the city, to demarcate the extent of city growth (Figure 2). By the 1960’s the city had sprawled beyond these boundaries (Asian Development Bank, 2001).
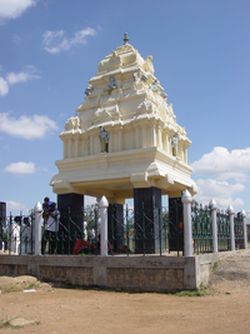
Figure 2: The Kempe Gowda Tower at Lalbagh – one of the four towers Kempe Gowda built to demarcate the extent of city growth in four directions. [Photo: H. S. Sudhira]
Later on, the city was administered by the Wodeyars, rulers of Mysore, until it was given as Jagir (with rights for general administration and collection of taxes) to Hyder Ali during late 18th Century. Hyder Ali and later, his son, Tippu Sultan, were responsible for growth and development of Bangalore in a significant way with the construction of summer palace and Lalbagh. Indeed, Bangalore was already the commercial capital during Tippu’s time and the second important city after Srirangapatna, Tippu’s capital. During the early nineteenth century, the city was known to have almost all coins in circulation from different places and kingdoms, thus evidencing a flourishing trade and commerce (Buchanan, 1870). The fall of Bangalore in the Second Mysore War of 1792, may also have led to the fall of Tippu Sultan in Third Mysore War of 1799, after which Bangalore became a base for the British troops and saw the establishment of the Cantonment in 1802. British control over Bangalore was initially established indirectly through the Maharaja of Mysore. By 1831 the administration of the city was taken over by the British, and in 1862 two independent municipal boards were established: Bangalore City Municipality (in the older areas), and Bangalore Civil and Military Station Municipality. At Independence, Bangalore was notified as the capital of Mysore (now Karnataka) State. In 1949, the two municipalities were merged and the Bangalore City Corporation was formed. Subsequently, to keep up with the pace of growth and development, there have been reorganizations with respect to the zones and wards within the corporation, rising from 50 divisions in 1949 to 95 wards in 1980s, 100 wards in 1995 and now about 150 wards. With the 2006 notification, the Bangalore City Corporation is now reorganized as Greater Bangalore City Corporation (Note 2).
Bangalore, in spite of the buzz around IT-based and related commercial activities, has retained much of its unique cultural ties keeping its date with its history, culture and tradition. The city is known for historical temples such as the Someshwara temple in Halasuru (neighbourhood of Bangalore) built during 12th – 13th century by Cholas, Basavanagudi (Bull Temple) built by Kempe Gowda during 16th century, Kaadu Malleshwara temple built during 17th century in Dravidian architecture, and Gavi Gangadhareshwara temple, all nestle in the middle of the city. Apart from the numerous temples that have mushroomed around the city, Bangalore also has one of the six basilicas in the country, built during the 17th century, St. Marks Cathedral built during 1808, the oldest mosque, Sangeen Jamia Masjid built by the Moghuls during the 17th century, and the popular Jamia Masjid near the City Market built during the 1940s. The ‘Bengalooru Karaga’ is a major annual fair associated with the Dharamaraya temple, is considered to be the actual fair of the erstwhile city, and is still persistent in the older central parts of the city. Karaga, a five-day festival of Tigalas, a community who migrated from Tamil Nadu, has many unique features such as intense religious fervour, strict rituals, unchanged traditions over centuries, a fixed route and stops for the procession, welcome and respect shown at all the temples on route. The annual groundnut fair, ‘Kadalekai Parishe’ takes place in a part of old city, Basavanagudi during November-December. More recently, an annual cultural fest called ‘Bengalooru Habba’ (‘habba’ in kannada means festival) is held during the first week of December hosting various cultural programmes like music, dance and drama. The involvement of all sections of people and the unique communal harmony displayed by the special prayer at Tawakkal Mastan Darga (mosque) are also remarkable (Chandramouli, 2002).
Geography and Environment
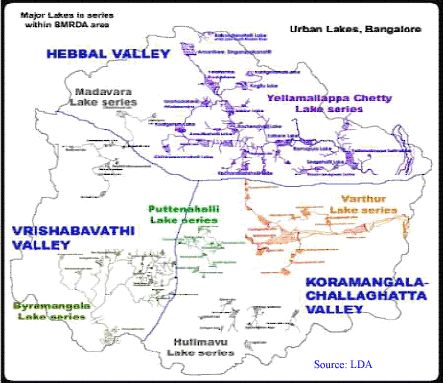
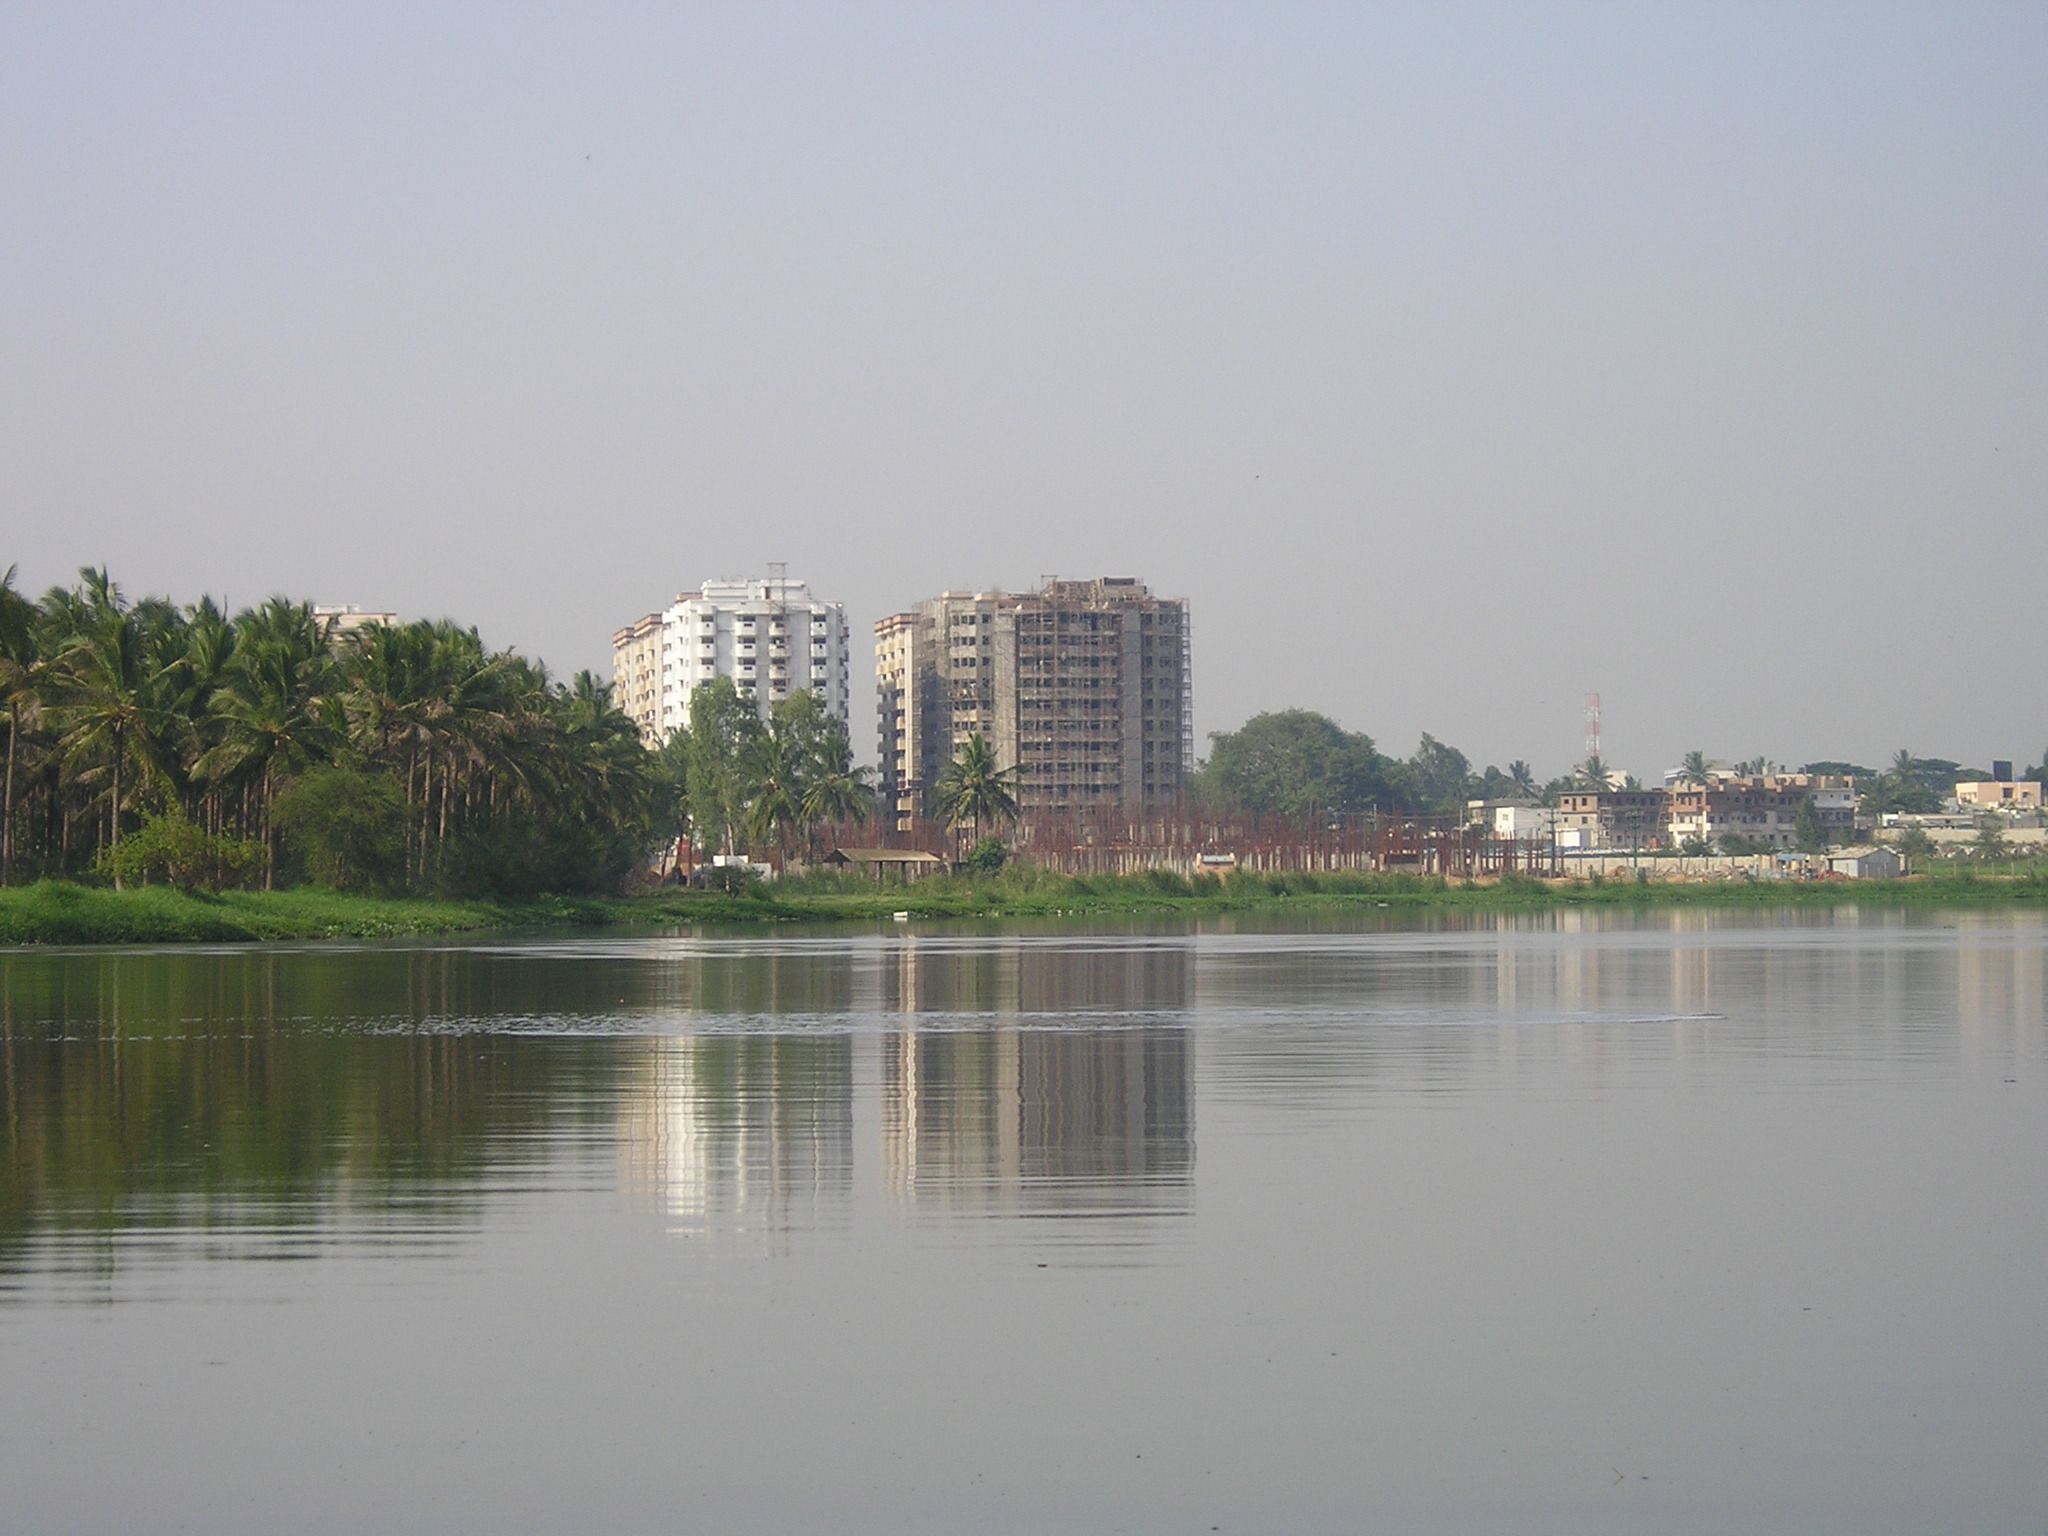
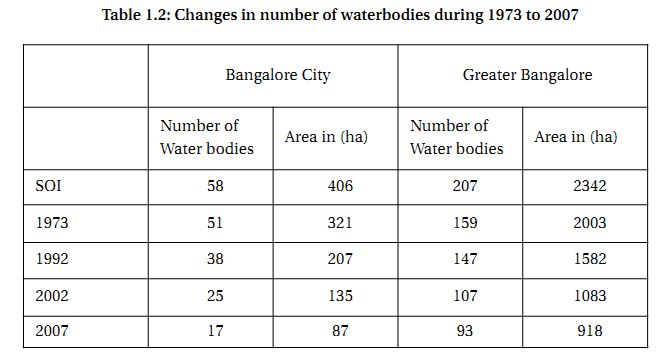
Bangalore is located at 12.59º north latitude and 77.57º east longitude, almost equidistant from both eastern and western coast of the South Indian peninsula, and is situated at an altitude of 920 metres above mean sea level. The mean annual total rainfall is about 880 mm with about 60 rainy days a year over the last ten years.. The summer temperature ranges from 18° C – 38° C, while the winter temperature ranges from 12° C – 25° C. Thus, Bangalore enjoys a salubrious climate all round the year. Bangalore is located over ridges delineating four watersheds, viz. Hebbal, Koramangala, Challaghatta and Vrishabhavathi watersheds (Figure 3). The undulating terrain in the region has facilitated creation of a large number of tanks providing for the traditional uses of irrigation, drinking, fishing and washing. Their creation is mainly attributed to the vision of Kempe Gowda and of the Wodeyar dynasty. This led to Bangalore having hundreds of such water bodies through the centuries. Even in early second half of 20th century, in 1961, the number of lakes and tanks in the city stood at 262. These, and open spaces generally, were seriously affected however with the enhanced demand for real estate and infrastructure` consequent to urbanisation. Temporal analysis of waterbodies indicate sharp decline of 58% in Greater Bangalore attributing to intense urbanisation process, evident from 466% increase in builtup area from 1973 to 2007. Figure 4.1 provides the distribution of wetlands in 1973, 1992, 2002 and 2007 based on the respective years’ remote sensing data. The analysis revealed that there were 51 wetlands (321 ha) in 1973, 38 (207 ha) in 1992, 25 (135 ha) in 2002 and dropped down to 17 with an extent of 87 ha in 2007 in the Bangalore city limits. The corresponding number of waterbodies and their areas were computed and are listed in table 1.2 (Ramachandra and Kumar, 2008). There were 159 waterbodies spread in an area of 2003 ha in 1973, that reduced to 147 (1582 ha) in 1992, which further declined to 107 (1083 ha) in 2002 and finally there are only 93 waterbodies (both small and medium size) with an area of 918 ha in the Greater Bangalore region. Waterbodies in northern part of greater Bangalore are in a considerably poor state compared to the waterbodies in southern greater Bangalore. With the city’s unprecedented growth, the large number of public open spaces diminished over the years. Much of the loss in green cover is due to the rapid change in land use. As the city grew over space and time, inner areas got more crowded and congested. Initiatives to ease congestion on road networks have led to axing numerous road-side trees. Many lakes have been converted into residential layouts, bus stands, play grounds and stadiums, etc (Figure 4.2).The built-up area in the metropolitan area was 16 % of total in 2000 and is currently estimated to be around 23-24 %. The rest of the area is occupied by either agriculture lands, quarries or other vacant land.

Figure 3: Cascading Lake series of Bangalore (Source: Lake Development Authority)
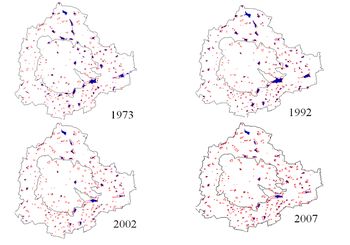
Figure 4.1: Temporal (1973-2007) changes in number of waterbodies in Greater Bangalore
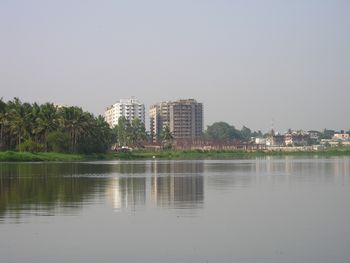
Figure 4.2: Bangalore, once boasted of 81 lakes in the city limits, while now about 34 show some signs of existence. High-rise buildings sprouting across Bellandur lake.
Table 1.2 : Changes in number of waterbodies during 1973 to 2007
| |
Bangalore City |
Greater Bangalore |
| |
Number of
Water bodies |
Area (in ha) |
Number of
Water bodies |
Area (in ha) |
| SOI |
58 |
406 |
207 |
2342 |
| 1973 |
51 |
321 |
159 |
2003 |
| 1992 |
38 |
207 |
147 |
1582 |
| 2002 |
25 |
135 |
107 |
1083 |
| 2007 |
17 |
87 |
93 |
918 |
In the aspect of nurturing flora and fauna, the situation in Bangalore is quite complex. With prominent green spaces like Lalbagh and Cubbon Park almost at the city centre and a few water bodies, such as Ulsoor, Sankey, Lalbagh, Yediyur and Madiwala, scattered across city’s landscape, the remaining green spaces in the periphery harbour a great number of species. In a compilation of fauna present in and around Bangalore within a radius of 40 km from city centre (Karthikeyan 1999), about 40 species of mammals, more than 340 species of birds, 38 species of reptiles, 16 species of amphibians, 41 species of fishes and 160 species of butterflies have been recorded. A new ‘ant’ species, Dilobocondyla bangalorica, was discovered in Bangalore recently (Varghese, 2006). In another study, Sudha and Ravidranath (2000) have investigated the floral assemblage in different land-use categories and the changes in vegetation over Bangalore City. 164 species were identified in different residential areas, of which 149 were recorded within compounds and 87 were avenue trees. The rich diversity speaks for the volume of life still persisting in spite of rapid urban growth.
In recent times, the increase in vehicular traffic (see section on Urban Agenda addressing Infrastructure) has increased suspended particulate matter and other oxides of carbon, nitrogen and sulphur in the environment. Air pollution and the reduction in tree cover have induced the urban heat island effect resulting in variations in local temperature and sudden unanticipated showers during late afternoon.
Demography and Economy
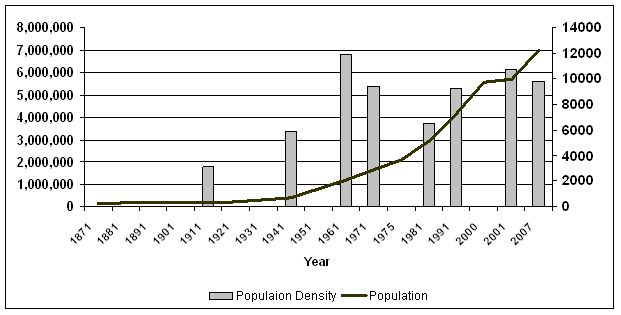
The state of Karnataka was carved out in 1956 based on linguistic boundaries, with regions dominated by Kannada speaking people. Bangalore was retained as the capital of the state, with Kannada as the official language while accommodating other languages like Tamil, Telugu, Malayalam, English and Hindi, true to its cosmopolitan status,. The census of population in Bangalore has been recorded every decade since 1871, during the colonial times, the most recent census being carried out in 2001. Figure 5.1 shows the growth of population in Bangalore from 1871 to 2001 (5.7 million), along with an estimate for 2007 (7 million). Now, Bangalore is the fifth largest metropolis in India currently with a population of about 7 million. Population growth and population density changes during 1871 to 2007 is given in figure 5.2. It is notable that since the first census, Bangalore was already the most populous city in Karnataka. This urban primacy has been retained consistently for more than a century now. After Independence, Bangalore, now a State capital, saw an influx of population migrating to the city, although it should be noted that the steep population rise in the decade 1941-1951, while due in part to this migration, also reflects the amalgamation of Bangalore Civil and Military Station Municipality with the then Bangalore City Corporation. Population growth during the 1970s could be ascribed to numerous public sector industries and other defence establishments that came up during the period and fuelled significant immigration. By this time, incidentally, Bangalore had lost its tag of ‘Pensioners Paradise’, gained before Independence. Although the advent of IT is attributed to the late 1980s, major growth and expansion of this industry happened only during the late 1990s. Still, population growth in Bangalore in the last census decade, 1991-2001 (38%), was substantially less than in 1971-1981 (76%). Nevertheless, the physical growth of the city has been phenomenal over the last few years, and the glaring evidence of this is increased travel-times and the escalating real-estate prices.
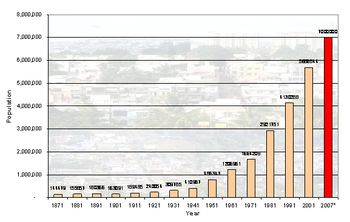
Figure 5.1: Population Growth of Bangalore City 1871 – 2007*
(* The population for 2007 is an estimate) Source: Census of India (2001b)

Figure 5.2: Population growth and population density
According to the latest census (Census of India, 2001a), the urban agglomeration had an overall population in 2001 of 5.7 million, including a workforce of 2.2 million, within an area of 560 sq. km, and a literacy rate of 75.1 %. The hype over the IT industry is underlain by Bangalore having about 30 % of all IT workforce in the country and a personal disposable income greater than the Indian city average. This has also resulted in a trickle down effect within the urban economy. Further, investments in industries (not only IT), infrastructure and other services, have significantly increased purchasing power among the people and have nurtured real estate with consequent land market dynamics, apart from creating numerous secondary employment in services. Interestingly enough, of the 5.7 million population in the urban agglomeration in 2001, about 2 million were migrants (Census of India, 2001b). About 1.2 million of these were from Karnataka state, mainly from the rural parts, while the remaining 0.8 million were from outside the state, the majority of these from urban areas. It is further noted that people have migrated chiefly for employment or moved with household or for education. The large number of migrant population from other parts of India explains the multitude of languages spoken and understood in Bangalore.
Bangalore is home to numerous high-tech knowledge hubs evident from the establishment of premier centres like Indian Institute of Science (IISc), National Institute of Advanced Studies (NIAS), Tata Institute for Fundamental Research (TIFR), Jawaharlal Nehru Centre for Advanced Scientific Research (JNCASR), Indian Space Research Organisation (ISRO), National Aerospace Laboratories (NAL), Defence Research and Development Organisation (DRDO), Indian Institute of Management (IIM), Institute for Social and Economic Change (ISEC), Indian Institute of Information Technology (IIIT) and several professional engineering and medical colleges at undergraduate and graduate levels. In tune with recent trends, Bangalore now has numerous malls and multiplexes that are swarmed during weekends. With an active night life and Bangaloreans penchant for fast-food, a large number of restaurants, pubs and ‘eat-outs’ throng the city.
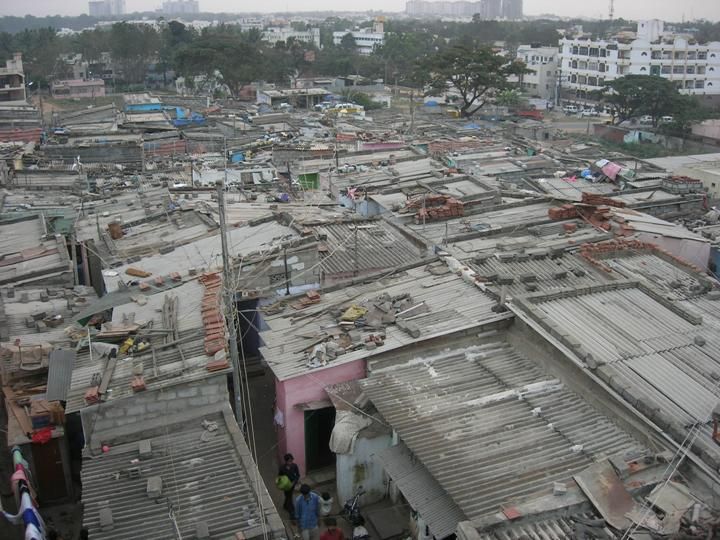
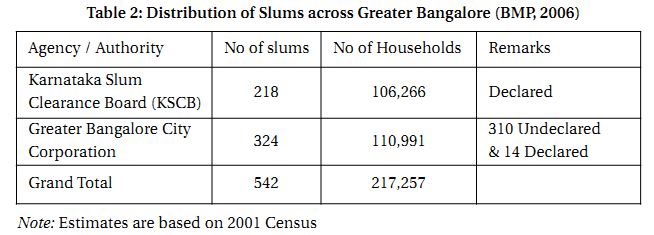
The economic fabric of the city, although at times masked by the IT-based industries is varied, being also characterised by textile, automobile, machine tool, aviation, space, defence, and biotechnology based industries. In addition, numerous services, trade and banking activities mark the city’s economic landscape. An important feature of the economic activities of Bangalore is the huge concentration of Small & Medium Enterprises (SMEs) in diversified sectors across the city. Bangalore has more than 20 industrial estates/areas comprising large, medium and small enterprises. Of these, Peenya Industrial Estate located in the northern part of the city comprises about 4000 SMEs and is considered the largest industrial estate in South and South East Asia (PIA, 2003). A majority of the SMEs function as ancillaries/subcontractors to large enterprises in the field of engineering and electronics industries, among others. The industrial estates sprung up mostly in the periphery of the erstwhile city and gradually as the city grew became part of its sprawl. Notable among these are the Peenya Industrial Estate just mentioned, Electronic City and Whitefield (Figure 1.2). The proliferation of SMEs in residential and commercial areas, in addition to the industrial areas, has added to the chaos and congestion in the city. Thus, the thriving economy of the city has resulted with a net district5 income of Rs. 262,592 million (approx. US $ 5.8 billion) and a per capita income of Rs. 39,420, a little more than twice the State’s average per capita income of Rs. 18,360 (Government of Karnataka, 2005). Despite higher per capita income within the urban district than in the rest of the State, and with significant migrant population, the number of urban poor has been on the rise and the slum settlements in the city have not been contained. The escalating costs of land prices coupled with rise in cost of living has pushed the urban poor to reside in squatter settlements with inadequate amenities and services (Figure 6). Some of these settlements have speckled the city’s landscape garnering immediate action from civic authorities. According to BMP (2006), the number of households in the urban agglomeration defined as poor was 0.22 million, housing approximately 1.1 million people out of 5.7 million population (Table 2). Noting the importance of the matter, the State Government has set up a special agency, Karnataka Slum Clearance Board (KSCB)6 specifically to address the redevelopment of slums in partnership with various stakeholders like the Housing Board, Local Bodies, Water Supply Boards, etc The initiatives taken up by the local body addressing redevelopment of slums are noted in the section on Issues in Planning and Development.
Table 2: Distribution of Slums across Greater Bangalore (BMP, 2006)
| Agency / Authority |
No of slums |
No of Households |
Remarks |
| Karnataka Slum Clearance Board (KSCB) |
218 |
106,266 |
Declared |
| Greater Bangalore City Corporation |
324 |
110,991 |
310 Undeclared & 14 Declared |
| Grand Total |
542 |
217,257 |
|
Note: Estimates are based on 2001 Census
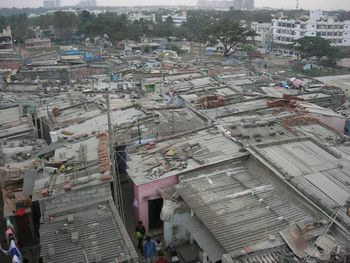
Figure 6: The plight of urban poor in Jayanagar 9th Block [Photo: BMP]
Urban Agenda: Governance and Infrastructure
An important aspect of a city is how well it is planned, managed and administered, activities which form the core part of an urban agenda – governance. However, appropriate state mechanisms through organisational structures, procedures and policies are needed to enable these. Also, apart from the formal administrative structures, the presence and involvement of civil society significantly drive the urban agenda.
Organisations and Stakeholders
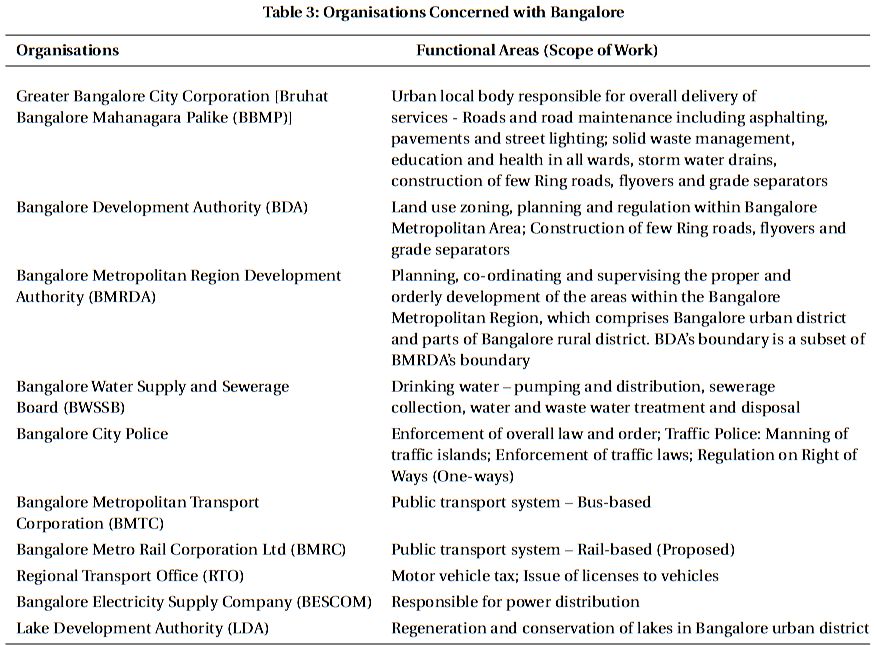
Greater Bangalore City Corporation (Bruhat Bengalooru Mahanagara Palike) is now the key ‘urban local body’ (ULB), that is, the local governmental structure representing and responsible to the citizens) for the city and outlying areas. Notified in December 2006, the new Corporation replaced the erstwhile local bodies, Bangalore City Corporation (Bangalore Mahanagara Palike), 8 neighbouring councils (7 City Municipal Councils and one Town Municipal Council) and 111 outlying villages. Independently of the Corporation, which is governed by locally elected representatives, parastatal bodies controlled by the State government are responsible for many essential services (see Table 3).
Planning in the form of land use zoning and regulation are vested with Bangalore Development Authority (BDA), a parastatal agency, in spite of the he 74th Constitutional Amendment Act, passed by the national parliament in 1993. This Act requires that the planning function be vested with the (elected) urban local body and not with any parastatal agency. But, in the case of Bangalore, the Corporation have not been granted adequate powers by the State to plan, decide and administer their city! Furthermore, the State has created numerous other organisations of its own to manage various services such as water supply, law and order, energy, etc, The result is the existence of many parastatal organisations, each acting in its own geographic area, leading to complication and confusion in coordinating different activities. Apart from the issue of a common geographical unit and the lack of coordinated effort, even basic information related to different sectors is extremely difficult to collect, collate and to correlate. For effective planning it is imperative that all the basic information is gathered across a common geographical unit with the effect of creating a robust city information system. In addition to the official bodies, civil society of Bangalore is known for its vibrant community participation. The spectrum of their activities ranges from literacy and green brigades to urban governance, ensuring continuous interactions with the local administration. Notable spheres of activity of these non-governmental organisations (NGOs) include: improving urban governance by Citizens Voluntary Initiative for the City (CIVIC) and Janaagraha; improving living conditions in slums by AWAS, APSA, Paraspara, etc.; addressing child literacy by Prerana and the India Literacy Project; taking on environmental issues by the Environment Support Group, Hasiru Usiru, etc. Apart from the NGOs, there are numerous resident welfare associations, trade and commercial organisations, and professional organisations that have played a major role in some of the important activities of local bodies and influencing their decision-making. Civil society has contributed considerably in shaping the policies and governance structures and has always intervened whenever there has been any apathy on the part of the administration towards activities of interest to society at large. An experiment to promote public private partnership and bring together citizens, NGOs, industry representatives and the erstwhile local bodies resulted in “Bangalore Agenda Task Force (BATF)”. This experiment was about to be benchmarked as one of the ‘best practices’ in urban local governance, when it faced strong criticisms from several civil society groups for setting aside priorities favouring the urban poor and was accused of making a back door entry towards policy making (Ghosh, 2005). In the event, the activities of BATF came to a standstill with the change of guard at the State government two years ago and it is currently dormant. Another instance of strong action by civil society groups, was seen when the local government started tree felling and pruning for road widening. Members of the green brigade, Hasiru Usiru, staged protests, held an all night vigil, stormed the Commissioner’s office and also moved to High Court and finally got the actions stayed. The High Court also ruled later that Hasiru Usiru members should inspect the trees along with the designated Tree Officer from the Forest Department before any tree felling and pruning of branches was begun.
Table 3: Organisations Concerned with Bangalore
| Organisations |
Functional Areas (Scope of Work) |
| Greater Bangalore City Corporation [Bruhat Bangalore Mahanagara Palike (BBMP)] |
Urban local body responsible for overall delivery of services - Roads and road maintenance including asphalting, pavements and street lighting; solid waste management, education and health in all wards, storm water drains, construction of few Ring roads, flyovers and grade separators |
| Bangalore Development Authority (BDA) |
Land use zoning, planning and regulation within Bangalore Metropolitan Area; Construction of few Ring roads, flyovers and grade separators |
| Bangalore Metropolitan Region Development Authority (BMRDA) |
Planning, co-ordinating and supervising the proper and orderly development of the areas within the Bangalore Metropolitan Region, which comprises Bangalore urban district and parts of Bangalore rural district. BDA’s boundary is a subset of BMRDA’s boundary |
| Bangalore Water Supply and Sewerage Board (BWSSB) |
Drinking water – pumping and distribution, sewerage collection, water and waste water treatment and disposal |
| Bangalore City Police |
Enforcement of overall law and order;
Traffic Police: Manning of traffic islands; Enforcement of traffic laws; Regulation on Right of Ways (One-ways) |
| Bangalore Metropolitan Transport Corporation (BMTC) |
Public transport system – Bus-based |
| Bangalore Metro Rail Corporation Ltd (BMRC) |
Public transport system – Rail-based (Proposed) |
| Regional Transport Office (RTO) |
Motor vehicle tax; Issue of licenses to vehicles |
| Bangalore Electricity Supply Company (BESCOM) |
Responsible for power distribution |
| Lake Development Authority (LDA) |
Regeneration and conservation of lakes in Bangalore urban district |
Challenges in Managing Urban Infrastructure
Urban activities require the support of infrastructure. Broadly, urban infrastructure can be divided into social and economic infrastructure. Social infrastructure encompasses facilities like health care, education, housing, commercial (shops, markets and hotels), sports, recreation and entertainment. With mixed land use being practiced in most parts of Bangalore, shops and markets are the most commonly found amenities (approximately 1 shop per 100 persons) in the urban agglomeration8 (Karnataka Urban Infrastructure Development & Finance Corporation, 2006). The provision and maintenance of primary health care, elementary education, sports, recreation and entertainment are administered mostly by the Corporation, while BDA also facilitates some of the social infrastructure like shopping complexes, with provisions for private participation. Economic infrastructure encompasses water supply, wastewater treatment, storm water drainage system, solid waste management, telecommunication network, and transportation network.
Bangalore Water Supply and Sewerage Board (BWSSB) is the parastatal agency responsible for drinking water supply, and wastewater collection and treatment in the city. Bangalore is on a ridge and does not have its own year-round sources of water. Drinking water is pumped from the river Cauvery, a distance of about 100 km over an elevation of 500 m with an energy expenditure of 75 MW for approximately 900 million litres per day (MLD). Apart from the river Cauvery supply, ground water and water from the river Arkavathy are also tapped. However, while water supply distribution is 100 percent in the former Bangalore City Corporation limits, only about 20 % of the Municipal Council households are serviced. In view of the rapid growth of the city, and recent notification of Greater Bangalore, it remains a challenge to service the remaining areas.
Regarding collection and treatment of wastewater, the sewerage system is based on the city’s four natural river valleys already noted and BWSSB is the nodal agency. There are three major treatment plants with a total capacity of about 450 MLD (the outlets of Koramangala and Challaghatta valleys are combined to form the K&C Valley Treatment Plant at Bellandur). Wastewater stress on natural water bodies is evident from the fact that the present wastewater treatment capacity in the city is around 450 MLD as against an estimated generation of domestic wastewater of 700 MLD. Although more secondary wastewater treatment plants are in progress, they are yet to be completed. Another problem is the frequent clogging of storm water drains, resulting in pollution of natural water bodies. Hence it is now proposed to rehabilitate and remodel all the major trunk sewers to prevent any discharge into the storm water drains.
Addressing mobility in Bangalore city, an overview of transportation and traffic reveals the following facts. Bangalore city is estimated to have vehicle population of about 2.6 million while the current city population is about 7 million. The vehicle to person ratio is far higher than any other city in India. This has led to increased congestion in road networks across the city and frequent traffic jams. Manning signalling at traffic islands have also become unmanageable with the amount of traffic plying across junctions. Again, in this sector different components related to mobility are vested with different parastatal bodies.
Public transportation forms one of the key functionalities for mobility in any urban area. In Bangalore where the working population is around 2 million, the Bangalore Metropolitan Transport Corporation (BMTC) operates on any given day with 4,144 schedules, 4,262 buses, 60,475 trips, and carries 3.5 million passengers. It earns Rs. 20.5 million per day and pay Rs. 0.955 million to the government as taxes (Bangalore Metropolitan Transport Corporation, 2006). Further, according to recent estimates, there are about 1.6 million two-wheelers, 0.32 million motor-cars, 80,000 auto-rickshaws, and 0.17 million other vehicles totalling to around 2.2 million vehicles on road (Regional Transport Office, 2006).
The onus of maintaining and improving road networks lies with the Corporation. Although a study for the City by consultants iDeCK and Rites (2005) identified 52 high and medium traffic intensity corridors requiring various interventions by different organisations, the former City Corporation proposed only to widen some of these roads. A key aspect ignored while addressing mobility is the role of land use in generating traffic demand. Failure by the city to acknowledge this, and in particular the implications of changes in land use from residential to commercial or industrial, has led to stereotypical approaches in addressing mobility such as road widening, creation of new flyovers and underpasses, or conversion into ‘one-ways’. In general Bangalore has over a period promoted mixed land use which at some level has led to inefficient usage of land. With the City’s compartmentalised approaches to widening of roads or construction of flyovers and grade separators, the problem of mobility is far from being solved.
Issues in Planning and Development
To understand the development characteristics of the Bangalore metropolitan area, it may help to distinguish three concentric zones – zones which correspond closely with previous current local authority areas. The first zone would comprise the erstwhile city corporation area of 226 sq. km. The second zone would include the areas of the former 8 neighbouring municipal councils and 111 villages, which together form the peri-urban areas and are now incorporated into the Greater Bangalore City Corporation. The third zone would include other villages extending up to the Bangalore Metropolitan Area limits as proposed by Bangalore Development Authority. The development characteristics and agencies across these zones are summarised in Table 4 and depicted in Figure 1.1.
Table 4: Development Characteristics across Bangalore
| Characteristics |
Development Zones |
| Zone 1 |
Zone 2 |
Zone 3 |
| Authority |
Greater Bangalore City Corporation (formerly Bangalore City Corporation) |
Greater Bangalore City Corporation (formerly 8 municipal councils ) and 111 Villages) |
Development Authorities and other Town and Village Municipal Councils |
| Urban Status |
Core city |
Outgrowth |
Potential areas for future outgrowth |
| Infrastructure Services |
Present, but nearly choked, needs augmenting of existing infrastructure |
Not fully present, with new growth, requires planning and augmentation of infrastructure |
Farmlands and scattered settlements with minimal no infrastructure |
| Impact of growth |
No scope for new growth but calls for urban renewal to ease congestion, etc |
High potential for growth since already peri-urban area and emergence of new residential layouts and other developments |
Mostly rural, with minimal growth currently, but potential for future growth |
| Planning, Development and Regulation Controls |
Corporation operates building controls. Planning vested with BDA. |
Corporation operates minimal building controls. Planning vested with BDA. |
Planning vested with parastatal agencies: BDA and BMRDA and not other local bodies. No regulation on building/construction |
Traditionally, planning has been restricted to land use planning, being vested with BDA for the region under Bangalore urban agglomeration, and with Bangalore Metropolitan Region Development Authority (BMRDA) for the larger peripheral area comprising the rest of Bangalore Urban District8. BDA obtains the land, develops it as residential layouts which eventually are handed over to the city corporation, often involving the extension of city limits. Land use plans are formalised through the Comprehensive Development Plans (CDP) prepared every 10 years. Accordingly, the last CDP, prepared in 1995 for the period up to 2011, was revised in 2005-06 for the period up to 2015 (BDA, 2006) and is currently awaiting approval. A key aspect of these CDPs are that they indicate the amount and location of land use allocated for various uses (like residential, commercial, industrial, etc.) as well as restricting development in specific areas demarcated as Green Belt and Valley Zones. However, another organisation similar to BDA, the Karnataka Industrial Area Development Board (KIADB), is responsible for development of industrial areas. These industrial estates are situated for the most part in the outskirts of the city and KIADB has powers under the law to take over agricultural lands for the purpose.
Generally, however, the regulation and enforcement of land use zoning regulations are dismal, leading to a large number of illegal developments and encroachments on public land – problems which have led Karnataka State to constitute a legislative committee to look into irregularities in and around the city. In the particular case of growth occurring around outer industrial areas, the urban local bodies are generally unable to provide basic infrastructure and services, thus further aggravating inefficient utilisation of land and other natural resources. With such instances prevailing especially in the areas of the former Municipal Councils, the new Corporation faces a great challenge to deliver basic infrastructure and services.
On 3rd December 2005, the Ministry of Urban Development, Government of India, launched the Jawaharlal Nehru National Urban Renewal Mission (JNNURM). This countrywide programme addresses renewal of urban areas for 63 cities encompassing nearly 70% of total urban population, its primary aim being to link the revitalisation of urban infrastructure with a specific agenda of institutional reforms. Bangalore is one of the beneficiaries under this programme with an estimated outlay of US $ 1.7 billion over the next six years. The key mission of this programme is to support reforms-driven, fast track, planned development with focus on improving efficiency in urban infrastructure and service delivery mechanisms, through community participation and ensuring accountability of urban local bodies and parastatals towards citizens. JNNURM is made operational with two sub-missions:
- Urban Infrastructure and Governance (UIG)
- Basic Services to Urban Poor (BSUP)
The sub-mission on UIG focuses on major infrastructure projects for water supply, sanitation, sewerage, solid waste management, road network, urban transport and redevelopment of inner (old) city areas with a view to upgrading infrastructure therein, shifting industrial and commercial establishments to conforming areas, etc. The sub-mission on BSUP focuses on integrated redevelopment of slums combining housing, water supply, drainage, storm water drains, solid waste management, street lighting, and community halls.
In accordance with the JNNURM guidelines, the erstwhile Bangalore City Corporation prepared the City Development Strategy Plan (CDSP) for both UIG and BSUP (Bangalore Mahanagara Palike, 2006). The CDSP outlines only an investment plan and financial strategy for taking up various initiatives envisaged in the mission. Under BSUP, 218 declared slums in the former City Corporation limits would be taken up by KSCB for redevelopment. Further, there are 169 slums under the erstwhile City Corporation jurisdiction that remain undeclared, which would be redeveloped by the new Corporation. There are, in addition, 155 slums in the neighbouring former municipal council areas that would be redeveloped by the new Corporation and KSCB. However a draft community participation law has not been enacted and in Karnataka State most of the infrastructure projects and redevelopment plans have been administered by ULBs and parastatal agencies and not through community participation as envisioned by the mission. The result is a continuation of top-down rather than bottom-up modes of planning and delivering infrastructure and services. This calls for introspection on the implementation and achievement of the mission objectives. However, with various initiatives under JNNURM underway, it does offer hope, and perhaps promise, and in improving the essential urban infrastructure and services in city.
Conclusion
Bangalore, with all due respect to its status as ‘Silicon Valley’ and ‘Garden City’, faces real challenges in terms of addressing and delivery of basic infrastructure and services to all its stakeholders. In spite of numerous initiatives and activities envisaged by the urban local bodies, past and present, and by parastatal bodies, the rationalisation of geographical units for these activities could mark the beginning of a coordinated effort in addressing the needs of the city. In the wake of recent notification of Greater Bangalore City Corporation and initiatives under JNNURM, Bangalore is currently experiencing a strange transformation. Bangalore also stands out as a beacon of globalising world and to sustain this, it needs to systematically address the key challenges facing the city in terms of governance and infrastructure.


