City Infrastructure with special reference to Drainage
BANGALORE ROADS
Bangalore population has been growing at a rate of 2.8 to 3.20% per year during the last two decades. There has been a phenomenal growth in the population of vehicles as well especially the two and four wheelers in this period due to rising household incomes consequent to IT sector boom in the region. The number of motor vehicles registered has already crossed three millions. The issues relating to traffic and transportation in a large and growing city like Bangalore need to be viewed in the larger perspective of urban planning and development. Issues relating to land use planning and development control, public-private transportation policy, industrial locations and IT corridors would need to be integrated at the perspective planning level.
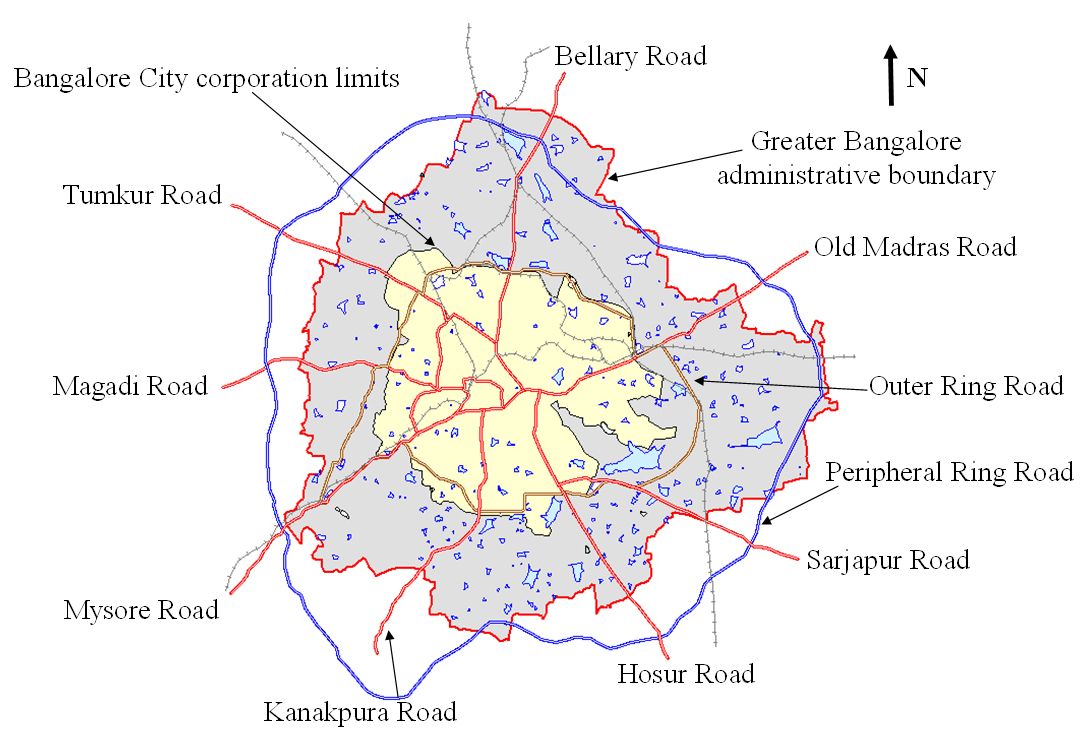
Bangalore's road network exceeds 3,000 km and consists of ring roads, arterial roads, sub-arterial roads and residential streets. The city road network is mainly radial, converging in the centre. The main roads of Bangalore coming into the city include Bellary Road in the north, Tumkur Road and Mysore Road in the west, Kanakpura Road and Hosur Road in the south and Airport Road and Old Madras Road in the east (Figure 7.2, and 7.1) . Many of Bangalore's erstwhile colonial and town streets were developed into commercial and entertainment areas after independence. The B.V.K Iyengar Road became the retail hub of Bangalore, while MG Road, Commercial Street and Brigade Road became important shopping, recreation and corporate areas . Consequently, traffic increased exponentially, especially on MG Road, which forms the main artery for the city's east-west traffic. But for MG Road, other roads in and around the erstwhile Parade Ground remain narrow, winding roads. Road network capacity is inadequate. Most of the major roads are with four lane or less with limited scope of their widening. This indicates the need for judicious use of available road space.
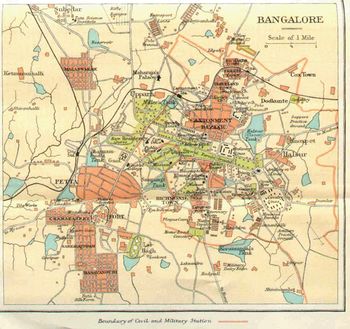
Figure 7.1: Road network in erstwhile Bangalore (Source: Murray's 1924 Handbook)
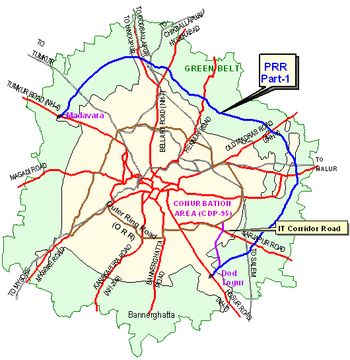
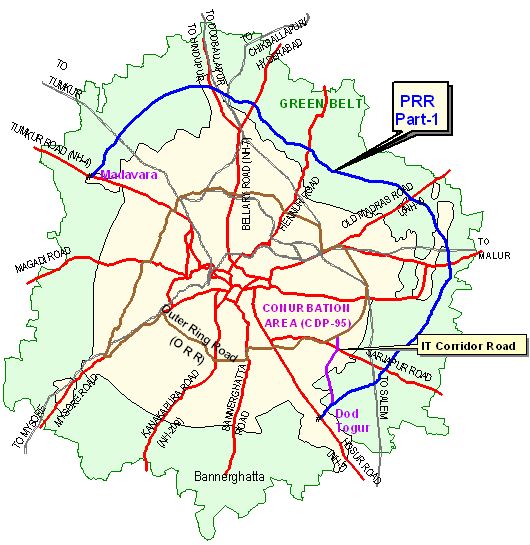
Figure 7.2: Road network as on 2007 (source: www.bdabangalore.org)
The maintenance and construction of roads to address the growing traffic in the city has been a challenge to the BDA and the BBMP. Development of the city road infrastructure has revolved around imposing one-way traffic in certain areas, improving traffic flow in junctions, constructing ring roads, bridges, floyers and other grade separators. Six high volume junctions were identified for improvements, through a private public partnership involving corporate sponsors and various state government agencies, such as the Siddapur Road and Hosur Road junction, sponsored by Infosys and the Airport Road and Intermediate Ring Road junction. Flyovers were constructed in the city to ease traffic congestion. Newer flyovers were planned for the city for 2006 and beyond (http://en.wikipedia.org/wiki/Infrastructure_in_Bangalore). Area of the BMP has been increased as per Revised Master Plan-2015. This plan has provided for densification of existing areas, Mutation corridors, hitech areas etc in various parts of the city. This is likely to have a major impact on traffic demand. The transport network including mass transport system needs to be planned taking the proposed development in to consideration.
SOLID WASTE MANAGEMENT
The city is facing acute problems related to solid wastes. This is despite the fact that the largest part of the municipal expenditure is allotted to management of municipal solid wastes. The current waste generation in Bangalore is 3613 tonnes per day and the number is likely to grow in the next few years due to the increasing population and will present a formidable challenge to authorities unless an integrated approach is taken. The objective of this paper is to present an overview of the current waste management practices in Bangalore and to discuss suitable methods to overcome the constraints. This paper was built up on various interviews conducted with the authorities and of experiences and observations (Ramachandra, 2006; Ramachandra and Saira Varghese, 2003).
An overview of the current waste management practices in Bangalore
Bangalore City is divided into 100 administrative wards, which have been further divided into 273 health wards for functional convenience (Ramachandra and Saira Varghese, 2003). Of these, 147 health wards are under private contract system and the remaining 126 health wards are managed through Pourakarmikas (municipal sweepers) of the Corporation. Except for few wards in Bangalore there is no door-to-door collection service in Bangalore. The areas not served are mostly unincorporated or illegal settlements and slum areas with small and inaccessible streets. By contrast more prosperous areas are better served, kept clean and swept on a regular basis.
Waste generation: The waste generation in Bangalore is given in Table 4.1:
Table 4.1: Waste generation in Bangalore
| Stakeholders |
Quantity of Waste
(tonnes/day) |
% |
| Households |
650 |
18 |
Commercial Establishments
1. Markets
2. Hotels |
1436
369
1067 |
39 |
Institutes
1. Hospitals
2. Offices
3. Educational institutions |
128
20
16
92 |
4 |
| Industries |
1399 |
39 |
| Total |
3613 |
100 |
Source: Beukering, et al., 1999
As evident from the table, wastes from commercial establishment make up for the bulk of the total wastes. Although industries also generate a significant amount, it was analysed that most of this is recovered for recycling and reuse and only a small percentage find it’s way into the city waste stream.
A typical waste composition for major Indian cities is given in Table 4.2
Table 4.2. Composition of urban solid waste in Indian cities (percentage by weight)
| City |
Paper |
Metals |
Glass |
Textiles |
Plastic1 |
Ash, dust |
Organics |
Others2 |
| Chennai |
5.90 |
0.70 |
- |
7.07 |
- |
16.35 |
56.24 |
13.74 |
| Delhi |
5.88 |
0.59 |
0.31 |
3.56 |
1.46 |
22.95 |
57.71 |
7.52 |
| Kolkota |
0.14 |
0.66 |
0.24 |
0.28 |
1.54 |
33.58 |
46.58 |
16.98 |
| Bangalore |
1.50 |
0.10 |
0.20 |
3.10 |
0.90 |
12.00 |
75.00 |
7.20 |
| Ahmedabad |
5.15 |
0.80 |
0.93 |
4.08 |
0.69 |
29.01 |
48.95 |
10.39 |
| Mumbai |
3.20 |
0.13 |
0.52 |
3.26 |
- |
15.45 |
59.37 |
18.07 |
Source: Planning Commission on “Urban Solid Waste Management in India’, GOI (1995), The expert Committee,2000
1 Includes rubber and leather
2 Includes bones, stones and wooden matter
As evident from the Table above, the composition of organic waste is high in all the cities and Bangalore ranks the highest. Waste densities and moisture contents are high, which require different technology and management system. High organic content and low biodegradable waste are typical of Indian cities and hence incineration is a less appropriate option.
Waste storage: Waste is stored in 14,000 bottomless and lidless cement bins having 0.9 meters diameter and 0.6 cubic meter storage capacity and large masonry bins for depositing waste placed at a distance of 100-200 meters. Recently 55 metal containers have been placed at different parts of the city. However not all parts of the city are provided with storage systems. In some places, the wastes are just deposited on roadsides.
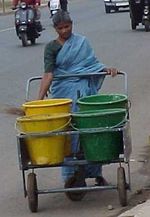
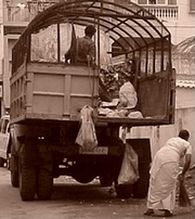
Waste collection and transport: Collection of waste is either done by Bangalore Mahanagara Palike (BMP) or by private contract system. In December, 2001 BMP and Bangalore Agenda Task Force (government appointed body) through a joint initiative established a public private partnership, by launching a sustainable cleanliness program called ‘Swachha Bangalore’. Twenty five percent of the city is served under this scheme. Swachha Bangalore is mainly door to door collection of wastes using pushcarts (Plate 2.1). There are totally 2105 pushcarts in operation in Bangalore, which consists of 4 buckets that are used to store dry wastes and wet wastes separately. Swachha Bangalore scheme also covers selected slum areas and auto tippers have been deployed for collection of wastes (Plate 2.3). There are 6500 pourakarmikas in charge of door to door collection, sweeping, emptying dustbins and clearing black spots. They arrive at a designated spot to transfer the waste to the truck. Trucks have a capacity of 4-5 tonnes capacity and are either openbodied or covered with a mesh (Plate 2.2). The ratio of truck to ward is 4:20. Other collection systems consist of bullock carts, tricycles etc. Collection is sometimes difficult due to narrow roads and due to this waste is not picked on time causing unsanitary conditions. There are no transfer stations in Bangalore.
Plate 2.1. Pushcart Plate 2.2. Waste transfer Plate 2.3. Auto tipper

Transportation of wastes to disposal site is done in two ways through the same trucks.
- by engaging 82 trucks of the corporation;
- through contractors by engaging 129 vehicles for layouts and markets and 72 vehicles on contract for transportation of waste.
The corporation also has 13 dumper placers for transporting metallic containers of 2.5 to 3 tonnes capacity and 6 minicompactors for transportation of wastes.
Waste processing and recovery: The method adopted to process waste is composting. Karnataka Compost Development Corporation handles 120 metric tonnes of raw garbage/day in the yard. Out of 100 tonnes of raw garbage, 55 tonnes of compost is obtained. Due to constraints of land, finance and demand, the facility can handle only 120 tonnes of wastes. As such out of the 369 markets in and around the city, only 2 have been accepted for composting. Vermicomposting is also practised to handle a portion of the waste. Dry wastes such as plastic, rubber, glass and other contraries are later disposed off.
Waste disposal: Disposal is the final stage of waste management system. About 90% of the municipal wastes collected by the civic authorities in Indian cities are dumped in low-lying areas outside the city/town limits. The waste disposal trends in major Indian cities are as given in Table 4.3.
Table 4.3. Waste disposal trends in India
| Waste disposal methods |
1971 – (40 cities) |
1991 and 1999 (23cities) |
| Land dumping |
Almost all |
89.8% |
| Composting |
- |
8.6 % |
| Others (pelletisation, vermi-composting) |
- |
1.6 % |
In Bangalore, the waste collected from roads and bins is directly transported to the final disposal site, usually an open dump. There is the likelihood of soil and groundwater contamination due to this practice. Birds (scavengers), vermin, insects and animals are attracted to the open dump for feeding and breeding. Since many of these may act as disease vectors, their presence may constitute a potential health problem. Sometimes plastic and other contraries are burnt, which may be hazardous to human health. Landfilling of wastes is not practiced in Bangalore. Figure 7.3 provides information on the various SWM options in Bangalore. Recycling takes up 43% and is an area to be further exploited. Thirty one percent of the waste is disposed, which is mainly burnt or simply dumped in open spaces.
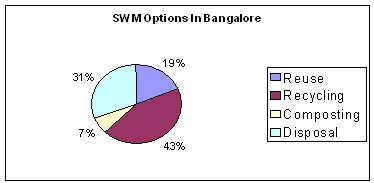
Figure 7.3: SWM Options in Bangalore
Under the Central Government Municipal Solid Wastes (Management and Handling) Rules, 2000, gazetted in India on 25th September 2000, all municipal authorities must:
- Provide a waste collection service to all domestic dwellings, including slums and squatter areas, and commercial premises (note that no distinction is drawn between urban and rural areas).
- Provide waste storage facilities which do not create unhygienic and unsanitary conditions;
- Remove waste stored in the above facilities on a daily basis and in a manner such that manual handling by sanitary workers is avoided; and
- By no later than the end of 2003, establish waste processing facilities and landfills at which:
- the biodegradable fraction of municipal solid waste is only processed by biological conversion technologies; and
- landfilling is restricted to non-biodegradable, inert waste and other waste that is not suitable either for recycling or for biological processing.
It is apparent that none of these, are presently being met in a satisfactory way in Bangalore. In this regard, recommended waste storage, segregation and collection, treatment and disposal (Ramachandra and Shruthi, 2007) are:
- Adoption of door-to-door collection service daily, in all urban areas, including slums, where practical and affordable to do so. The household waste storage bins are collected, emptied and returned by the sanitary worker from the front of the residential premises at a predetermined period of the day (i.e. morning or afternoon) and day of the week. Community waste storage system in all markets, commercial and industrial premises, and domestic premises where it is either not practical or affordable to provide a door-to-door collection service. This will probably include multi-storey dwellings and rural areas where population densities are low. These containers are positioned to ensure convenience to users, particularly women who are the primary users, and hence minimise illegal littering and dumping practices. Segregation of waste at source in domestic, markets, restaurants and hotels and other commercial and industrial premises where biodegradables constitute a major component of the waste stream into wet and dry fractions.
- A network of local and regional waste modular transfer stations is established throughout the region and municipal solid waste is hauled in bulk from these transfer facilities to the closest regional waste processing facility.
- Decentralised biological treatment facilities are established and operated by the community based organizations at local levels (with the technical and financial support) where it complements the formal systems. Further expansion of the Karnataka Composting Development Corporation (KCDC) biological processing facilities are undertaken and similar units be initiated in other parts (Figure 7.4). Landfills are established close to biological processing facilities for disposal of waste processing rejects and other wastes not suitable for recycling.
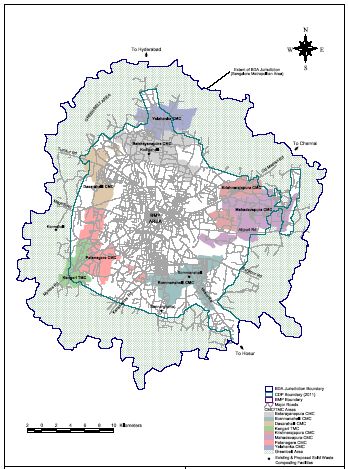
Figure 7.4: Road network in core area and CMC’s with SW treatment facilities
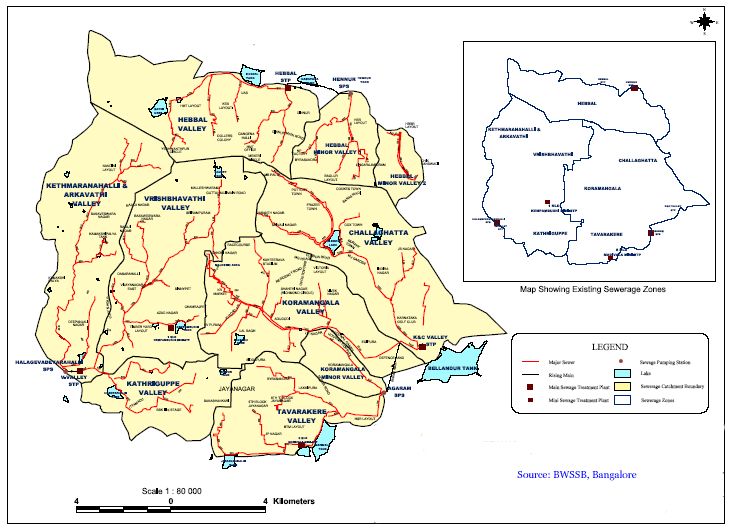
SEWAGE SYSTEM
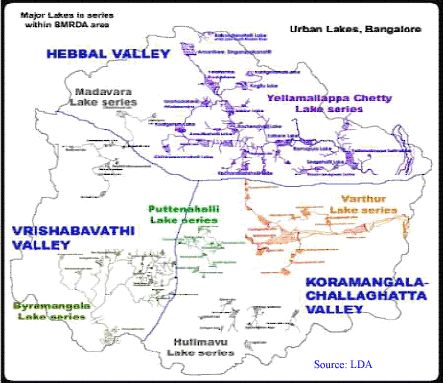
Bangalore is located over ridges and the city’s topography is characterized by a series of well defined valleys which radiate from a ridge (Figure 3) of high ground to the north of the city and fall gradually towards a wide belt of flat cultivated land extending beyond the limits of the BMP boundary to the south. Four major watersheds are Hebbal, Koramangala, Challaghatta and Vrishabhavathi. Three of the valleys, Vrishabhavathi (V-Valley), Koramangala (K) and Challaghatta (C), run generally in a north to south direction and divide the greater part of the metropolitan area which lies to the south of the ridge into three separate and distinct drainage zones. A fourth major valley, referred to as the Hebbal series, forms the drainage zone to the north of the ridge and runs in a north-easterly direction. Five minor valleys, the Kathriguppe and the Tavarakere to the south, the Arkavathi and Kethamaranahalli to the north-west, and the Marthahalli to the east, lie outside the tributary areas of the major valleys and these drain independently the fringe areas which form the remainder of the metropolitan area. Table 5 lists the major and minor valley with the respective catchment area (BWSSB, 2003).
Table 5: Major and Minor Valleys in the core area of the city
| Sewerage Zone |
Major Valley(s) |
Area (km2) |
Minor Valley(s) |
Area (km2) |
Vrishbavathi
(V – Valley) |
Vrishbavathi |
38 |
Katrhiguppe
Kethmaranehalli &
Arkavathi |
16
35 |
Koramangala and Challagatta
(K&C Valley) |
Koramangala
Challagatta |
71 |
Tavarekere |
19 |
| Hebbal |
Hebbal |
32 |
Hebbal I |
11 |
History of sewage systems in Bangalore: Plague outbreak in 1889 forced the town administration authorities to provide wider roads, open drains and sewage carrier lines. Localities such as Basavanagudi and Malleswaram were provided with conservancy roads and a good network of drains. The system for the conveyance of domestic and industrial waste was established in Bangalore in early thirties, which was initially confined to the densely populated old parts of the city. Following completion of the Thippagondanahalli reservoir in 1940’s, the extension accelerated. The old city and 60% of the former Civil and Military area had been sewered by 1960’s, and about 60,000 connections had been made to the sewers. Then followed the major sewerage development under the first three phases of the Cauvery project (CWSS), extending from the mid-1970’s to late 1990’s.
Coverage of Sewerage in Bangalore: The sewerage system in Bangalore has been guided by the nature of the topography formed by natural ridges and valleys and sewers were laid along natural channels to save on pumping costs. The sewerage system covers about 229 km2 and is made up of four principal drainage areas (major valleys) which drain to three wastewater treatment plants. Sewage flows from three of five minor valleys are intended to be treated at two of these treatment plants. The existing sewage system is given in Figure 8.1 and Figure 8.2 shows the drainage zones together with the major sewer system (sewers of 450mm diameter and above).
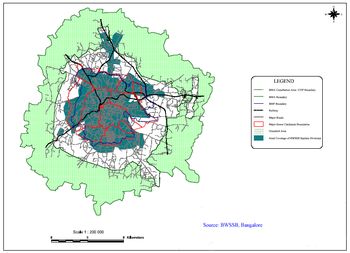
Figure 8.1: Major sewer system in Bangalore core area

Figure 8.2: Drainage zones with major sewers
Sewerage and sewage treatment provided under CWSS Stages I, II & III since the 1970’s in four major valleys (Vrishabhavathi, Challaghatta, Koramangala and Hebbal) and five minor valleys (BWSSB, 2003). Wastewater from the two major valley zones of Koramangala and Challaghatta is collected and treated at K&C Valley STP at the southern extremity of the same zone on the northern edge of Bellandur Tank. The Taverekere Minor Valley is also a part of the contributory area of this treatment plant. The Vrishabhavati Valley zone is part of a contributory area to the V-Valley STP in the south-west of the city which includes the minor valleys of Arkavathy and Ketmaranahalli (A&K) and Kathriguppe. The Hebbal zone to the north is served by a sewage treatment plant near the Nagavara tank; it has an associated minor valley to its east.
- Main and sub-main sewers were laid along the major valleys (V-Valley, K-Valley and C-Valley); and sewage treatment plants providing primary treatment only were constructed for the V-Valley (123 MLD) and K&C valley (163 MLD) catchments under CWSS Stage I.
- Main and sub-main sewers were constructed in the minor valleys from 1981 to 1984 (K&A, Kathriguppe and Tavarakere); main and sub-main sewers were laid in Hebbal (1982 – 1984); a 60 MLD sewage treatment plant was constructed at Hebbal (1989 - 1999); the V-Valley STP was expanded from 123 MLD to 180 MLD (1990 to 1999) and secondary treatment added; and secondary treatment was added at the K&C STP (1989 – 1999) (without increasing overall capacity but with screens and detritors sized for 218 MLD) under CWSS Stages II & III.
- Under Cauvery IV Phase I, trunk sewers, pumping stations and seven sewage treatment plants in eight zones, will serve the peripheral area of the city, the zone between the outer boundary of the existing sewerage catchments and the BMA conurbation boundary.
Most part of the sewerage system operates under gravity in the drainage zones, while three pumping stations have been deployed to pump flows from the minor valleys to the main valleys: Halagevadeyarahalli SPS in the south-west of the city serving the A&K Minor Valley; Hennur SPS in the north-east (Hebbal); and Agaram SPS in the south which serves Tavarekere Minor Valley and part of the Koramangala Valley.
Bangalore is currently served by three major sewage treatment plants, all providing secondary treatment, with a combined capacity of 403 MLD. Two recently constructed much smaller plants (total capacity 9 MLD) also exist, these having been provided by BWSSB to rejuvenate lakes (BWSSB, 2003). The STP’s are:
- V-Valley STP, a plant first commissioned with primary treatment in 1974 (123 MLD), then upgraded in the 1990’s (commissioning in 1999) to 180 MLD with secondary treatment by trickling filters. This plant serves V-Valley and the Kathriguppe and K&A minor valleys;
- K&C STP, a plant also constructed with primary treatment only in the 1970’s (163 MLD), then upgraded to secondary treatment by activated sludge in the late 1980’s (commissioning 1990). This plant serves the Koramangala and Chalaghatta valleys and Tavarakere minor valley;
- Hebbal STP, a 60 MLD plant with secondary treatment provided by activated sludge, commissioned in early 1999. This plant serves the Hebbal Valley catchment as well as a minor catchment served by Hennur SPS;
- Madivala STP, an 8 MLD ultimate capacity plant in the Tavarakere Minor Valley which provides treatment by UASB and oxidation ponds, the treated effluent providing rejuvenation to Madivala Tank. The plant has been operating for nine months; and
- Kempambudhi STP, a 1 MLD plant in V-Valley which treats sewage to secondary standard using the extended aeration process ; the treated effluent will rejuvenate Kampambudhi Tank.
Major problems in these sewer systems are:
- encroachment of sewers by buildings preventing access for maintenance;
- siltation of sewers, unrepaired broken pipe bridges – with sewage discharging to the drains;
- sewer crown corrosion leading to sewer collapses;
- poor design and construction standards- lack of conformance to Indian Standards (CPHEEO) on the current sewer laying contracts in the primary drain of V-Valley
- sewage diversions by farmers for irrigation purposes in the V-Valley and Kathriguppe valleys.
STORMWATER SYSTEM
Four major storm water catchment systems (Vrishabhavathi Valley; Challaghatta Valley; Hebbal Valley; and Koramangala Valley) pass from the city’s ridge in the north to an enclosed lake system at the perimeter of Bangalore (Figure 3). Waterbodies are part of these four major waterways “valley” systems, which drain the majority of the city’s storm water to large tanks or lakes, which were traditionally used for recreation and water supply for irrigation. These waterways with interconnected lakes in addition to their primary function as flood carriers, have provided the city with reasonable ecological and recreational values. The urban growth in recent times, not guided by strong strategic planning or development control measures to minimise the impacts on existing infrastructure, on the surrounding environment, and in particular on the storm water system, had severe impacts on waterways. This has lead to the depletion of waterways in addition to pollution and wastewater discharge to the storm water system.
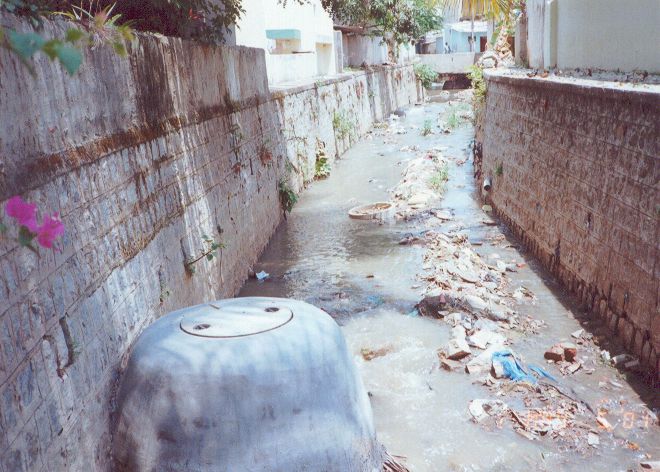
One of the main problems that characterises the storm water system in Bangalore is that the larger sewer pipes are frequently located in the drainage channels (Plate 2.4). This has lead to the significant reduction in the storm water system with obstruction from sewers and also from the sewer manholes. These sewer manholes and other structures cause significant turbulence and redirection of the storm water flows, during high storm water flows, resulting in erosion of the bed and bank instability (Plate 2.5). This also restrict drainage rehabilitation and maintenance works, including stabilisation, widening and de-silting activities. Manholes in drainage channels trap significant amounts of solid waste as well as localised sediment deposit due to the reduction in velocity of flows. In addition to this, sewer maintenance and construction in the drainage channel contributes major quantity of sediment. During periods of high storm water flows, floodwater sometimes back-up into houses through the sewer connections.
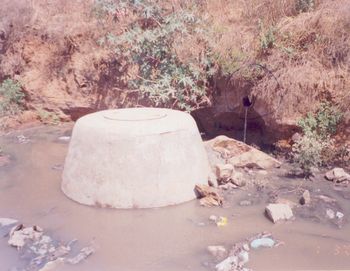
Plate 2.4: Manhole and a sewer connection – obstruction as well as pollution (Source: BWSSB)
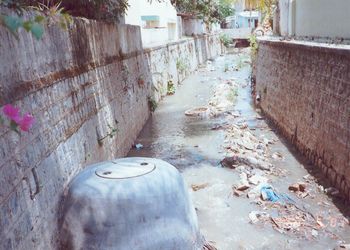
Plate 2.5: Sewer manhole and dumping of solid waste – reducing channel section (Source: BWSSB)
Road drains typically consist of a box shaped trench on either side of the road, covered by slabs in the core areas of the city. The inlet pits consist of an open pipe or hole in the side of the road, with no grating covers. These inlets are generally not located in the lowest point in the road and are slightly above the road gutters, which results in ponding in low lying areas before storm water flows into the drains. These roadside drains connect to secondary drains and finally to the main open channel drains. Main drains consist mainly of open channels lined with concrete retaining walls, especially in the built up area. The levels of service provided by drains has diminished in most areas due to increasing degrees of imperviousness and encroachment on drainage waterways by building, roads, culverts and other infrastructure, such as sewers (BWSSB, 2003).
Flooding is a wide-spread problem through-out the drainage system due to lack of drainage upgradation consequent to the increase in impervious area due to land use changes in the catchment from open space to high-density urban developments. This is compounded by the encroachment of drains and filling in the floodplain on the waterways, obstruction by the sewer pipes and manholes and relevant structures, deposits of building materials and solid wastes with subsequent blockage of the system and flow restrictions from under capacity road crossings (bridge and culverts).
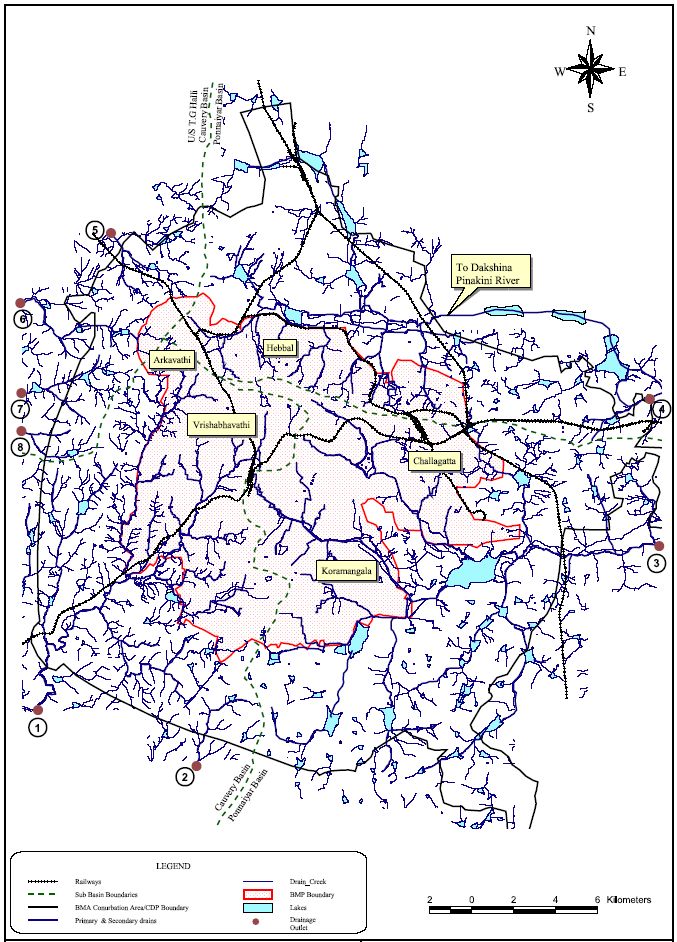
DRAINAGE SYSTEM
Lakes and wetlands are an essential part of human civilization meeting many crucial needs for life on earth such as drinking water, protein production, energy, fodder, biodiversity, flood storage, transport, recreation, climate stabilisers and also they aid in improving water quality by filtering sediments and nutrients from surface water. Wetlands play a major role in removing dissolved nutrients such as nitrogen and to some extent heavy metals (Ramachandra, 2002). They are getting extinct due to manifold reasons, including anthropogenic and natural processes. Burgeoning population, intensified human activity, unplanned development, absence of management structure, lack of proper legislation and lack of awareness about the vital role played by these ecosystems are the important causes that have contributed to their decline and loss. Identifying, delineating and mapping of wetlands on temporal scale provide an opportunity to monitor the changes, which is important for natural resource management and planning activities (Ramachandra et al., 2002). Bangalore is situated on the divide between the Cauvery Basin and the Ponnaiyar, with approximately 50% of the existing population concentrated within the Cauvery Basin. There are three major drainage outfalls and five small outfalls from the Conurbation Area as shown in Figure 9 and listed in Table 6. The unsanitary conditions created by large volumes of raw, or partially treated, sewage and dumping of large volumes of solid wastes including building debris have seriously impacted the drainage system.
Table 6: Drainage Catchments with valley gradients
| Catchment names |
Municipalities in Catchment |
Typical Valley Gradients |
| Upper |
Middle |
Lower |
| Arkavathi & Vrushabhavathi (V) Valley |
BMP, Kengeri TMC, Patnagere CMC |
1 in 60 |
1 in 200 |
1 in 120 |
| Koramangala, (K) Tavarakere (K& C) Valley |
BMP, Bommanahalli CMC, Mahadevpura CMC, |
1 in 270 |
1 in 980 |
1 in 710 |
| Challagatta (C) Valley |
Krishnarajpura CMC |
1 in 210 |
1 in 640 |
1 in 430 |
| Hebbal |
BMP, Krishnarajpura CMC, Batarayanpura CMC, Yelahanka CMC |
1 in 230 |
1 in 700 |
1 in 450 |
| Minor (to TG Halli Reservoir) |
BMP, Dasarahalli CMC, Batarayanpura CMC |
Note: Drainage catchments do not coincide with sewerage valleys of the same name
Lakes constructed for agricultural and water supply have suffered in the transition to an urban environment. These lakes provided flood prevention by storing excess flows, slowing down the passage of flood waters and protecting the downstream waterways from erosion and flooding caused by the urbanisation of the catchments. They allowed an opportunity for storm water to percolate to aquifers to supplement groundwater resources (Ramachandra and Uttam Kumar 2008). Now, lakes original function of water supply have been impaired due to dwindling number and size, depleting functions of remaining waterways due to reduced widths, conversion to hard lined drains and to pollution from wastewater discharges, solid wastes and a generally high silt load. Increasing development pressures within the core area have been accompanied by a general neglect by private and public institutions of even the basic flood protection function of drainage system (Ramachandra, 2006 and 2007).

Figure 9: Drainage system in Bangalore (Source: BWSSB)
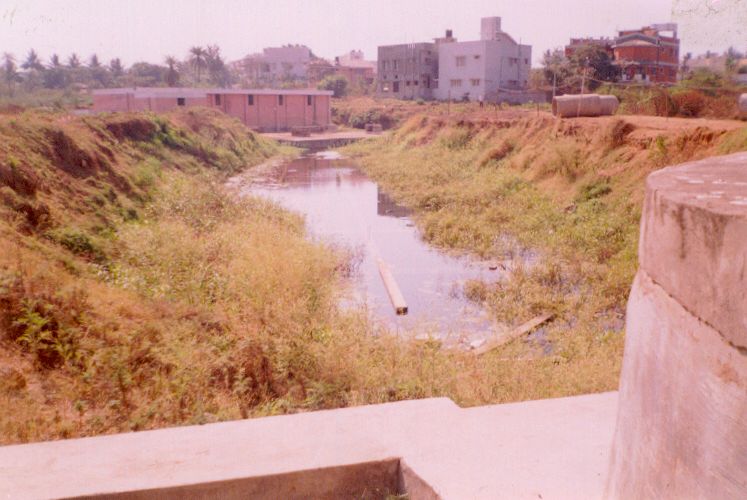
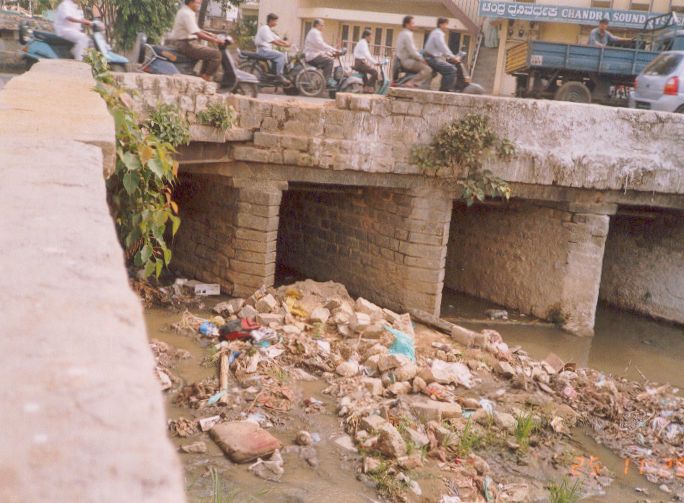
An important function of drainage is to minimise flood damage and as per the estimates by BWSSB for Koramangala Valley the extent of flooding as 8.8 sq. km/year on average (Ashwathnarayana, 1999), would amount to 20 sq. km/year for the core area. Principal factors contributing to the flooding problem in Bangalore are unplanned urbanisation with mushrooming layouts (land development) and buildings with respect to easement provisions and floor level controls (Plate 2.6 and 2.7). Other related contributing factors are inadequate culverting at major and minor roads (Plate 2.8), obstructions by sewerage works in channels, restrictions caused by cross services (including water supply, power and telecom utilities), encroachment of buildings into waterways, dumping of solid wastes and accumulation of sediments in the drains and low design standards (Plate 2.9), combined with use of inappropriate data and analysis techniques. Low-lying and flood-prone lands are listed in Table 6.

Plate 2.6: Flood plain encroachment (Source: BWSSB)
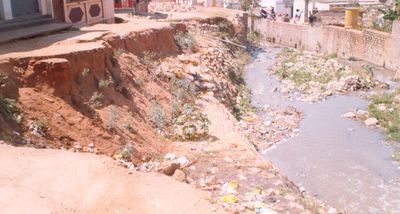
Plate 2.7: Bank erosion and instability due to modification in the floodplain
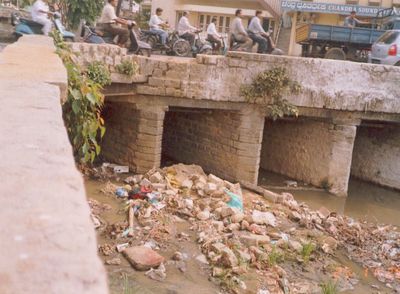
Plate 2.8: Reduced culvert capacity - dumping of solid waste and supports (Source: BWSSB)
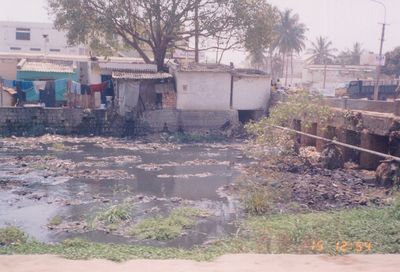
Plate 2.8: Reduced culvert capacity - dumping of solid waste and supports (Source: BWSSB)

Plate 2.8: Stormwater flow hindrance from water pipes, solid waste, reduced culvert capacity

Plate 2.9: Sewer manhole, solid waste and under capacity road crossing
Table 6: Low-lying and flood-prone regions
| Flood prone regions |
Ward No. |
| Koramangala Valley |
| City Market Area |
30 |
| Sulthan Palya Main Road |
28 |
| Jayanagar 3rd Block LIC Colony |
|
| Krishnappa Garden behind Byrasandra Tank D/s |
|
| Wilson Garden Area up to Bannerghatta Road |
63 |
| Arekempannahalli Area |
61 |
| Jurist Colony |
47 |
| Marehahalli Tank |
58 |
| Bismillanagar – Agencies |
67 |
| Pillappa Garden – Agencies |
63 |
| Ejipura |
69 |
| Koramangala Slum |
|
| Sampangiram Nagar |
77 |
| Wipro Junction |
|
| Hebbal Valley |
| Brindavananagar below Matthikere Tank Market |
2 |
| KEB Compound Maththikere |
4 |
| Tannerana Halli |
2 |
| Anandanagara |
96 |
| Ring Road |
96 |
| New – Bangalore Layout |
94 & 95 |
| Challaghatta Valley |
| Miller Tank, Chinnappa Garden |
|
| Shivajinagar, Munireddy Palya |
|
| Saraswathipuram – Jogu Palya |
|
| K R Garden |
|
| Vrushabhavathi |
| Gubbanna Layout |
22 |
| Shankarappa Garden Gopalapura |
25 |
| Cholurpalya |
32 & 33 |
| Bapujinagar |
42 |
| Minerva Mill |
33 |
| Dhovi Colony, near Sane Guruvanahalli Tank |
19 |
| Kamakshipalya Tank Slum Area |
18 |
| Binny Mill Tank Area |
30 |
| Markandayyanagar (near Binny Mill) |
31 |
| Sanjaya Gandhi Slum Area |
41 |
| Rudrappa Garden |
45 |
LAND-USE CHANGES
Land use is the use of land by humans, usually with emphasis on the functional role of land such as land under buildings, plantation, pastures, etc. Flows in the catchment were indirectly estimated by the land use area, runoff coefficient and precipitation. Land use pattern in the catchment has direct implications on hydrological yield. The yield of a catchment area is the net quantity of water available for storage, after all losses, for the purpose of water resource utilization and planning. Runoff is the balance of rainwater, which flows or runs over the natural ground surface after losses by evaporation, interception and infiltration [Ramachandra and Uttam Kumar 2008]. The runoff from rainfall was estimated by rational method that is used to obtain the yield of a catchment area by assuming a suitable runoff coefficient.
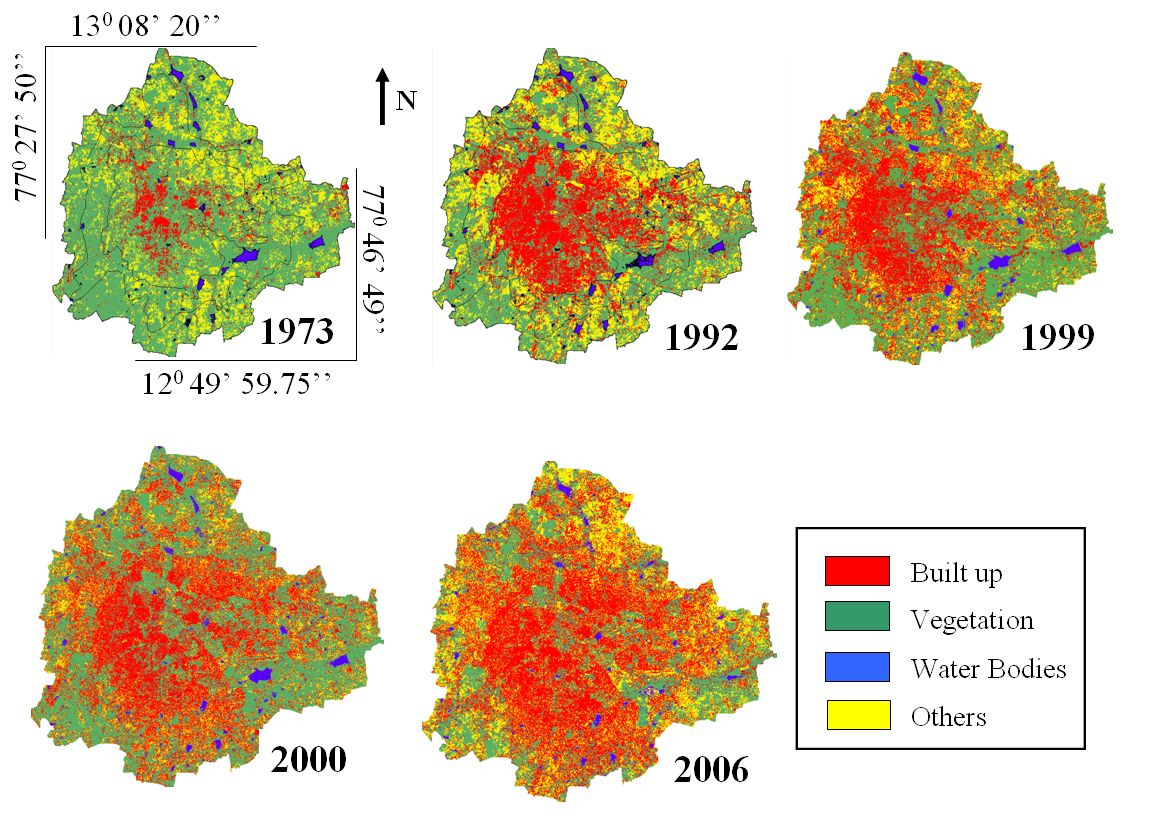
Land use analysis was done using temporal remote sensing data - Landsat data of 1973 (of 79 m spatial resolution), 1992 and 2000 (30 m), IRS LISS-3 data of 1999 and 2006 (23.5 m) and MODIS data of 2002 and 2007 (with 250 m to 500 m spatial resolution). The analysis was done with supervised pattern classifiers based on maximum likelihood (ML) estimation followed by a Bayesian statistical approach. This technique quantifies the tradeoffs between various classification decisions using probability and costs that accompany such decisions. It makes assumptions that the decision problem is posed in probabilistic terms, and that all of the relevant probability values are known with a number of design samples or training data collected from field that are particular representatives of the patterns to be classified. The mean and covariance are computed using maximum likelihood estimation with the best estimates that maximizes the probability of the pixels falling into one of the classes.
Data: Survey of India (SOI) toposheets of 1:50000 and 1:250000 scales were used to generate base layers of taluk boundaries, city boundary, drainage networks, and water bodies. Field data were collected with a handheld GPS. Remote sensing data (spatial and spectral resolutions are listed in table 1) used for the study are:
Supervised classification was performed using Bayesian classifier and was verified with field knowledge, visual interpretation and Google Earth image. The supervised classified images of 1973, 1992, 1999, 2000, 2002, 2006 and 2007 with an overall accuracy of 72%, 75%, 71%, 77%, 60%, 73% and 55% were obtained by using the open source programs (i.gensig, i.class and i.maxlik) of Geographic Resources Analysis Support System (http://wgbis.ces.iisc.ac.in/ grass) as displayed in figure 11.1. The class statistics is given in table 6.1. The implementation of the classifier on Landsat, IRS and MODIS image helped in the digital data exploratory analysis as were also verified from field visits in July, 2007 and Google Earth image.
Table 6.1: Land use in Greater Bangalore
Class >
Year V |
Built up |
Vegetation |
Water Bodies |
Others |
| 1973 |
Ha |
5448 |
46639 |
2324 |
13903 |
| % |
7.97 |
68.27 |
3.40 |
20.35 |
| 1992 |
Ha |
18650 |
31579 |
1790 |
16303 |
| % |
27.30 |
46.22 |
2.60 |
23.86 |
| 1999 |
Ha |
23532 |
31421 |
1574 |
11794 |
| % |
34.44 |
45.99 |
2.30 |
17.26 |
| 2000 |
Ha |
24163 |
31272 |
1542 |
11346 |
| % |
35.37 |
45.77 |
2.26 |
16.61 |
| 2002 |
Ha |
26992 |
28959 |
1218 |
11153 |
| % |
39.51 |
42.39 |
1.80 |
16.32 |
| 2006 |
Ha |
29535 |
19696 |
1073 |
18017 |
| % |
43.23 |
28.83 |
1.57 |
26.37 |
| 2007 |
Ha |
30876 |
17298 |
1005 |
19143 |
| % |
45.19 |
25.32 |
1.47 |
28.01 |

Figure 11.1: Temporal land use changes in Greater Bangalore
From the classified raster data, urban class was extracted and converted to vector representation for computation of precise area in hectares. There has been a 466% increase in built up area from 1973 to 2007 as evident from temporal analysis leading to a sharp decline of 61% area in water bodies in Greater Bangalore mostly attributing to intense urbanisation process. Figure 11.2 shows Greater Bangalore with 265 water bodies (in 1972). The rapid development of urban sprawl has many potentially detrimental effects including the loss of valuable agricultural and eco-sensitive (e.g. wetlands, forests) lands, enhanced energy consumption and greenhouse gas emissions from increasing private vehicle use. Vegetation has decreased by 32% from 1973 to 1992, by 38% from 1992 to 2002 and by 63% from 2002 to 2007. Disappearance of water bodies or sharp decline in the number of waterbodies in Bangalore is mainly due to intense urbanisation and urban sprawl. Many lakes were unauthorised encroached for illegal buildings (54%). Field survey (during July-August 2007) shows that nearly 66% of lakes are sewage fed, 14% surrounded by slums and 72% showed loss of catchment area. Also, lake catchments were used as dumping yards for either municipal solid waste or building debris. The surrounding of these lakes have illegal constructions of buildings and most of the times, slum dwellers occupy the adjoining areas. At many sites, water is used for washing and household activities and even fishing was observed at one of these sites. Multi-storied buildings have come up on some lake beds that have totally intervene the natural catchment flow leading to sharp decline and deteriorating quality of waterbodies.
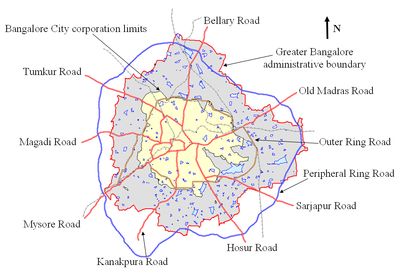
Figure 11.2: Greater Bangalore with 265 water bodies
Figure 11.3 provides the distribution of wetlands in 1973, 1992, 2002 and 2007 based on the respective years’ remote sensing data. The analysis revealed that there were 51 wetlands (321 ha) in 1973, 38 (207 ha) in 1992, 25 (135 ha) in 2002 and dropped down to 17 with an extent of 87 ha in 2007 in the Bangalore city limits.
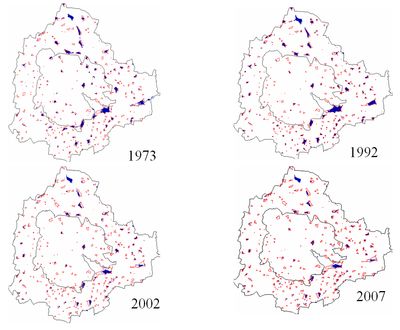
Figure 11.3: Unsupervised learning to extract waterbodies from NIR bands. Waterbodies are represented in blue and the vector layer of waterbodies generated from SOI Toposheet is overlaid (in red colour) that exactly fits on the existing waterbodies. The inner boundary (in black) is the Bangalore city limit and the outer boundary represents the spatial extent of Greater Bangalore.
There were 159 waterbodies spread in an area of 2003 ha in 1973, that reduced to 147 (1582 ha) in 1992, which further declined to 107 (1083 ha) in 2002 and finally there are only 93 waterbodies (both small and medium size) with an area of 918 ha in the Greater Bangalore region. Waterbodies in northern part of greater Bangalore are in a considerably poor state compared to the wetlands in southern greater Bangalore. Validation of the classified data was done through field visits during July 2007, which indicate the accuracy of 91%. The error of omission was mainly due to cover of water hyacinth (aquatic macrophytes) in the waterbodies due to which the energy was reflected in IR bands than getting absorbed. 54 waterbodies were sampled through field visits while the remaining waterbodies were verified using online Google Earth (http://earth.google.com).
Temporal analyses indicate the decline of 34.48% during 1973 to 1992, 56.90% during 1973-2002 and 70.69% of waterbodies during 1973-2007 in the erstwhile Bangalore city limits. Similar analyses done for Greater Bangalore (i.e Bangalore city with surrounding 8 municipalities) indicate the decline of 32.47% during 1973 to 1992, 53.76% during 1973-2002 and 60.83% during 1973-2007 (Table 4). This is correlated with the increase in built up area from the concentrated growth model focusing on Bangalore, adopted by the state machinery, affecting severely open spaces and in particular waterbodies. Some of the lakes have been restored by the city corporation and the concerned authorities in recent times [13].
Urbanisation and the consequent loss of lakes has led to decrease in catchment yield, water storage capacity, wetland area, number of migratory birds, flora and fauna diversity and ground water table. Studies in selected lake catchments in Bangalore reveal the decrease in depth of the ground water table from 10-12 m to 100-200 m in 20 years due to the disappearance of wetlands.
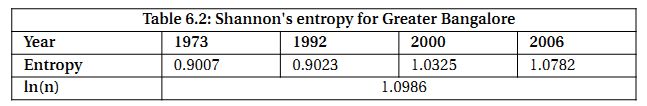
The dramatic increase in builtup area could be attributed to the urban sprawl in the peri urban areas of the city. The Shannon’s entropy was computed to detect the urban sprawl phenomenon. Shannon’s entropy computed for Bangalore city, Peri-urban and outskirts (hence n = 3), together comprising Greater Bangalore for 1973, 1992, 2000 and 2006 are listed in Table 6.2. The entropy values obtained for 2000 and 2006, (1.0325 and 1.0782) are closer to the upper limit of log n, i.e. 1.0986, showing the higher degree of dispersion of built-up in the city. The urbanisation process increased in 2000 and 2006, indicating higher entropy value as the distribution of built-up during 2006 was more dispersed than in 1973 or 1992.
Table 6.2: Shannon’s entropy for Greater Bangalore
| Year |
1973 |
1992 |
2000 |
2006 |
| Entropy |
0.9007 |
0.9023 |
1.0325 |
1.0782 |
| ln(n) |
1.0986 |
Consequences of urbanisation and urban sprawl: Urbanisation and urban sprawl have posed serious challenges to the decision makers in the city planning and management process involving plethora of issues like infrastructure development, traffic congestion, and basic amenities (electricity, water, and sanitation), etc. [Ramachandra and Uttam Kumar 2004, 2007]. Apart from this, major implications of urbanisation are:
- Floods: Common consequences of urban development are increased peak discharge and frequency of floods as land is converted from fields or woodlands to roads and parking lots, it loses its ability to absorb rainfall. Conversion of water bodies to residential layouts has compounded the problem by removing the interconnectivities in an undulating terrain.
- Heat island: Surface and atmospheric temperatures are increased by anthropogenic heat discharge due to energy consumption, increased land surface coverage by artificial materials having high heat capacities and conductivities, and the associated decreases in vegetation and water pervious surfaces, which reduce surface temperature through evapotranspiration.
- Loss of aquatic ecosystems: Urbanisation has telling influences on the natural resources evident from the sharp decline in number of water bodies and also from depleting groundwater table. Figure 11.4 illustrates the loss of aquatic ecosystems (70% decline during 1973-2007 in the Bangalore city limits) and vegetation with the increase in built up area (466% during 1973-2007).
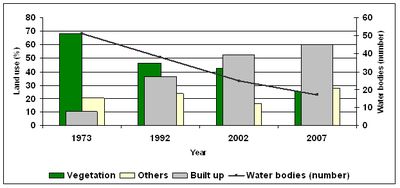
Figure 11.4: Temporal changes in built up and its impact on vegetation and water bodies


