RESULTS & DISCUSSION
6.1 Observations during field visits
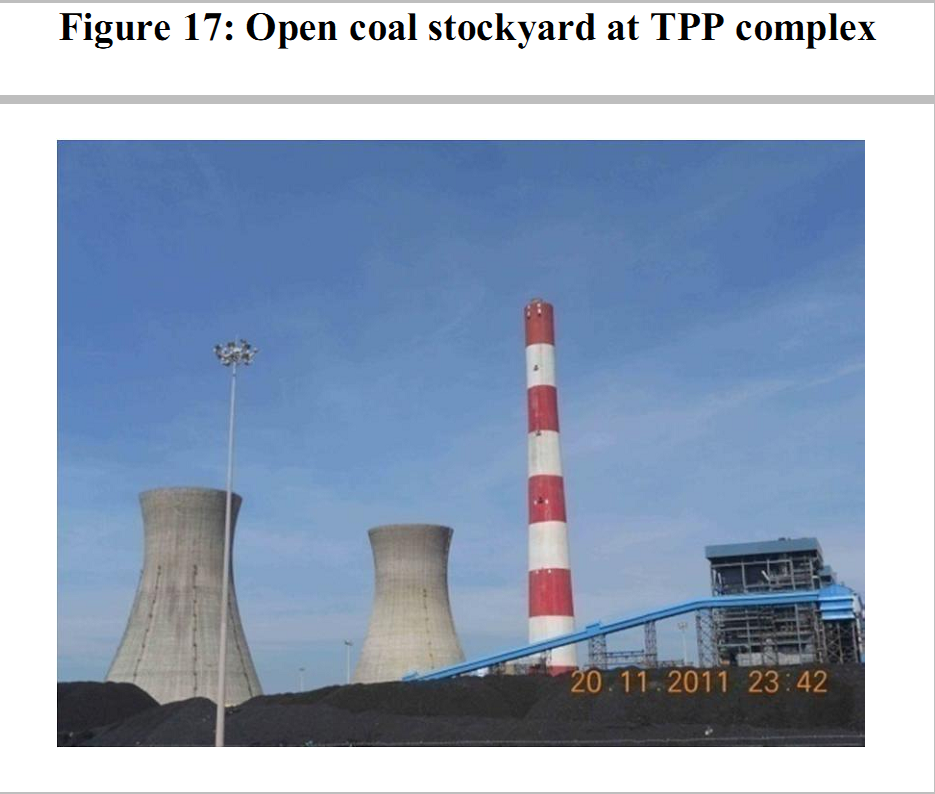
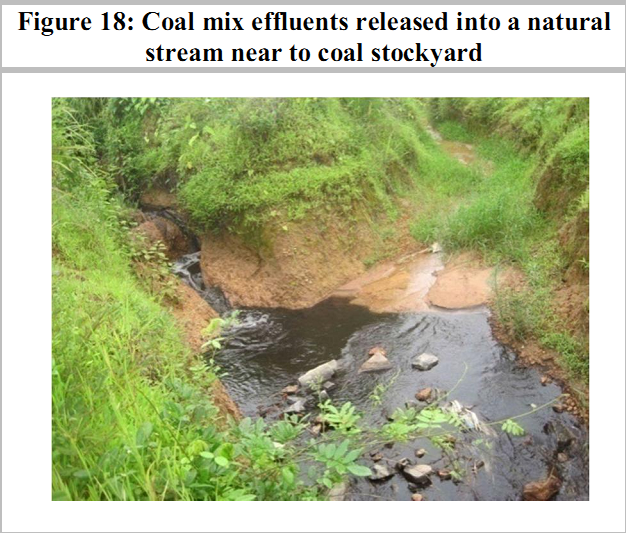
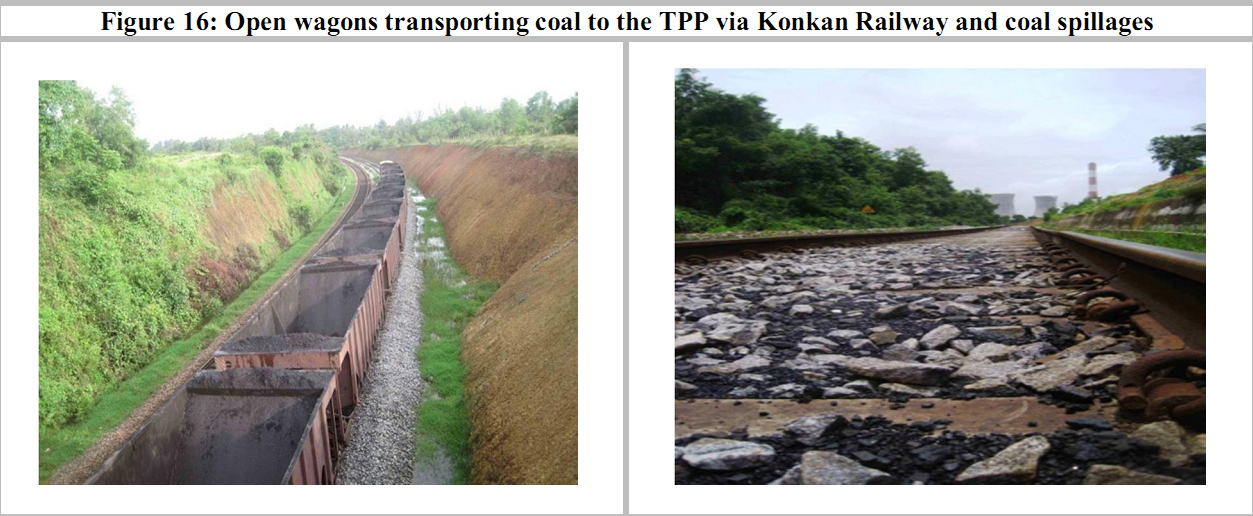
Coal feedstock -transport and storage issues: The TPP in Yellur village is a coastal Ultra Mega Power Project (UMPP) with installed capacity of 600 MW, being upgraded to 1200 (2X600) MW capacity with further proposed capacity addition in different phases. As mandated by the MoP, UMPPs must use imported coal. The TPP imports coal from Indonesia and handles it in a coal stock yard at New Mangalore Port Trust (NMPT) captive coal jetty. It is transported in open type 60T Bottom Opening Type Box (BOBRN) wagons via Konkan Railway to the plant located nearly 37 km away from Mangalore. Coal spillages and coal dust were observed on the tracks leaching to nearby water bodies (Figure 16). The TPP coal yard stocks coal for 45 days (Figure 17). Improper liners and coal stockyard without shelter has led to leaching during heavy monsoon, contaminating nearby land, ground water and surface water bodies. Open storage and exposure of coal to air and water (due to precipitation) leads to oxidation of pyrites (in coal) to sulphates and sulphuric acid resulting in acid mine drainage. Coal mix effluents were observed to be released (Figure 18) into nearby surface water sources at northwestern, southwestern and southern sides of TPP (Yellur village). Coal samples were collected from the TPP complex. Based on analysis by Central Power Research Institute (CPRI) (Table 19-20), Gross Calorific Value (GCV) was reasonably good (5590-6090 kcal/kg). The expected range of ash content for Indonesian coal is ~13%. Table 19: Proximity analysis of the coal procured from TPP
Table 20: Ultimate analysis of the coal procured from TPP
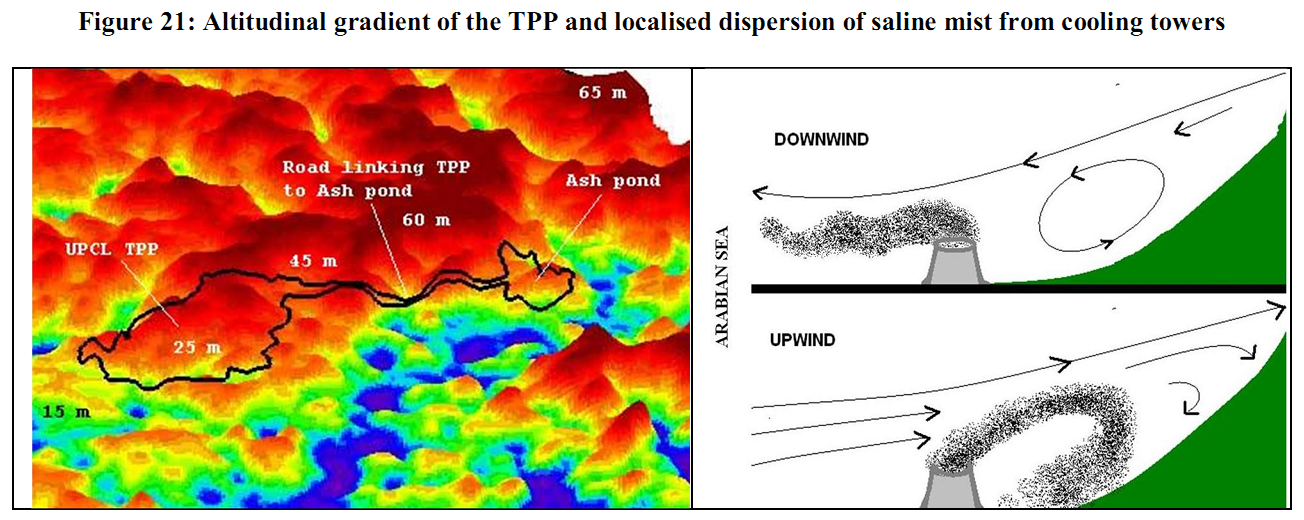
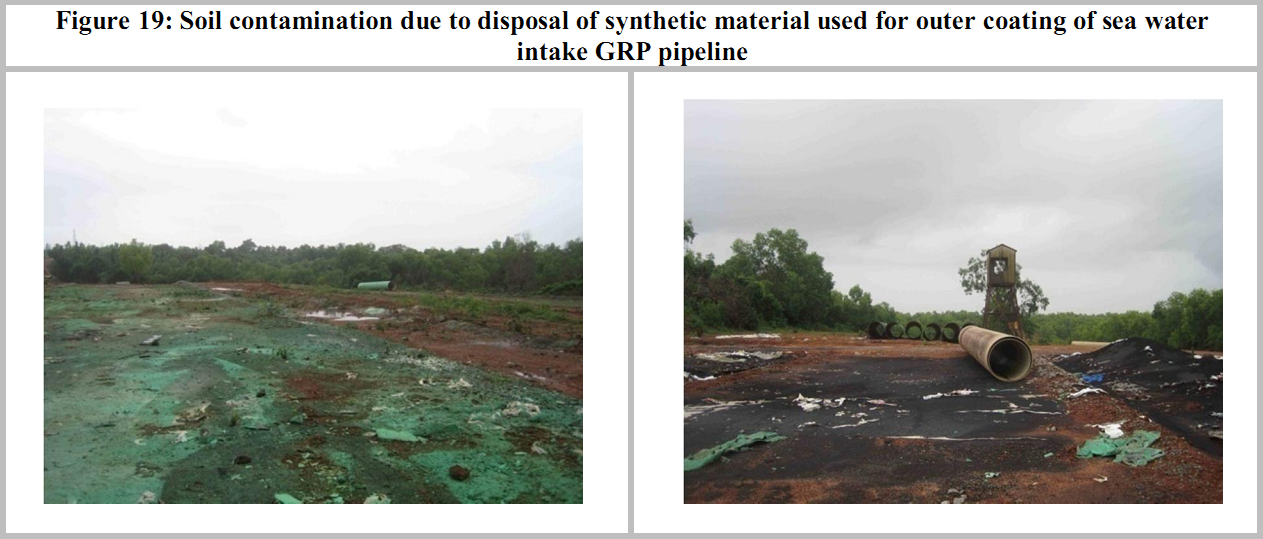
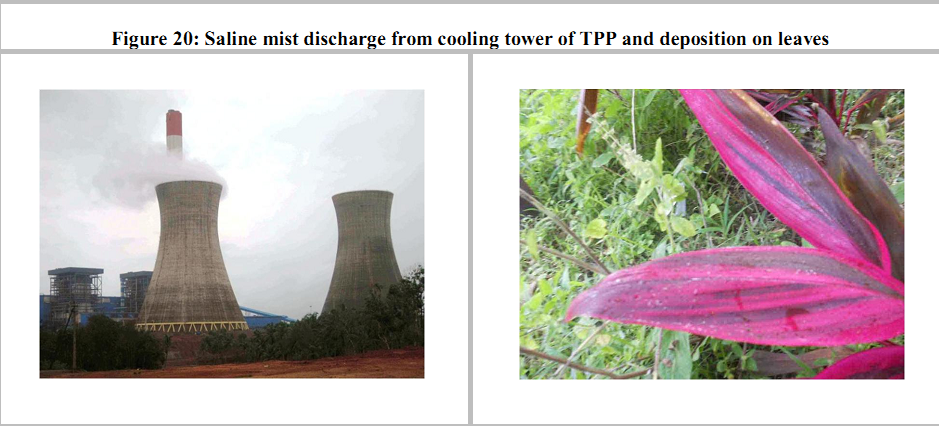
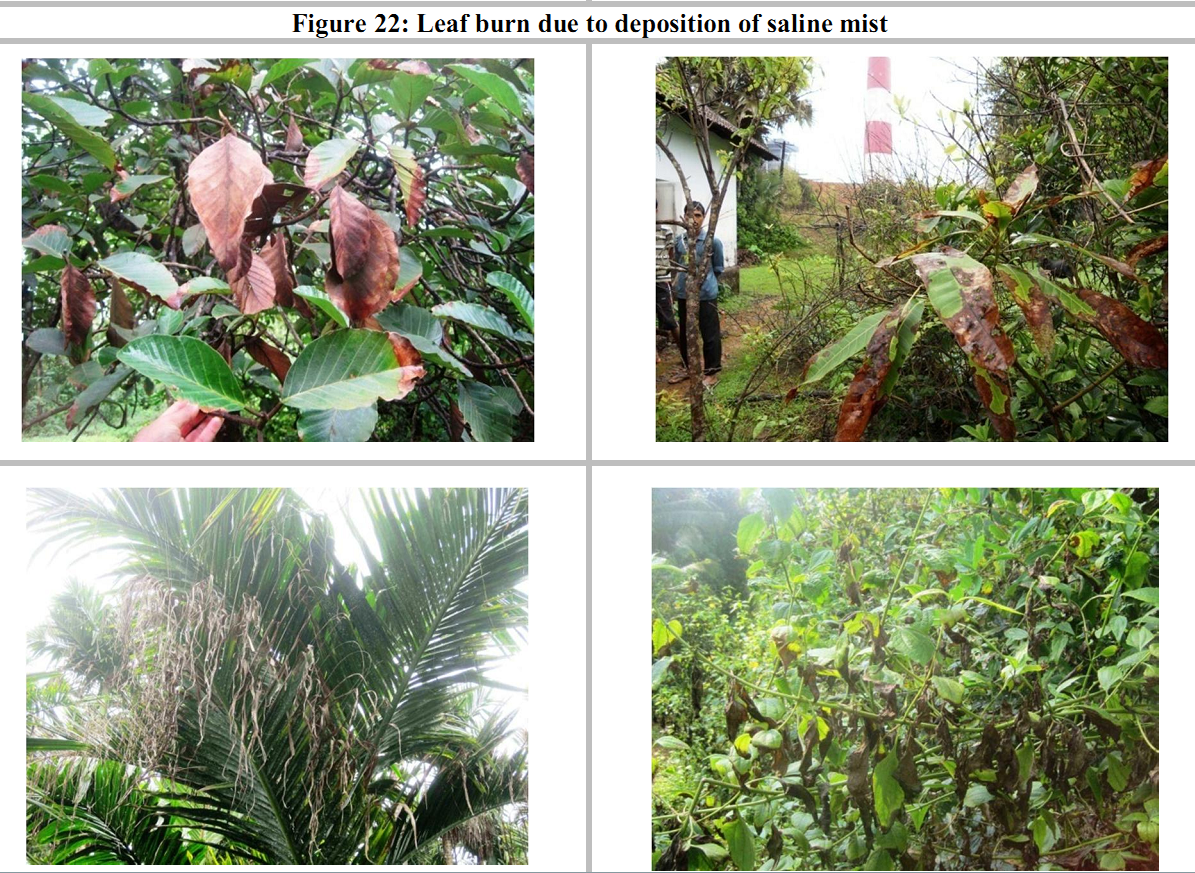
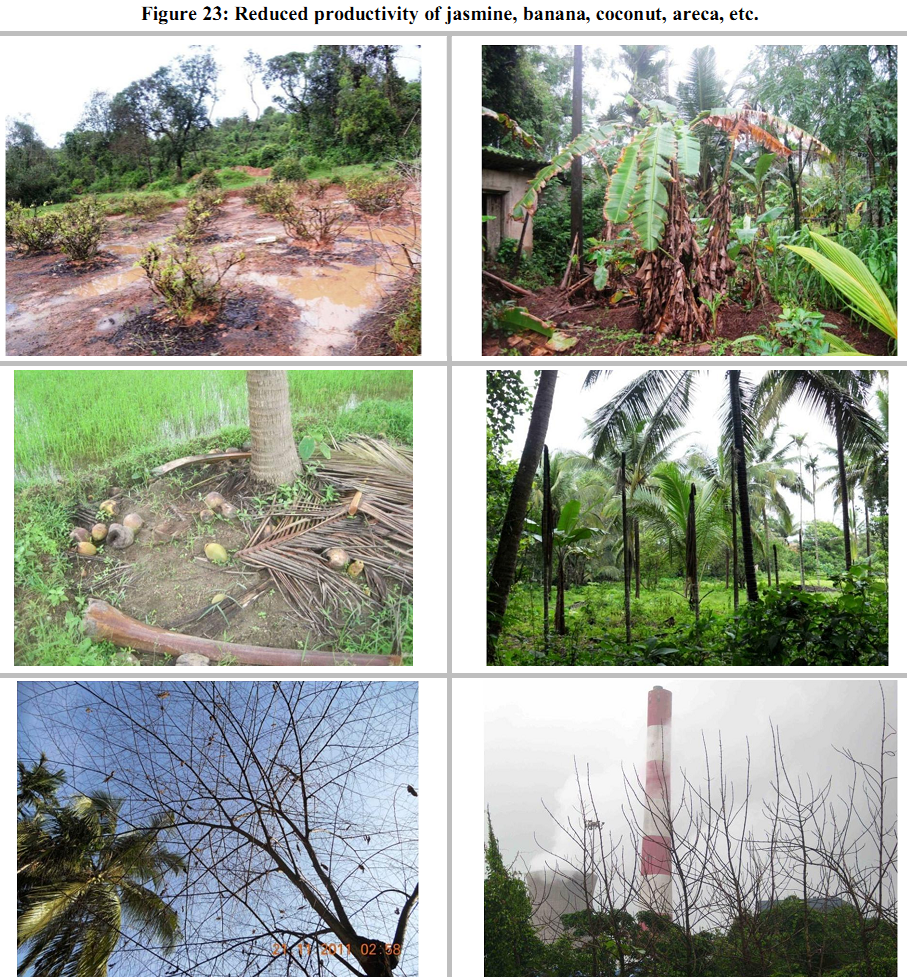
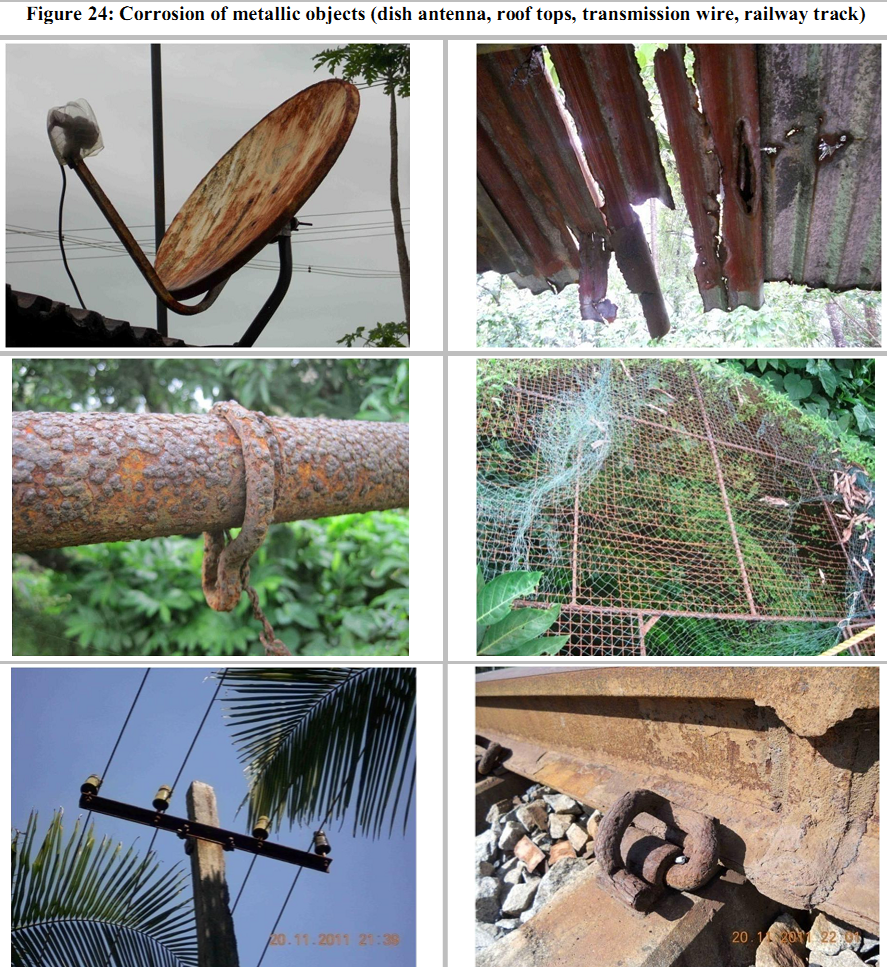
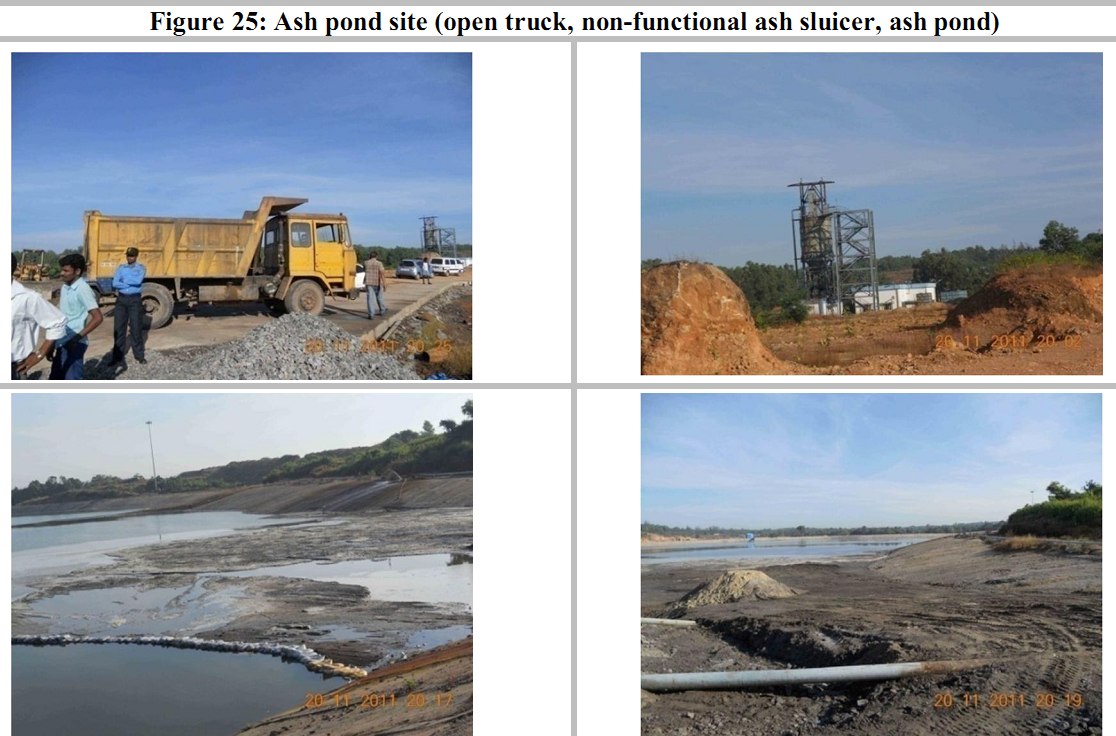
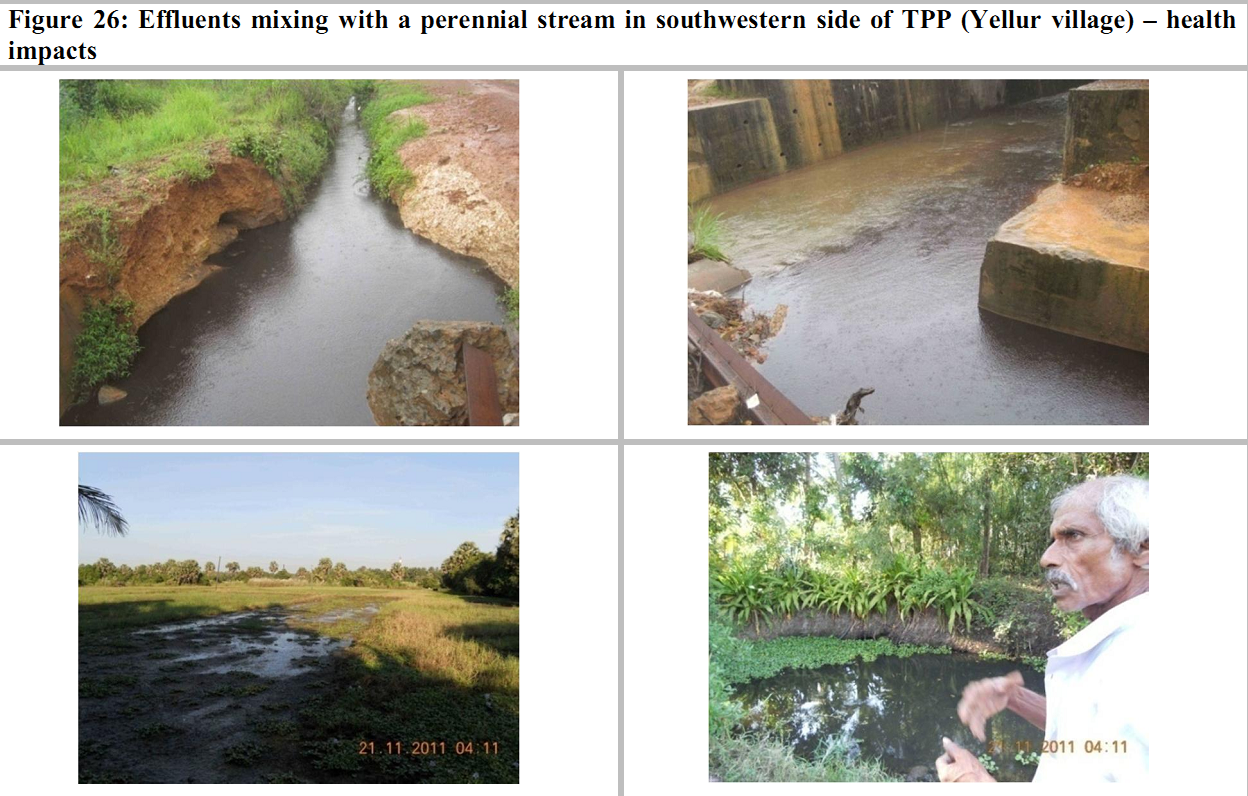
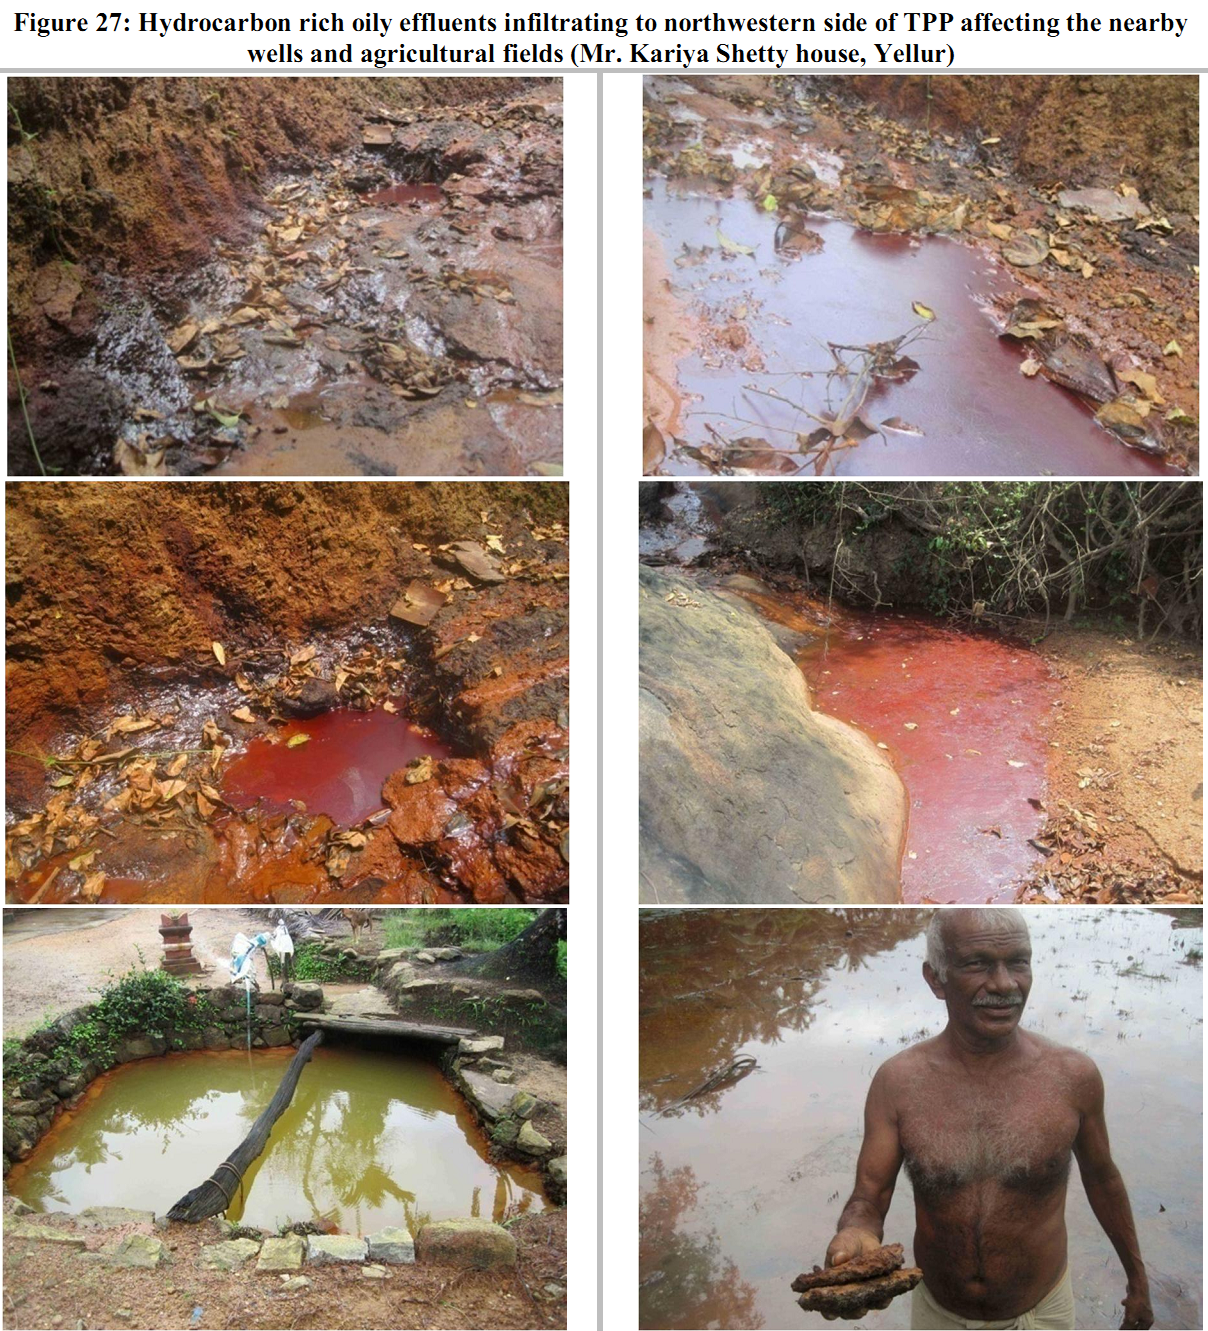
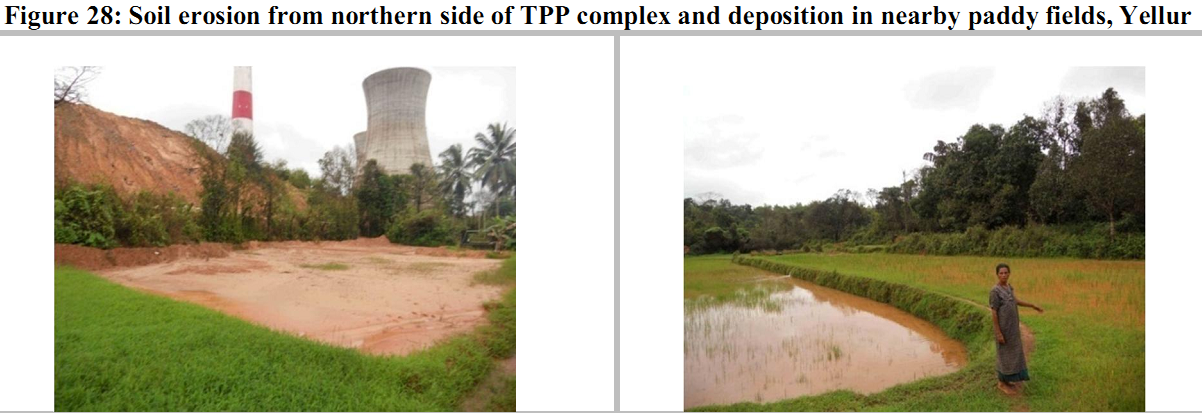
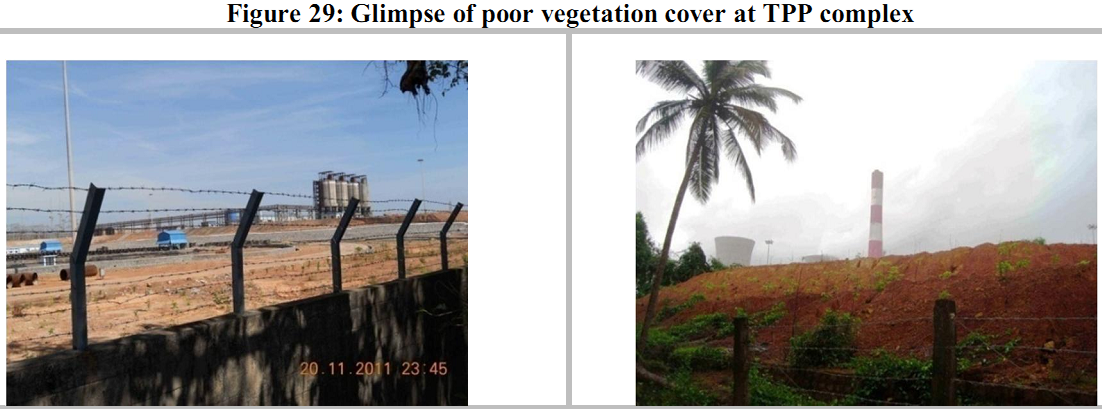
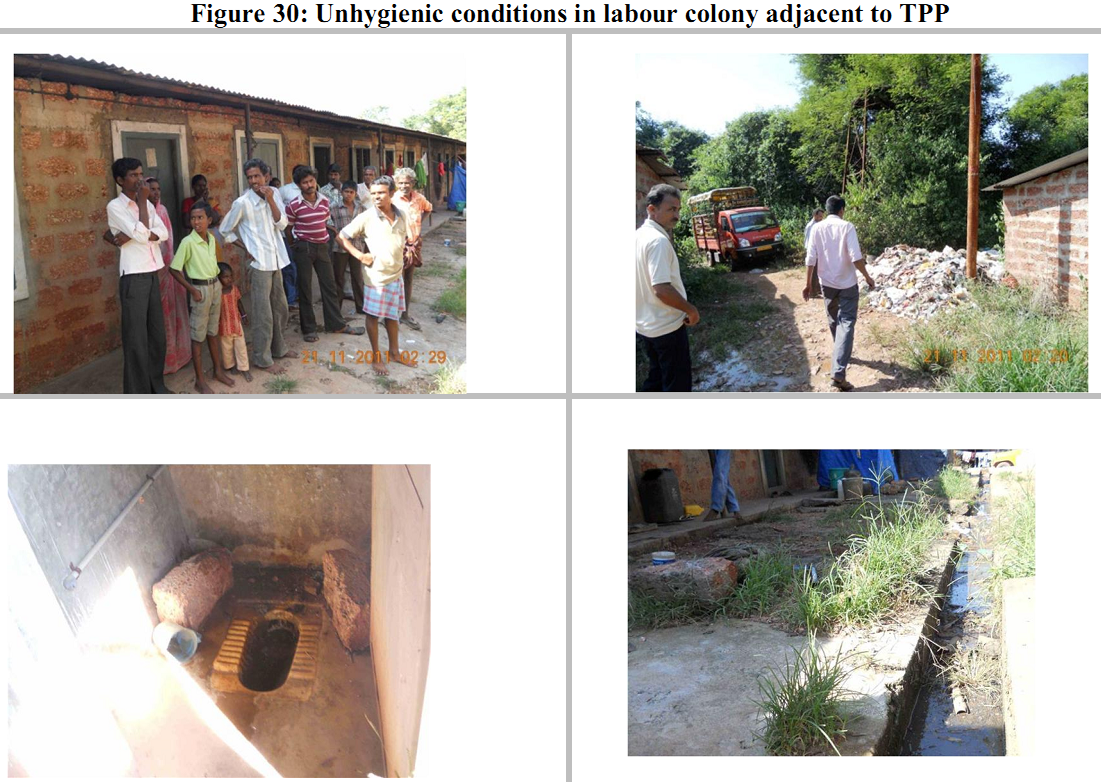
Contamination due to salt water intake: The TPP extracts water from Arabian Sea through Glass-fiber Reinforced Plastic (GRP) pipeline at the rate of 10045 m3/hour. Indiscriminate soil contamination due to pipeline construction activities were observed during the field visit. Disposal of polymer used for outer coating of GRP (Glass-fiber Reinforced Plastic) pipeline also has a tendency to leach to water resources during high precipitation (Figure 19). Leakages from existing GRP pipelines since December 2009 were reported by local people and no effective tangible remedial action has been taken either by TPP or district administration. Discussion with local people revealed that, out of the 17 wells within 100 m of the pipeline (which are being continually monitored), 16 had higher TDS beyond permissible limits. Also, 14 wells were dewatered during March-April 2011 and 4 were reported to have higher salinity even after cleaning and monsoon rainfall. Salt water intrusion into ground water resources apart from higher salinity level in soil has deprived local residents their fundamental right of clean water and livelihood. Saline mist discharge from TPP cooling towers: Supersaturated saline mist released from the cooling towers of TPP was observed in the immediate surroundings and regions upto 2 km (Figure 20). Saline mist dispersion from cooling towers is localised in the valley region during upwind and downwind flows as shown by the Figure 21. This improper siting of TPP without taking into account the altitudinal gradient and wind regime of the region has resulted in deposition of saline mist over regions in the vicinity. The saline mist deposit has resulted in chlorosis, necrosis and leaf burn (Figure 22; observed in banana, coconut, arecanut, jasmine, etc.), reduced productivity of plants (Figure 23; paddy, banana, jasmine, arecanut, beetlenut leaves, coconut, etc.),corrosion of metallic objects (Figure 24; tin sheets, dish antennas, railway tracks, transmission lines, fencing wires, vehiclechassis, well pulleys, mesh on the well, etc.), soil salinity, etc. The salt deposition on vegetation has stunted its growth. Also, deposition of dust (with salt) has altered the phenology apart from changes in the characteristics of pollens. Due to this the population of pollinators (such as bees) has drastically reduced which has affected the ecosystem services evident from reduced pollination and declined productivity of crops. Figure 21: Altitudinal gradient of the TPP and localised dispersion of saline mist from cooling towers Flue gas emissions (SOx, NOx, COx, trace elements): The flue gas stack has a height of 275 m which was verified using clinometer during field visit. As per the reports, about 25% of flue gas passes through FGDs (Flue Gas Desulphurisation) which has an efficiency of 85% and can lower the SO2 emission rate. Reports also reveal that about 75% of the flue gas is let out directly without desulphurisation (apart from 85% efficiency of FGD) into the surrounding environment which has resulted in enhanced SOx levels. There are no evidences of effort to de-NOx by TPP. Coal ash handling: Coal ash (fly ash and bottom ash) collected in different hoppers are carried to ash silos within the plant. This is transported to the ash pond site through open trucks. Improper handling of ash in open trucks and also dumping of dry ash to ash pond has contributed to the particulate dispersion and fugitive dust in the neighborhood. Mismanagement of ash is primarily responsible for degrading the environment affecting the livelihood and health of local population (Figure 25). Inadequate or absence of impervious layer in the ash pond has led to seepage of contaminated water to the surrounding water sources. Apart from this, it was observed during the field visit that, ash pond effluents were discharged to a nearby perennial stream (which is being used for domestic activities by the residents of Santhur village) that joins Shambhavi river, a tributary to Mulki river which finally reaches the Arabian Sea. This has also contaminated the agriculture and horticulture lands. Effluent discharges: Major effluent discharges from the TPP are: 1) Condensate Polishing Unit (CPU) neutralization wastewater, 2) boiler drain, 3) HVAC plant waste, 4) service waste including floor washing, 5) FGD/lime are runoff (assuming FGD is installed), 6) oily wastewater, 7) ash silo area wastewater, 8) coal stockyard drain, 9) Reverse Osmosis (RO) reject, 10) pre-treatment plant sludge, 11) cooling tower blowdown, and 12) sanitary waste. It has been observed that coal mix effluents were drained to nearby streams which eventually mixed with other perennial streams. This has also affected the nearby pond and well waters. One of the streams flowing westward of the TPP towards the sea carried effluents through the villages of Padebettu and Nadsal. This has polluted coastal agricultural lands and water bodies even at a distance of over 4 km from the TPP site (Figure 26). The hydrocarbon rich oily effluents were observed to have infiltrated to low lying areas particularly in the northwestern side of TPP. This has affected the nearby wells and agricultural fields (Figure 27). Soil erosion from TPP complex: Large scale mud slides were observed in the northern side of TPP subsequent to monsoon due to lack of appropriate soil conservation measures in the TPP complex. Heavy rainfall eroded the soils anddepositedthem in nearby paddy fields (Figure 28). This had resulted in damage to crops and also decline in soil fertility affecting the dependent population’s only livelihood. Inadequate green cover around TPP and ash pond: As per the environmental policy 2006 and also EIA notification, TPP is supposed to maintain at least 33% green cover. However, poor green cover in the TPP site (Figure 29) as well as ash pond site and lack of appropriate buffer, highlight non-compliance of the environmental norms. Appropriate vegetation in the green belt as well as buffer region would have attenuated the pollution of air and noise. Unhygienic conditions in labour colony: The housing colony constructed for migrant labourers near to the TPP was observed to have unsafe drinking water, unhygienic toilet facilities and inadequate sewage treatment (Figures 30). Open defecation and contamination of nearby streams has led to mosquito breeding resulting in higher instances of malaria and chikungunya among the residents in and nearby labour colony. Also, higher instance of crimes due to illegal drugs and liquor was reported.
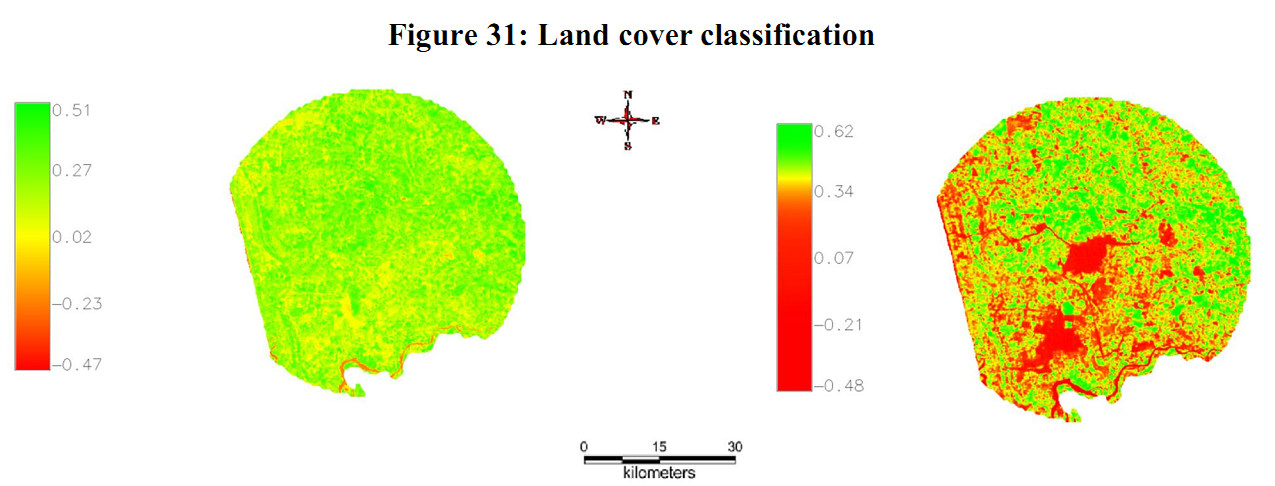
6.2 Land use and land cover Analysis Land cover analysis: Land cover analysis of the study region was done by computing Normalized Difference Vegetation Index (NDVI) which shows the percentage of area under vegetation and non-vegetation. NDVI is based on the principle of spectral difference based on strong vegetation absorbance in the red and strong reflectance in the near-infrared part of the spectrum. Vegetation index differencing technique was used to analyze the amount of change in vegetation (green) versus non-vegetation (non-green) with the two temporal data (considering 1973 and 1989 as base). Figure 31 illustrates the spatiotemporal change in the land cover of the study area. The vegetation cover 87.32% (2003) has decreased to 59.76% (2011) (Table 21). Temporal change explains the degradation rates with respect to 2003 and 2011. Figure 31: Land cover classification Table 21: Land cover analysis
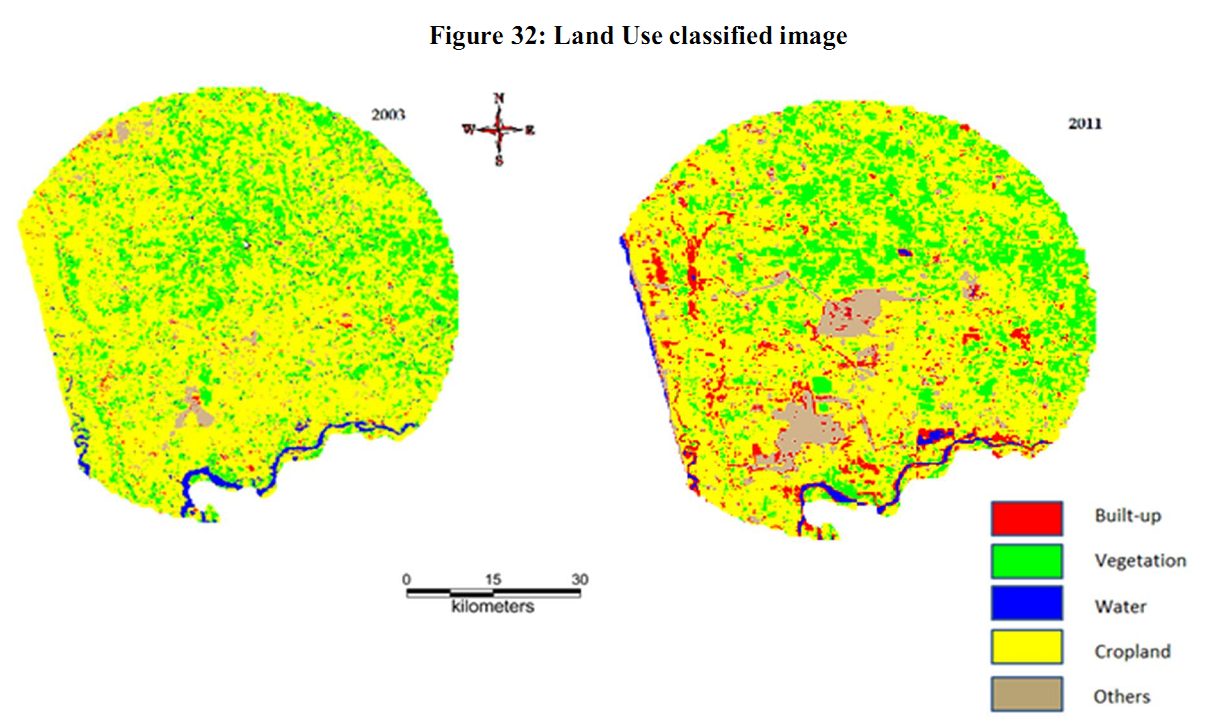
Land use analysis: The spatiotemporal land use changes of the study area are shown in the Figure 32 at the whole landscape level from 2003 to 2011 carried out by using RS data. Table 22 illustrates the changes in the area of land use with respect to time.The built-up land increased from 5.26% (2003) to 8.1% (2011) andvegetation decreased from 8.1% (2003) to 4.24% (2011). The results evidence industrial and cascaded developmental activities as major driving forces for the degradation in the region. Figure 32: Land Use classified image Table 22: Spatiotemporal land use dynamics
Accuracy of land use analysis: Accuracy assessment and kappa statistics included in Table 23 are used to evaluate the strength of each category as well as classification as a whole. Kappa statistics summarizes the overall results and measures the difference between the actual agreements in the error matrix which is ranging from 93% to 95%. Table 23: Kappa statistic and accuracy assessment
6.3 Field sampling and analyses Water samples collected from the locations were analysed for physical and chemical integrity as per the standard protocol (discussed in materials and methods section). The results of water analysis are listed in tables 24, 25 and 26 corresponding to samples from buffer zone (collected in August 2011), core zone (collected in October and November 2011). Table 27 summarises parameter wise ranges of measured values. Table 24: Water quality analysis of samples collected during August 2011 in the buffer zone (6 km) of the TPP
Numerals in Bold indicated values exceeding permissible limits
Table 25: Water quality analysis of samples collected during October 2011 in the core zone (2 km) of the TPP
Table 26: Water quality analysis of samples collected during November 2011 majorly in the core zone of the TPP
Table 27: Various parameters analysed and range of their values in the collected water samples of study region
Turbidity: Clarity of water is a very important aspect for human consumption. Turbidity in water is caused by suspended and colloidal matter such as clay, silt, finely divided organic and inorganic matter, plankton and other microscopic organisms, waste discharge and sediments from erosion. The maximum permissible limit of turbidity as per BIS and World Health Organization (WHO) is 5 NTU. Turbidity values ranged from 0.35 to 176 NTU in most of the samples. Among the collected samples, 8 samples mostly found in the immediate vicinity of the TPP were above the acceptable range. The sampleof Mr. Kariya Shetty’s well [Sampling location code -76] was having lower transparency and clarity. Itwas observed to bea finely suspended red colour solution with turbidity values of 26 NTU while the nearby stream was having a turbidity value of 36 NTU. This is due to the direct discharge of effluents to streams and subsequent leaching to ground water resources. The turbidity of well and borewell water samples of Ms. Sundari Shetty [67] near to the ash pond was about 65 and 7 respectively due to leaching of ions from ash pond and sediments from erosion caused due to improper lining of ash pond. The stream water near Mr. Jagannath Mulya’s house [58] showed extremely high turbidity (176 NTU) due to direct disposal of black coal mix effluent. Total Dissolved Solids (TDS): TDS affect the water quality in myriad of ways impacting the domestic water usage for cleaning, bathing etc as well as drinking purposes. Total dissolved solids originate from organic sources such as leaves, silt, plankton, industrial waste and sewage. Other sources come from runoff from urban areas, road salts used on street, fertilizers and pesticides used on lawns and farms [APHA, 1995]. Surface as well as groundwater with high dissolved solids are of inferior flavor and induce an unfavorable physiological reaction to the dependent population. A limit of 500 ppm TDS is desirable for drinking waters. The TDS values in the samples analysed, ranged from 29 to 8970 ppm across all locations. Among them, 5 samples were above the BIS and WHO standards. The water sample of Mr. Kariya Shetty’s [76] well and pond which is in core region has maximum values ranging from 4120 - 8976 ppm. The stream near Mr. Kariya shetty had high TDS of 4928 ppm dueto effluents richsurface run off as well as salt deposits. This would eventually result in higher build up of total solids in surface and ground water making it more unpalatable and hard to be used for domestic purposes. Chlorides: Chlorides are essentially potential anionic radical that imparts chlorosity to the waters. An excess of chlorides leads to the formation of potentially carcinogenic and chloro-organic compounds like chloroform, etc. Zafar (1964) and Kumar (1995) in their studies described chloride as a pollution indicator. Chloride values in samples ranged from 5 to 4670 ppm. Among the collected samples, 6 samples exceeded the permissible limits. Mr. Jayanth Bhat’s well[47], Mr. Kariya Shetty’s [76] well and pond, Mr. Jagannath Mulya’s [58] well and pond and the streams nearby Mr. Kariya Shetty [76] and Mr.Jagannath Mulya[58] showed very high chloride valuesdue to the discharge of hyper concentrated salt solutions and effluents from the TPP. High chloride content has deleterious effect on metallic pipes and agricultural crops. Certain areas within the core zone are affected by chloride contamination due to the discharge of effluents. Sodium: Sodium (Na) is one of the essential cations that stimulates various physiological processes and functioning of nervous system, excretory system and membrane transport in animals and humans. Increase of sodium ions has a negative impact on blood circulation, nervous coordination, thence affecting the hygiene and health of the nearby localities. According to WHO guidelines the maximum admissible limit is 200 ppm. In this study the concentration of sodium ranged from 1.7- 5065 ppm. Samples at Mr. Kariya shetty [76], Mr. Jagannath Mulya [58] and Mr. Bujanga Shetty [57] were exceeding WHO standards. Most critical values (5065 ppm) for sodium were observed in Mr. Kariya Shetty’s pond [76]. Potassium: Potassium (K) is an essential element for both plant and animal nutrition, and occurs in ground waters as a result of mineral dissolution, decomposing of plant materials and also from agricultural runoff. Potassium ions in the plant root systems helps in the cation exchange capacity to transfer essential cations like Ca and Mg from the soil systems into the vascular systems in the plants in replacement with the potassium ions. Incidence of higher potassium levels in soil system affects the solute transfer (active and passive) through the vascular conducting elements to the different parts of the plants. The potassium content in the water samples ranges between 0.2-40 ppm. Alkalinity: Alkalinity is a measure of the buffering capacity of water contributed by the dynamic equilibrium between carbonic acid, bicarbonates and carbonates in water. Sometimes excess of hydroxyl ions, phosphate, and organic acids in water causes alkalinity. High alkalinity imparts bitter taste. The acceptable limit of alkalinity is 200 ppm. The water samples analysed were having lower alkalinities because of higher acidic environment in the soil systems. Total hardness: Hardness is the measure of dissolved minerals that decides the utility of water for domestic purposes. Hardness is mainly due to the presence of carbonates and bicarbonates. It is also caused by variety of dissolved polyvalent metallic ions predominantly calcium and magnesium cation although, other cations like barium, iron, manganese, strontium and zinc also contribute. In the present study, the total hardness ranged between 12 to 1520 ppm. According to WHO guidelines the maximum admissible limit is 300 ppm. Throughout the analysis in the due course of the study, 8 samples were observed to have exceeded the permissible limits as given by WHO. The samples of Mr.Kariya Shetty’s [76] well, pond and nearby stream consistently showed higher values across different sampling periods during the study. Calcium: Calcium (Ca) is one amongst the major macro nutrients which are needed for the growth, development and reproduction in case of both plants and animals. The presence of Ca in water is mainly due to its passage through deposits of limestone, dolomite, gypsum and other gypsiferous materials (Manivasakam, 1989). Ca concentration in all samples analysed periodically ranged between 1.6 to 160 ppm. The stream containing coal mix effluents near Mr. Jagannath Mulya [58] together with Mr. Kariya Shetty’s well [76], pond and stream samples have Ca values beyond permissible levels. Magnesium: Magnesium (Mg) in one of the most essential macro nutrients that helps as a co-factor in the enzyme systems and in the central metal ions that constitutes the chlorophyll moleculeessential for plant photosynthesis. According to WHO guidelines the maximum admissible limit is 50 ppm. In this study the concentration of Magnesium ranged from 0.97– 282 ppm. This indicated Mg accumulation in the water systems resulting in the increase in overall hardness of water making it unpalatable and unsuitable for any domestic applications. Dissolved Oxygen: Dissolved oxygen (DO) is the most essential feature in aquatic system that helps in aquatic respiration as well as detoxification of complex organic and inorganic mater through oxidation. The presence of organic wastes impose a very high oxygen demand on the receiving water leading to oxygen depletion with severe impacts on the water ecosystem. The effluentsalso constitute heavy metals, organic toxins, oils, volatile organics, nutrients and solids. Thermal Power Plant effluents cause temperature difference in the water and reduce the available oxygen. The DO of the analysed water samples varied between 0.74 to 8.81 ppm. The higher variations of DO especially lower DO values are indicative of fast oxidising chemicals in the immediate vicinity. DO in the surface waters were substantially low compared to the ground water systems,due to effluents released in natural surface streams. The impact was a reduced aquatic biodiversity in the nearby streams and ponds. Nutrients (nitrates and phosphates): Nutrients essentially comprise of various forms of N and P which readily dissolve in solutions that are uptaken by microbes and plant root systems in the form of inorganic mineral ions. Accumulation of N as nitrates and P as inorganic P in aquatic ecosystems causes significant water quality problems due to higher net productivity. Together with phosphorus, nitrates in excess amounts in streams and other surface waters can accelerate aquatic plant growth causing rapid oxygen depletion or eutrophication in the water. Nitrates at high concentrations (10 mg/l or higher) in surface and groundwater used for human consumption are particularly toxic to young children affecting the oxygen carrying capacity of blood cells (RBC) causing cyanosis (methemoglobinemia). In the present study, nitrate values ranged from 0.05 to 9.3 ppm and phosphate values ranged between 0.01 to 2.4 ppm. Sulphates: The incidence of higher sulphate levels imparts an overall acidity to water that becomes unsuitable for domestic usage and cultivation. The higher levels of sulphates affects the nature of the soil under cultivation and results in drastic decline incrop productivities. The SOx from the atmosphere gets dissolved in water and precipitates as acid rain contributing higher sulphates to the surface and running waters. In the present study sulphates ranged from 0 to 250 ppm. The samples from Mr. Kariya Shetty’s pond [76] consistently exceeded the WHO permissible limit of 200 ppm. Heavy metal analysis: Heavy metals like cadmium, chromium, copper, iron, manganese, nickel, lead and zinc were detected in the water samples of the study region, particularly core zone (Table 28). Cadmium was also observed in the soil samples contaminated by TPP effluents (Table 29). Table 28: Heavy metal analysis of water samples collected from the study region (mg/l)
Table 29: Heavy metal analysis of soil samples collected from the study region (mg/kg)
Water analysis reports collected from PCB: Our study shows that the ground as well as surface waters in the 2 km core zone considered around the TPP havedeteriorated in quality. These are comparable with other water quality analyses during December 2010 to June 2011 as well asin February, May and October, 2011 collected from PCB. Table 30 shows the sampling locations with time of collection. Table 30: Time periods and locations of water analyses by PCB (Pollution Control Board)
Yellur village TDS was above the permissible limits in all the samples. Well water samples at Mr. Kariya Shetty [76] and Ms. Madhubala Shetty residences had higher TDS during October. Samples were acidic and the value of pH ranged between 2.9- 5.6. Total hardness in well water samples of Mr. Jayanth Bhat [47], Mr. Kariya Shetty [76] and Ms. Madhubala Shetty were above the permissible limits. Calcium of well water samples at Ms. Madhubala Shetty and Mr. Jayanth Bhat [47] exceeded the WHO Limits. Magnesium ranged between 4-1090 ppm. Openwell water of Ms. Madhubala shetty had high magnesium value. Iron content in the samples of Mr. Jayanth Bhat and Mr. Kariya shetty were above the permissible limits. Total hardness and Chloride values of Mr. Jayanth Bhat, Ms. Madhubala Shetty and Mr. Kariya shetty exceeded the permissible limits. Thus in Yellur village, out of 6 samples 3 water samples exceeded WHO limits according to analyses conducted by PCB, due to effluents and leaching. Table 31: Water quality analysis in Yellur village
Yellur (Kolachur) – Southern side of TPP Table 32: Water quality analysis in Yellur (Kolachur) village
Location 1-Openwell water of Mr. Jaganath Mulya, Yellur (Kolachur) Table 33: Water quality analysis Yellur (Kolachur) village
The results of analysis of Yellur (Kolachur) showed TDS values in openwell water samples collected from Mr. Ithappa poojari, Mr. Anantharam Bhat, Mr. Subramanya Bhat, Mr. Jaganath Mulya, Mr. Hussian Sahib above the permissible limits as per WHO. The chlorides of water samples from Mr. Ithappa Poojari, Mr. Subramanya Bhat, Mr. HussianSahib exceeded the WHO limits. The pH was also not within range in all the samples. Thus the ground water of Yellur (Kolachur) village is contaminated. The high TDS and chloride values indicate exceeding salt content due to release of salt water or effluents. Santhur village Table 34: Water quality analysis in Santhur village
Location 1 – openwell water of Mr. Vittal Shetty near ash pond Water samples of March and May 2011, showed higher iron content in openwell of Mr. Vittal Shetty near the ash pond exceeding the permissible limits. The pH of water samples at openwell of Mr. Bhaskar Shetty (at south side of ash pond) was acidic. Karnire village Table 35: Water quality analysis in Karnire village
In Karnire village the analysis of water samples of river Shambhavi showed that TDS, calcium, magnesium, hardness, iron, sulphate and chlorides were above the WHO permissible limits. Nadsal (Tenka Yermal) village Table 36: Water quality analysis in Nadsal (Tenka Yermal) village
Location1 – Openwell water of Ms. Kamala Tenka Moilthi, Nadsal (Tenka,Yermal) The results of water analysis of Nadsal (Tenka Yermal) village showed high values for TDS, total hardness, chlorides, calcium and magnesium forall samples, exceeded permissible limits as per WHO. The sulphates in the open well water of Ms. Kamala and Ms. Sunidhi were above the limits. Thus there is a serious contamination in surface and ground water samples. The stream passing near these sites contains the effluents and salt water from the TPP. This is the reason for the contamination of surface and ground water samples nearby this stream. Admar village Table 37: Water quality analysis in Admar village
Location 1- Test borewell water collected at R&R near Pipeline corridor, Admar village The analysis of Admar village reported good quality of water during December 2010 to June 2011. The physical and chemical parameters were within permissible limits as per WHO. Nandikur village Table 38: Water quality analysis in Nandikur village
Location 1- Open well water of backside of Universal brothers Nandikur The results of analysis of water samples from Nandikur village are within permissible limits as per WHO standards except for the iron content. Inferences from water quality studies
The synthesis of data from PCB records as well as outcome of our field experiments reveal that water is contaminated at Yellur (including Kolachur), Nadsal and Santhur villages mainly due to untreated effluent discharge from TPP, combustion of coal without proper pollution control mechanisms, improper ash handling and ash containment pond, etc. 6.4 Socioeconomic survey – Impact of the TPP on land, water, air, crops, livestock, biodiversity and human health Residents of Yellur, Nadsal, Nandikur, Santhur, Padebetu and other villages within the study region were selected randomly to elicit the information corresponding to ecology, environmental status, crop productivity, socio-economic and health aspects. Contingency evaluation technique through a structured questionnaire was adopted to compile data from 30 households within 6 km buffer zone (20 households within 2 km core zone). In addition to this, four medical practitioners were interviewed mainly focusing on health related issues due to pollution or contamination of air, water and soil. Results of the survey reveal: Impacts due tocontamination of water
Impacts due to contamination of air environment
Impact on people’s livelihood
Impact on livestock
Impact on biodiversity
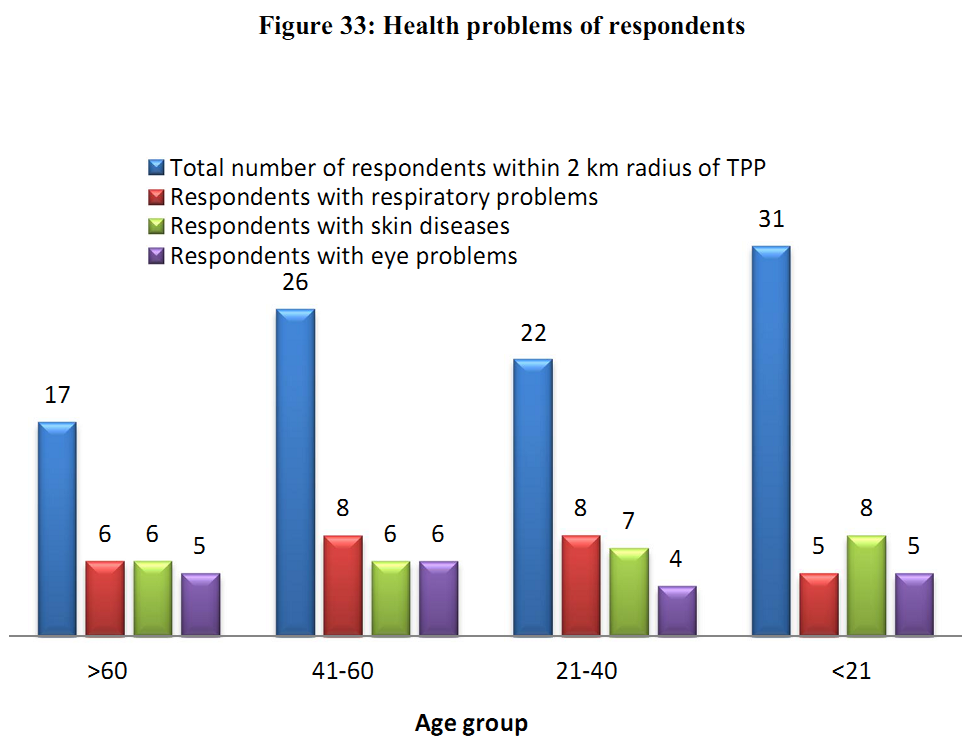
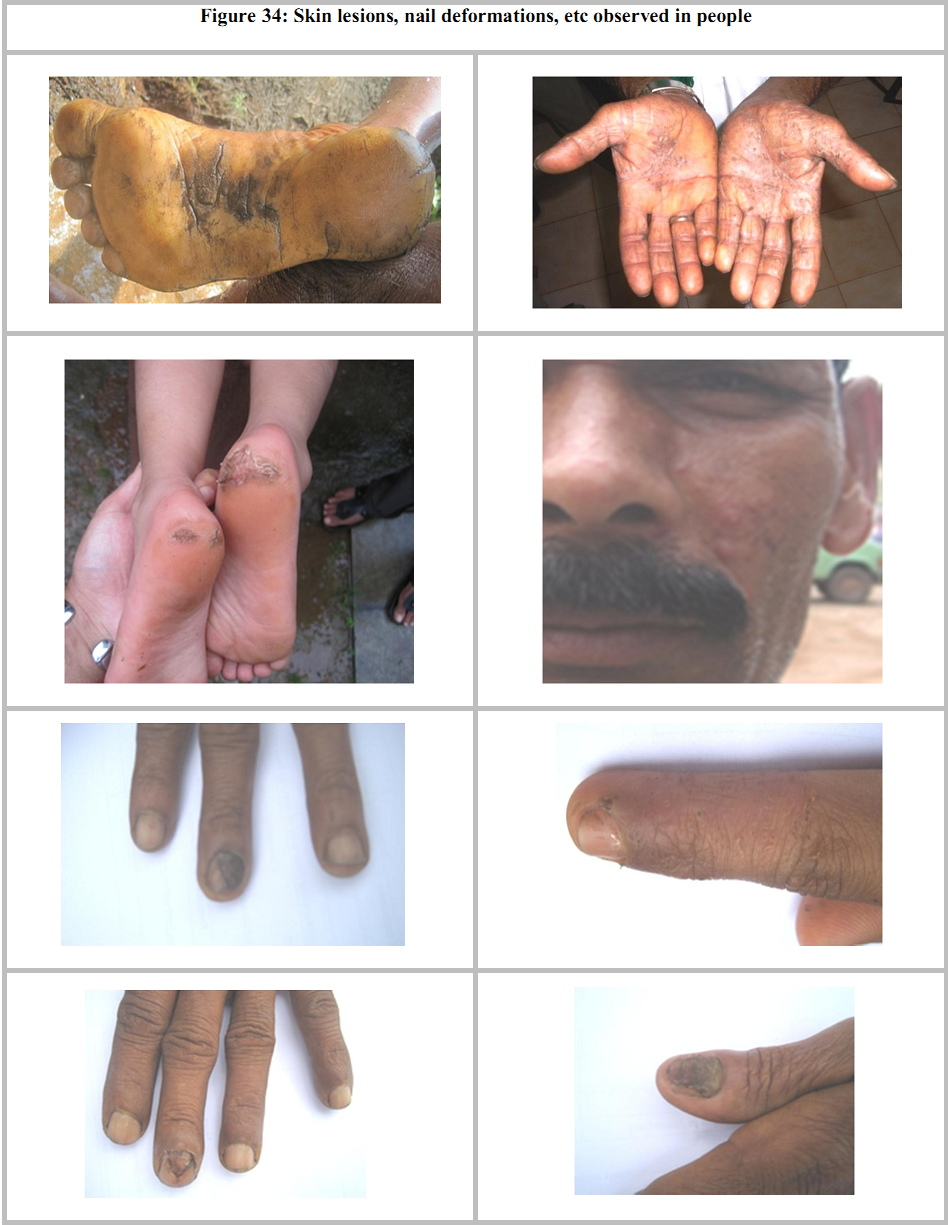
Water: Residents of the region depend mostly on nearby streams, wells/borewells for domestic water requirements. Indiscriminate discharge of coal mix effluents clandestinely by TPP into natural drains is reported at southern, southwestern and northwestern sides of TPP. Respondents in core zone of 2 km radius in the eastern (Santhur), northern (Yellur) and southern (Kolachur) sides reported salinity in well water during all seasons and higher levels during summer. Mr. Kariya Shetty [76] reported and showed yellowish/reddish coloration and oily layer in the well waters and pond on northern side. Also, respondents in southern side complained of similar problems. Respondents also reported of leakages from pipes, leaching and also overflow from fly ash pond (to groundwater sources), movement of contaminated surface water (to groundwater sources) due to direct discharge of effluents to nearby natural drains.This has increased salinity in well water. Respondent near the fly ash pond in Santhur reported of higher turbidity (change in appearance of well water)in addition to salinity. Respondent from western side (Nadsal-Tenka Yermal)also complained of non-potability of well and stream water. During the field investigations we noticed reddish coloration in stream water due to irresponsible action of sustained effluent discharge. Reddish colouration of well waters is also observed in open wells within 200 m of TPP. Nadsal (Tenka Yermal) village in the Western side of the TPP also reported saltiness, greenish coloration and oily layer in well waters near to streams which carried effluents. Fluctuations in ground water table were also reported by residents Yellur (including Kolachur), Nandikur, Nadsal due to over-extraction of ground water by TPP. Air: Respondents in the core zone reported of blackish particle deposition on leaves, clothes kept for drying, objects inside home, food kept open etc. and salt deposits on leaves and roofing tiles. This was reported to be intense prior to monsoon, although similar instances were observed even during monsoon. Higher levels of salt content in the environment (higher than similar regions in the coastal Karnataka) has resulted in corrosion of tin roofing sheets, dish antennas, iron fencing, vehicle chassis, mirror frame, well pulleys, mesh cover for wells, etc. Higher levels of ash dust was reported and observed in the localities closer to fly ash pond due to dumping of dry ash. Salt deposits as well as ash dust has enhanced the pollution of air environment evident from drying of leaves, leaf burn, etc. in the core zone. Crops: Economy of Yellur, Nandikur, Santhur, Nadsal (Tenka Yermal) and Padebetu villages are mainly agrarian and these villages grow paddy and horticultural crops like coconut, areca, sapota,banana and jasmine. Vegetables are also grown near houses to meet the respective family’s requirement.Interaction with local farmers reveals that paddy yield has declined drastically by 57-66%. Majority of respondents in the core zone as well as within the 4 km radius of TPP reported decrease in crop yield.Single women who were dependant on floriculture reported of jasmine famine consequent to changes in the air environment with dust and salt. Premature falling of arecanut and coconut, drying of leaves, leaf burn, are very common in the core zone.Instances of premature drop of arecanut and coconut is reported even beyond 2 km and upto 4 km. Livestock: Livestockowners in the core zone reported ofailments related to skin, respiratory tract, and in some cases miscarriages. Respondents reported of decreased milk yield, less fodder availability, contaminated fodder (due to uptake of heavy metals), reduced fodder yield (due to salt and dust deposition), etc. Majority of respondents indicated non-palatability of fodder (grass and herbs) due to contamination. Also, they reported of poultry death due to consumption of stream water contaminated with effluents discharged by TPP. Health: All respondents in the core zone complained of serious health problems due to the contaminated air, water and land environment. Ailments reported by the residents in this zone include respiratory (asthma, alveolar infection in superior and inferior concha, bronchitis), skin rashes, lesions, eye irritations, onychodystrophy (nail deformation), etc. Respiratory problems are very common and higher compared to skin and eye diseases among all age groups. Eye irritation and skin itching is reported by the respondents in eastern side of the plant closer to silos (where fly ash is stored), northern, southern and western sides due to contaminated domestic water from streams (Figure 33 and Figure 34). Figure 33: Health problems of respondents Figure 34: Skin lesions, nail deformations, etc observed in people Biodiversity: The region is a haven for peacocks, foxes, wild boars (Figure 35). etc. Interviews with residents reveal the decline in their numbers in the recent past especially in the core zone. Due to changes in the environment with higher levels of dust and other pollutants there has been reduction in the population of peafoul, foxes, wild boars, etc. Disturbance in the food chain is evident with the reduced primary productivity (grasses on land, algae in water bodies) and this has led to the reduced population of native fishes, crabs and frogs. Reptiles have also lost their habitat due to removal of vegetation, rocky areas, etc. Discussion with elderly people in the locality revealed that the core zone had many sacred groves (patch of forests with native species worshipped by local people). Now, these sacred groves were either removed or in dilapidated state. Presence of pollution tolerant lichen species in the barks of vegetation closer to TPP further confirms pollution of air environment. During public consultations, the discussions with the local people revealed that there has been a large scale displacement of native human population. Figure 35: Biodiversity observed in the study area Table 39 summarises the environmental impacts due to TPP Table 39: Impact matrix of UPCL
|
|||||||||||||||||||||||||||||||||||||||||||||||||||||||||||||||||||||||||||||||||||||||||||||||||||||||||||||||||||||||||||||||||||||||||||||||||||||||||||||||||||||||||||||||||||||||||||||||||||||||||||||||||||||||||||||||||||||||||||||||||||||||||||||||||||||||||||||||||||||||||||||||||||||||||||||||||||||||||||||||||||||||||||||||||||||||||||||||||||||||||||||||||||||||||||||||||||||||||||||||||||||||||||||||||||||||||||||||||||||||||||||||||||||||||||||||||||||||||||||||||||||||||||||||||||||||||||||||||||||||||||||||||||||||||||||||||||||||||||||||||||||||||||||||||||||||||||||||||||||||||||||||||||||||||||||||||||||||||||||||||||||||||||||||||||||||||||||||||||||||||||||||||||||||||||||||||||||||||||||||||||||||||||||||||||||||||||||||||||||||||||||||||||||||||||||||||||||||||||||||||||||||||||||||||||||||||||||||||||||||||||||||||||||||||||||||||||||||||||||||||||||||||||||||||||||||||||||||||||||||||||||||||||||||||||||||||||||||||||||||||||||||||||||||||||||||||||||||||||||||
