STUDY REGION
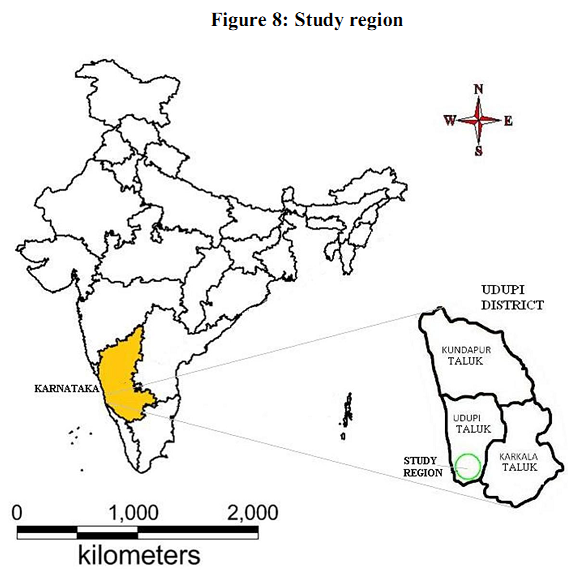
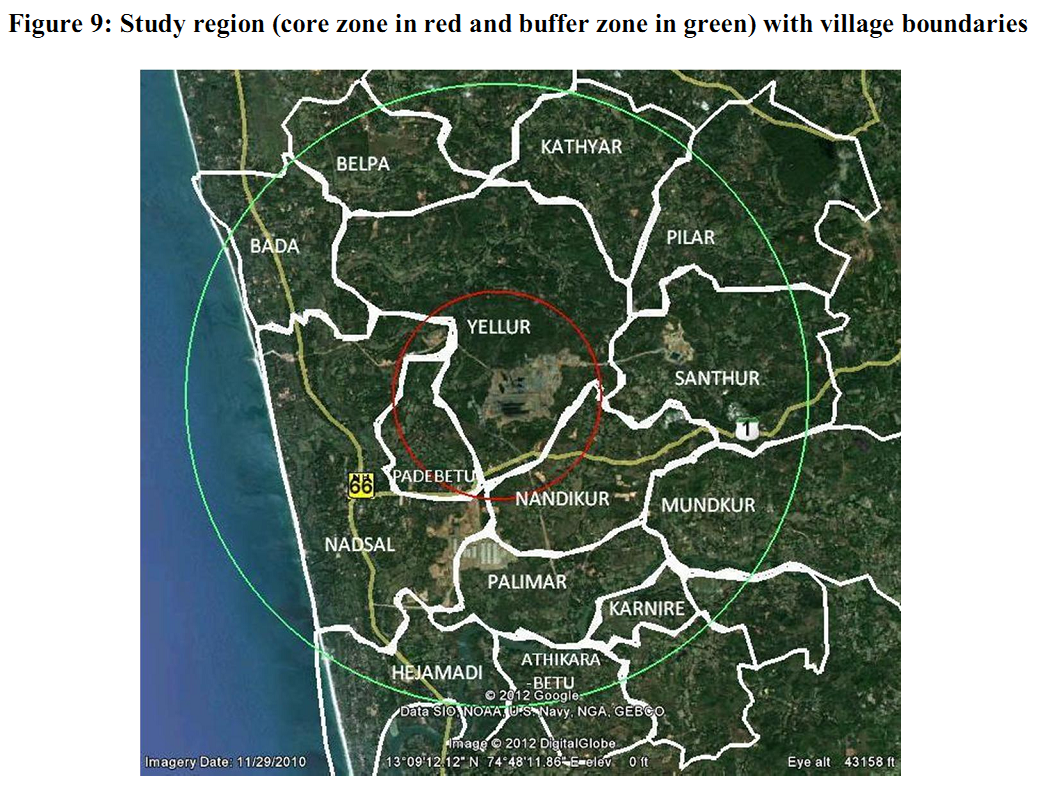
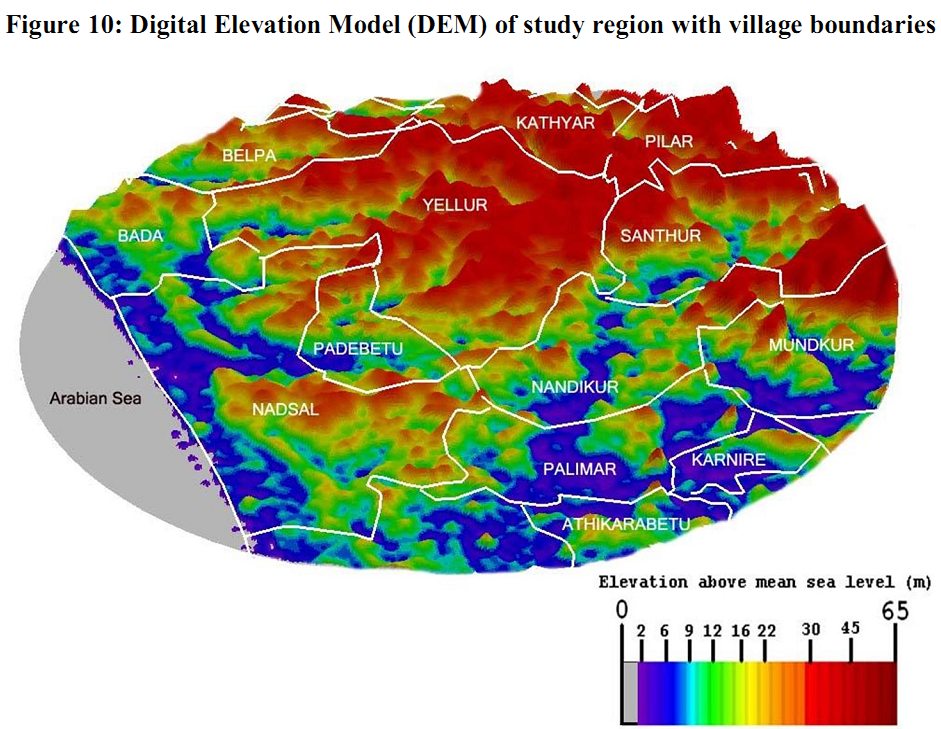
4.1 Location – geography, climate, vegetation The study region includes Yellur as well as surrounding villages of Padebetu, Nadsal (Tenka Yermal), Nandikur, Santhoor, Karnire, Bada and Palimar (and parts of other villages) as shown in Figure 8 within a buffer zone of 6 kmmajorly located in Udupi taluk, Udupi district, Karnataka. The focus area of the current study is a core zone of 2 km around Yellur village (Figure 9). The region issandwiched by Western Ghats in the east and Arabian Sea in the west. The river Shambhavi, a tributary to river Mulki flowsnearly 4 km south of the Yellur village. The Digital Elevation Model (DEM) in Figure 10 shows topography and terrain of the study region with high and low lands. It can be seen that elevation varies from mean sea level (0 m) to 65 m and high lands are concentrated in the north to east sector. Figure 8: Study region Figure 9: Study region (core zone in red and buffer zone in green) with village boundaries Figure 10: Digital Elevation Model (DEM) of study region with village boundaries
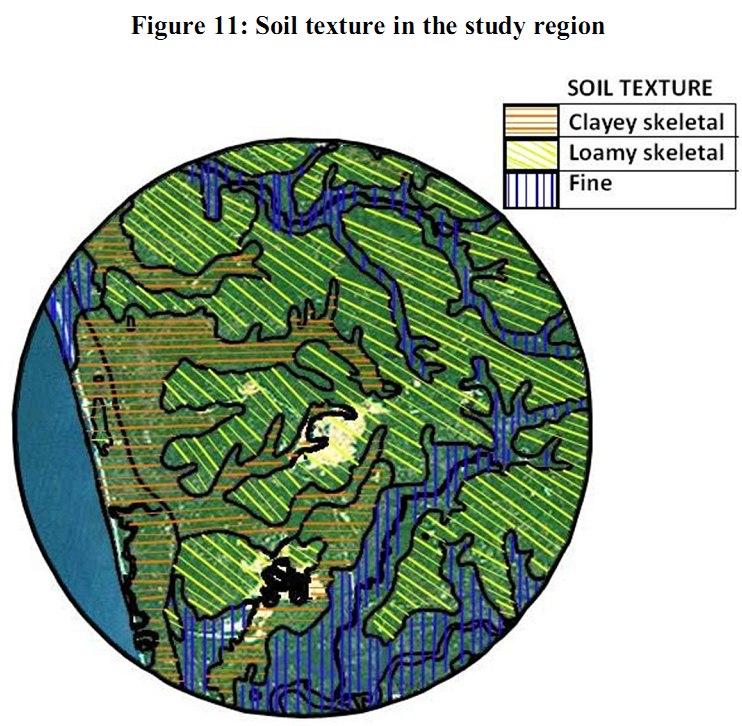
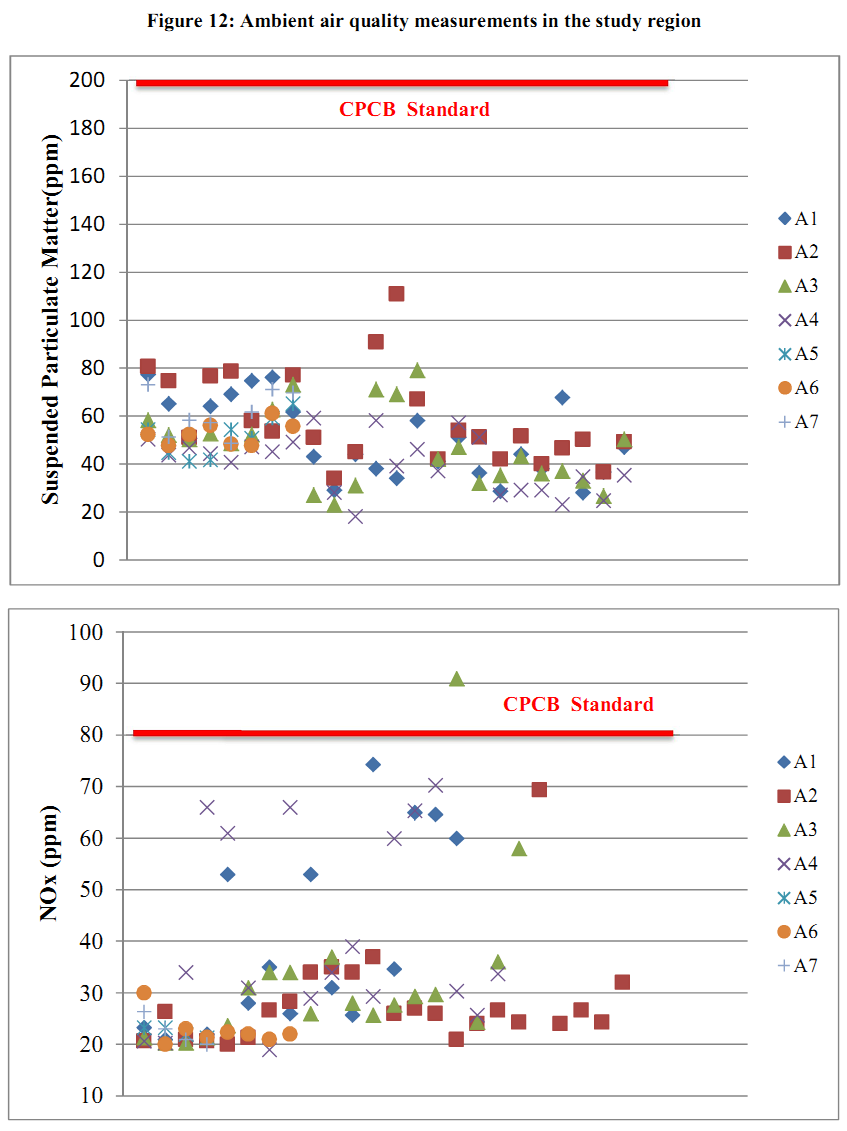
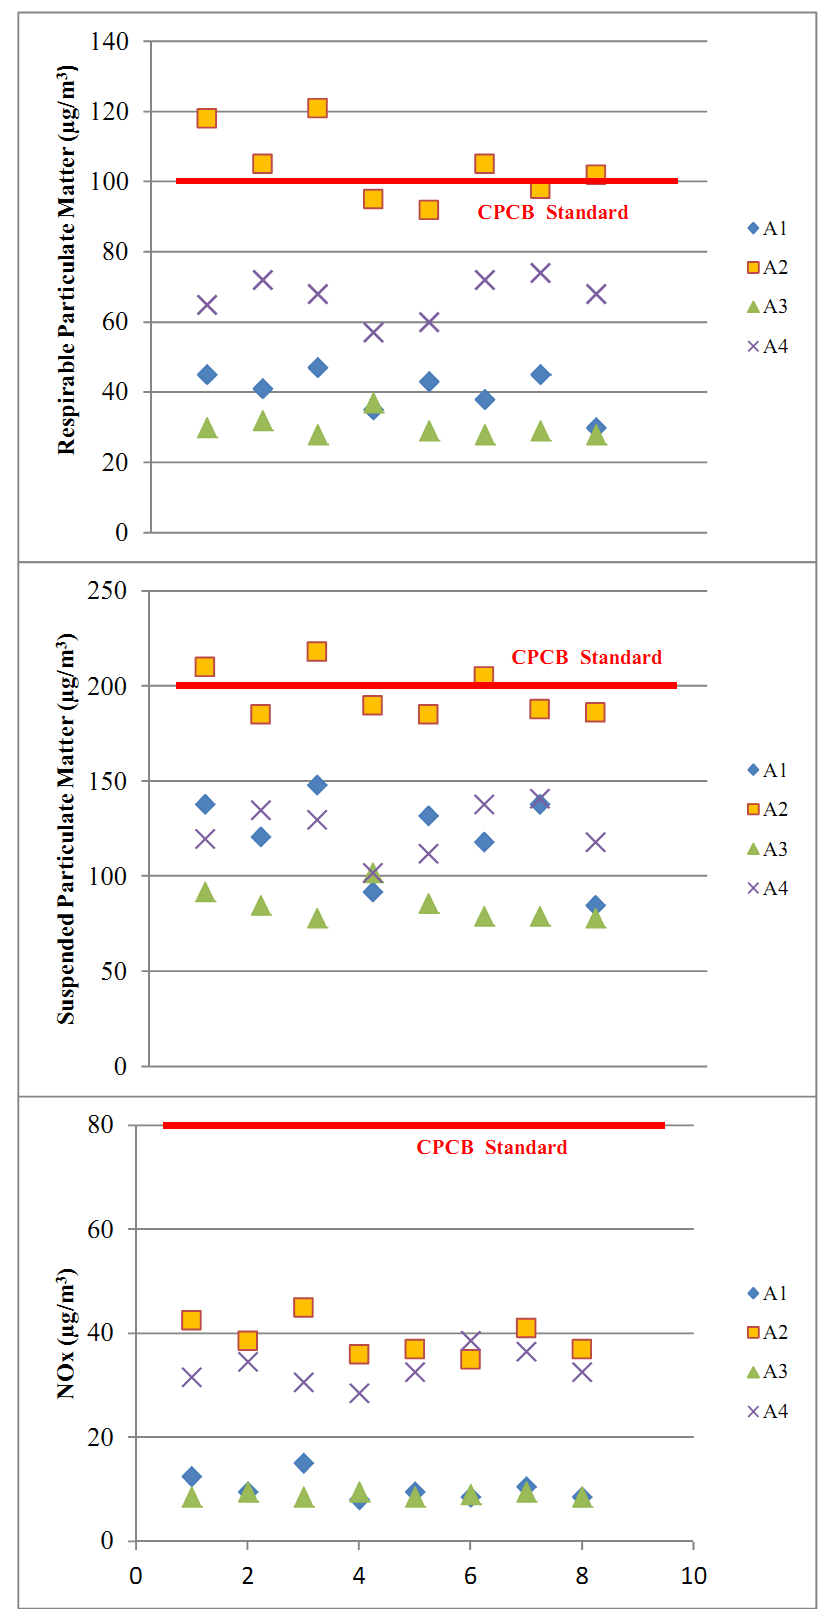
The soil in the interiors of the region is majorly lateritic red type with high porosity and permeability while the coast is rich in alluvium. Soil texture varies from fine to clayey skeletal to loamy skeletal (Figure 11). It is acidic in nature due to heavy runoff, abundant in nitrogen but deficient in potassium and phosphorous. Due to its high infiltration rate, inter-connected aquifers of the region are recharged during rains. Figure 11: Soil texture in the study region The region has four distinct seasons: 1) rainy season (June-September), 2) warm and damp post-monsoon season (October-November), 3) winter season (December-February) and 4) summer season (March-May). It has a maritime climate with temperatures ranging from 22oC to 36oC, annual average rainfall of 4035 mm and humidity ranging from 61% to 91% 37. The land-sea breezes are frequent with higher number of wind calms (<0.5 m/s). The predominant winds in winter are towards East, summer is towards North-Northwest and monsoon is towards West. The vegetation in the region is largely evergreen and deciduous type. It comes under the tropical semi-wet type. Wide ranges of flora and fauna are identified in the region. Some of the terrestrial flora includeAcacia spp., Albizzia spp., etc.Paddy is the major crop of the region.Pulses like black gram, green gram, horse gram, cow pea; fruits like mango, banana, pineapple, jackfruit, sapota; vegetables like pumpkin, gourd, sweet potato, bean, brinjal, lady’s finger, tomato, onion, garlic; and horticultural crops like coconut, arecanut, pepper are grown in the region.The fertility of the land especially in coastal and midland zones is low and hence careful management is necessitated 38. 4.2 Demography and livelihood Udupi is one of the three coastal districts of Karnataka.The Suvarna Karnataka development Corridor passes through the district of Udupi. Nearly 20 % of the work forcesare cultivators and 15 % are agricultural labourers. About 14% of rural people are involved in household industries. Udupi taluk has highest density of population compared to Kundapura and Karkala taluksin the Udupi district. It also has the highest percentage of SC and ST in the district. Agriculture is the predominant activity and the net sown area is highest in the taluk (37%). Low cropping intensity is reported due to lack of irrigation facilities. The area under cropping is in decline also due to high cost of cultivations and labour scarcity. Well organized and mechanizedmarine fishing isa major source of income for the coastal inhabitants. Having heavy rainfall, the region has a number of tributaries and backwaters providing prospects for inland fisheries. Large and medium scale industries in the region include cashew-nut processing, rice mills, coconut powder units, fish canning and processing, fish meals and fish oil units, fish net manufacturing, printing units, granite units, readymade garments, auto parts etc 39. 4.3 Baseline environmental conditions of the study region Air quality: According to the earlier studies in 1992 and 1997, air quality of the region was exceptionally good. Ambient air quality was measured for the locations given in Table 12 during summer, winter and monsoon seasons in 2001 prior to any developmental activities.The Suspended Particulate Matter (SPM) and nitrogen oxides (NOx) were within the Central Pollution Control Board (CPCB) limits (Figure 12). Air quality measurement in the summer of 2007 reveals an increase in Respirable Particulate Matter (RPM) and SPM with the TPP construction commencement (Figure 13) 40, 41, 42. Table 12: Air quality sampling locations
Figure 12: Ambient air quality measurements in the study region Figure 13: Air quality measurements in the study region after construction of TPP Water quality: Earlier studies of 1992 and 1997,indicate that the rivers had good flow in the monsoon and lean waters in other seasons. The shallow aquifers of the region storing huge amounts of rainwater were utilized through open wells while deep aquifers were exploited through bore wells. Over 90% of the surface area recharged the underground aquifers through infiltration of rain water. The water quality of the region was good without any significant contamination 40, 41. The water quality of the region 42 was studied based on surface and ground water samples collected from 3 different locations as given in Table 13 during summer, winter and monsoon seasons in 2001. The results of physico-chemical analysis of water samples are given in Table 14. Table 13: Water quality sampling locations
W1: During summer the Total Dissolved Solids (TDS), Total Suspended Solids (TSS), Biological Oxygen Demand (BOD), Chemical Oxygen Demand (COD), Chlorides, Sulphates, Sodium and Phenolic compounds were above the permissible limits as per WHO. During Monsoon the iron content of the water sample was above the permissible range. The Coliform organisms were high during winter and monsoon. W2:The results of analysis for all the 3 seasons indicate that the well water in the area is good except for oil and grease during winter and iron in monsoons which were higher than the permissible limits. In all 3 seasons the Coliform organisms were 1800 MPN/100 ml. Thus the water sample of Nandikur Village was good. W3:The result of analysis of this sample shows that the iron, oil and grease and coliform organisms were above the permissible limits in all seasons. 4.4 Recent developmental activities The study region is part of Padubidri Industrial Area as recognized by the Karnataka Industrial Areas Development Board (KIADB). Yellur village has a 600 MW TPP (13.158 o N, 74.797 o E) been operational since June 2010 supplying electricity to the power distribution company, MESCOM. An ash pond is also situated nearly 3.5 km from the TPP in Santhur village (Figure 9). The TPP covers a total land area of 262.10 ha and the break-up for different land requirements is given in Table 15. Table 15: Land requirement for TPP in the study region
Table 14: Seasonal report of baseline water quality of the study region
|
|||||||||||||||||||||||||||||||||||||||||||||||||||||||||||||||||||||||||||||||||||||||||||||||||||||||||||||||||||||||||||||||||||||||||||||||||||||||||||||||||||||||||||||||||||||||||||||||||||||||||||||||||||||||||||||||||||||||||||||||||||||||||||||||||||||||||||||||||||||||||||||||||||||||||||||||||||||||||||||||||||||||||||||||||||||||||||||||||||||||||||||||||||||||||||||||||||||||||||||||||||||||||||||||||||||||||||||||||||||||||||||||||||||||||||||||||||||||||||||||||||||||||||||||||||||||||||||||||||||||||||||