INTRODUCTION
Environmental status of a region is determined by assessing the prevailing environmental conditions apart from ecological entities and their interaction. It represents the overall health and sensitivity of an ecosystem. Environmental status/profile assessment becomes essential for arriving at appropriate management strategies while ensuring the sustainability of natural resources. The environment profile assessment is done by evaluating the physical, chemical and biological components along with its functional abilities of an ecosystem. This includes the assessment of threats due to anthropogenic activities (like mining, dam construction, making of road or railway lines, spread of gas pipelines, building of an industry) which may alter the physical, chemical and biological integrity of the system. An attempt has been made to assess the environmental status of Yellur Panchayat and nearby villages as there have been changes in the local environment with the setting up of a power station for electricity generation using coal. India with a population of 1.21 billion has an installed electricity generating capacity of 181 GW (as on 31st august 2011) shared by the state (45.88%), central (31.15%) and private (22.95%) sectors. Coal is the dominant fuel with 99.50 GW installed capacity,followed by other sources like hydro (38.20 GW), renewable sources (~20 GW), gas (18GW), nuclear (4.78GW) and oil (1.19 GW). Total electricity generation in the country is about 811 Billion Units (BU)1. The national average of Transmission and Distribution (T&D) losses is about 27 % and energy deficit is nearly 10% 2. The high losses and widening deficit suggest a paradigm shift towards energy efficiency practices. Energy planning in India continues to be disintegrated in approach and supply sided evident from the push for large scale power projects. However, indigenous coal resources are unable to supplement the increasing energy demands due to fast depleting coal stocks. The government through congenial policy interventions has encouraged private players into large scale thermal power projects based on imported coal, ignoring the potential of clean and renewable sources of energy like solar, wind, biomass, geothermal, etc. that could be exploited and strategically integrated with the existing power grid or utilized off-grid. Also improvements in end-use energy efficiency through energy-efficient devices for lighting, heating etc. would further scale down the dependence on large power projects.This necessitates decentralized energy planning considering the regional energy demands, scope for energy conservation apart from the scope for location specific renewable energy sources3,4. Conventional generation of electricity from fossil fuel based sources like coal results in serious environmental problems (pollution of air, water and land) with far reaching local and global implications (global warming, climate change). Higher greenhouse gas (GHG) emissions are the drivers of global warming and resultant climatic changes. 2.1 Electricity in Karnataka: The state of Karnataka with the population of 61.12 million (as per 2011 census) meets its electricity requirements through the state, central or private operated hydro, thermal, renewable and nuclear units. These are supervised by the Karnataka Power Corporation Limited (KPCL) under the administrative control of Energy Department, Government of Karnataka (GoK). As part of its power sector reforms, the Karnataka Electricity Board (KEB) was dissolved into the T&D wing called Karnataka Power Transmission Corporation Limited (KPTCL) in 1999 followed by the formation of Karnataka Electricity Regulatory Commission (KERC). The KPTCL was unbundled into the following distribution companies 5:
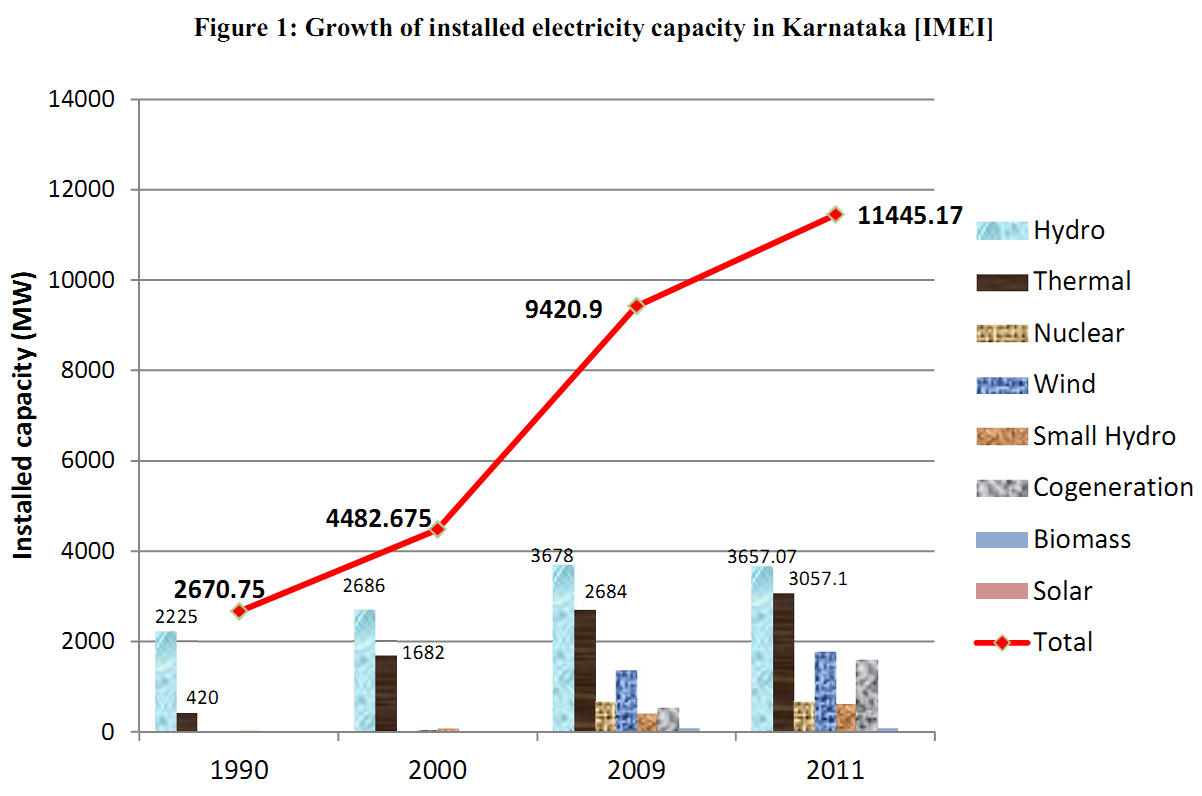
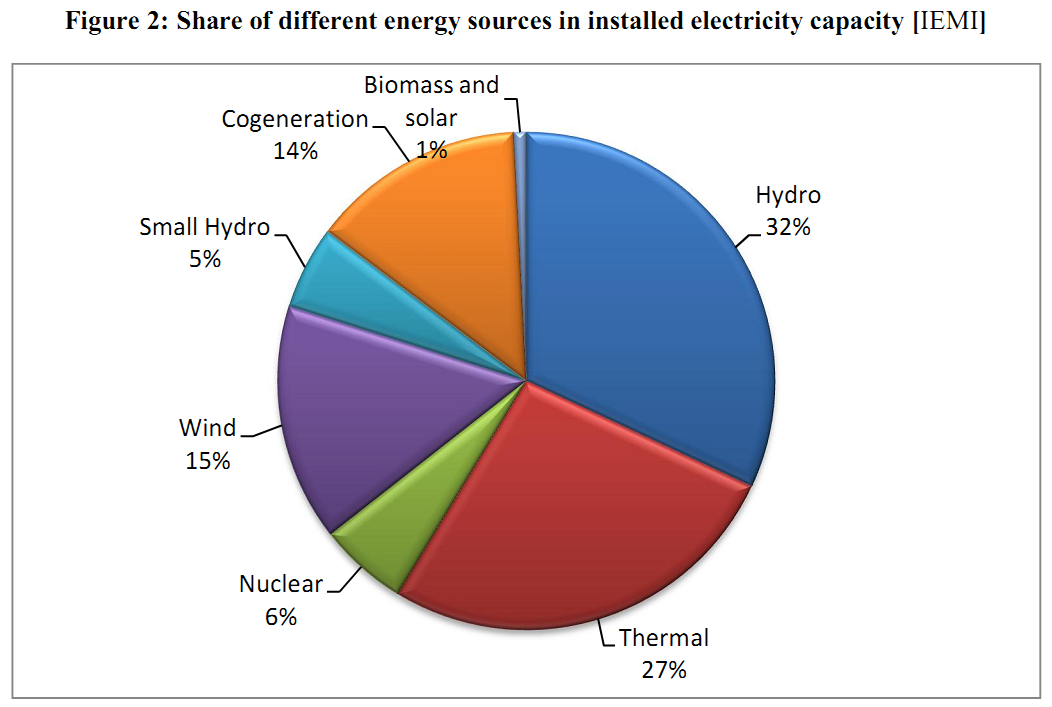
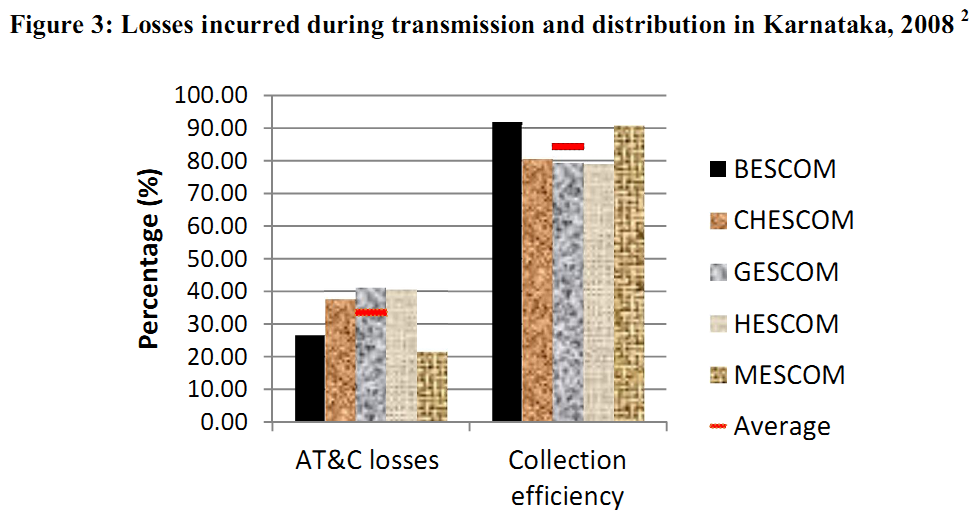
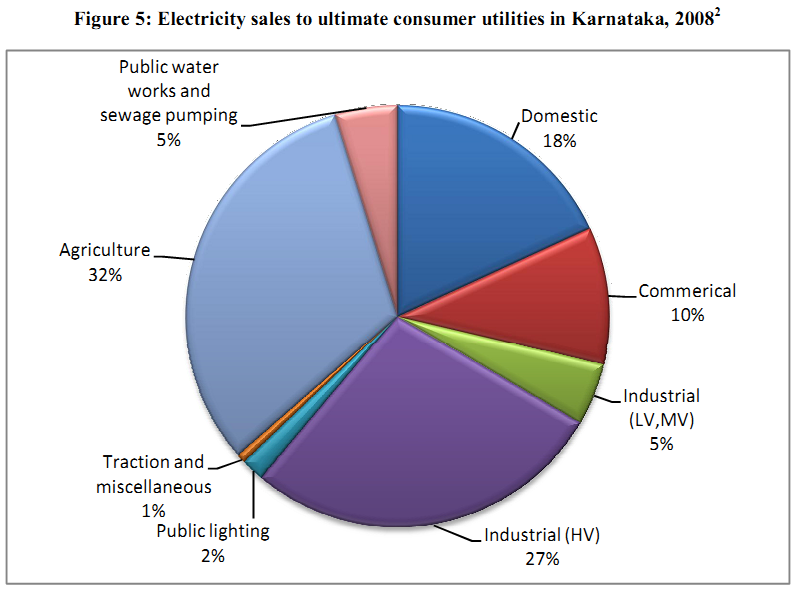
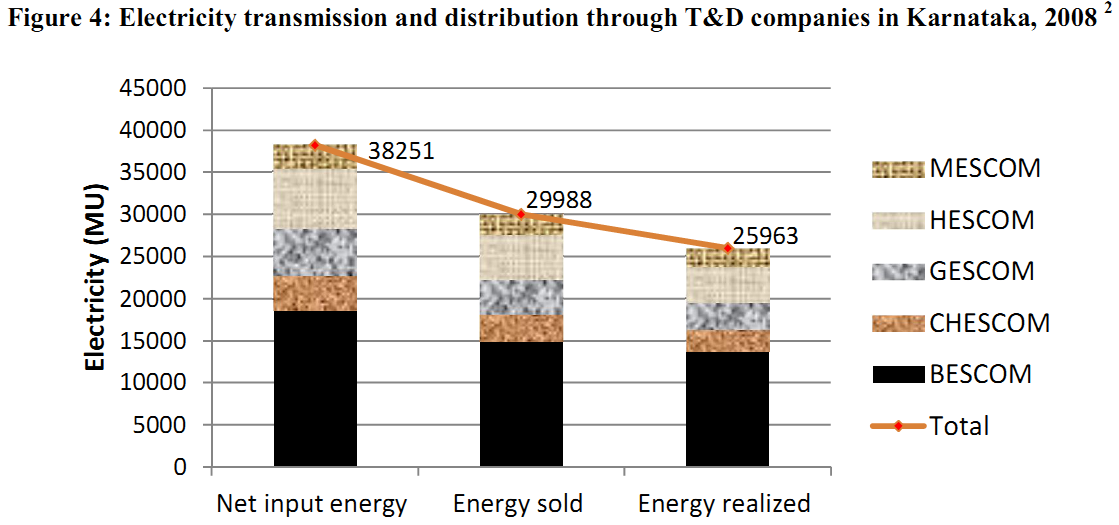
The installed capacity of electricity generation has doubled over the decades, (Figure 1). As of June 2011, the state had an installed capacity of 11.45 GW compared to 2.67 GW in 1990. The share of hydro, thermal (coal, diesel, gas), nuclear and renewable (wind, cogeneration, biomass, solar) sources in the total installed capacity of the state is presented in Figure 2. It can be seen that hydro has the highest share (32%) followed by thermal (27%), wind (15%) and cogeneration (14%). Thermal share in the state increased from 420 MW in 1990 to 3057 MW in 2011 5. Figure 1: Growth of installed electricity capacity in Karnataka [IMEI] Figure 2: Share of different energy sources in installed electricity capacity [IEMI] Karnataka has T&D lines of over 638890 circuit kilometers within the state which is nearly 9% of the national installation. The T&D losses are recorded at 18.9% (national average of 27.2%). However, the average Aggregate Technical and Commercial (AT&C) losses is 33.57% and average collection efficiency is 84.33% for the T&D companies viz. MESCOM, HESCOM, GESCOM, CHESCOM and BESCOM (Figure 3). The national averages of AT&C losses and collection efficiencies are 30.93% and 93.20% respectively. This underscores the fact that efficiency improvement continue to be of low priority in the state. Due to losses of the order of 12288 MU annually, the net electric energy generated and energy realized vary enormously as seen in Figure 4 (5). Figure 3: Losses incurred during transmission and distribution in Karnataka, 2008 2 Figure 4: Electricity transmission and distribution through T&D companies in Karnataka, 2008 2 Agricultural sector is one of the major consumer of electricity (32%) in the state followed by high voltage industrial (28%), domestic (18%), commercial (10%) and the remaining sectors (Figure 5). The Energy Department of GoK records an energy deficit of 7.60% and peak deficit of 7.30%. These deficits could be encouragingly minimized if efficiency improvement programmes are effectively directed to bring down the load. The per capita annual electricity availability is about 903kWh. There are a total of 24395 villages in the state of which 61 are yet to be electrified despite intensive electrification move through the Rajiv Gandhi Grameen Vidyuthikaran Yojana (RGGVY) programmeduring the last decade [http://recindia.nic.in/]. Figure 5: Electricity sales to ultimate consumer utilities in Karnataka, 2008 2 2.2 Further capacity addition in Karnataka The GoK has unfortunately adopted supply augmentation path evident from the push for 13375 MW of capacity addition through the state, central and private sectors by 2016. The highest capacity addition is implemented through the state owned KPCL followed by National Thermal Power Corporation (NTPC), Individual Power Providers (IPPs) and Renewable Energy (RE) developers. Of the total proposed and ongoing projects, coal based thermal power plants (KPCL, NTPC and IPPs) share is11100 MW. This accounts to 83% (coal based) compared to hydro, gas and renewables (Tables 1, 2, 3). Moreover, the state has an assured share of 4064 MW in ongoing and proposed central generating stations to be operational latest by 2020, which are primarily coal based (Table 4). This mode of coal based capacity addition will have ramifications to the 1) environment - due to increased pollution levels and related issues and 2) economy - due to exhausting domestic coal reserves and increased dependence on imported coal. Table 1: Ongoing and proposed power projects 5
Table 2: Projects under KPCL 5
Table 3: New projects by Central and IPPs 5
Table 4: On-going and proposed central generation stations where Karnataka has share 5
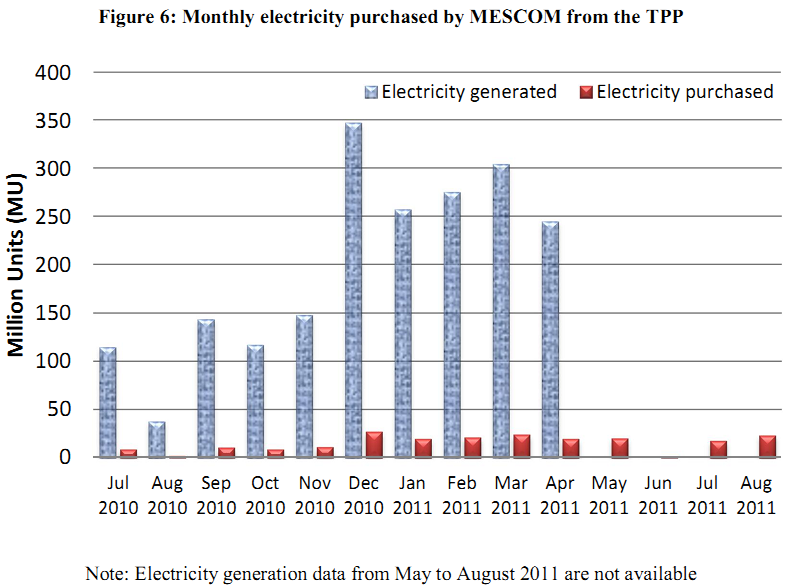
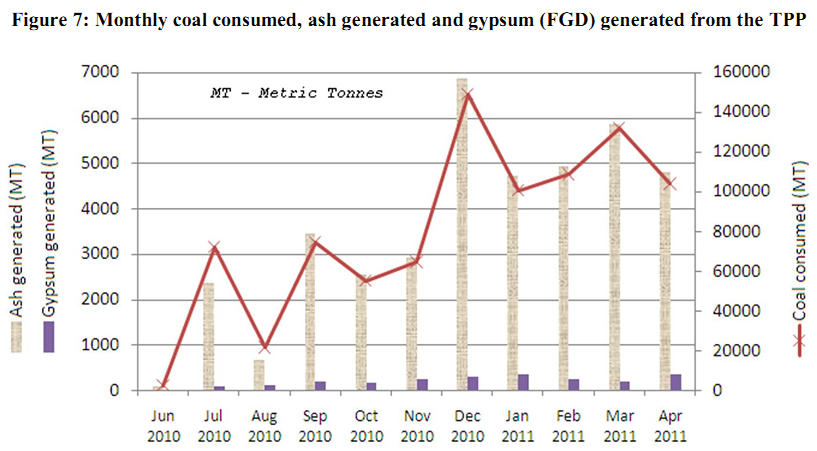
Renewable Energy Policy (2009-2014)of the state targets a capacity addition of 4.3 GW through renewable sources with an investment of INR 23890 crores (by 2014). Wind power generation has the highest share in total installed renewable energy capacity and an addition of 2.9 GW has been targeted (2014). The Karnataka Solar Energy Policy (2011-2016) for promotion of grid-connected solar projects targets 126 MW addition based on solar photovoltaic (PV)/thermal technology. Karnataka Renewable Energy Development Limited (KREDL) is promoting urban and rural electrification through renewable technologies. Solar PV plants in Kolar, Belgaum and Raichur (3MW each) arealready commissioned in the state. Also, 88 MW of total biomass based electricity is installed in the state. Karnataka has enormous solar (global horizontal radiation 5.41-6.02 kWh/m2/day), wind (16499 MW), biomass (1122.9 MW) and small hydro resource potential for electricity generation. Moreover, with advancement in energy conversion technologies, the prospects of renewable energy based electrificationare vast. In spite of the potential and prospects of renewable energy, continued dependence on coal for meeting electricity needsof the state is lamentable 6, 7, 8, 9, 10. 2.3 Electricity in Udupi district Agricultural, industrial, domestic and commercial sectors are the major consumers of electricity in Udupi district which is distributed by MESCOM (that also caters to the districts of Shimoga, Chikmagalur and Dakshina Kannada). The RGGVY programme under GoI is considering 248 already electrified villages in Udupi district (50 in Karkal, 99 in Kundapur and 99 in Udupi taluks) for intensive electrification. The district has 437 factories, 8310 small scale industries and Padubidri Industrial Area. A 600 MW coal based Thermal Power Plant (TPP) was installed in Yellur village of Udupi taluk despite the serious environment concerns raised by the local people and energy experts. This plant is operated by Udupi Power Corporation Limited (UPCL) since July 2010, which sells electricity to the Mangalore Electricity Supply Company (MESCOM). As per UPCL reports, the rate of coal consumptionis 0.407 kg/kWh, boiler efficiency is 87%, consumption of coalis 3.421 Mt per year at 80% PLF and generation of electricity is about 7008 kWh per kW. Figure 6 shows the month wise electricity purchased by MESCOM from July 2010 to July 2011 at its share of 8.33% from the TPP. UPCL claims to have synchronised with the state grid for electricity distribution. Figure 6 reflects the share of electricity purchased by MESCOM.The coal consumption per unit (kWh) of electricity generated ranges from 0.349 to 0.628 kg. Also, the quantity of fly ash generated to unit amount of coal consumed ranges from 0.0314 to 0.0462 (Figure 7). Figure 6: Monthly electricity purchased by MESCOM from the TPP Note: Electricity generation data from May to August 2011 are not available
Figure 7: Monthly coal consumed, ash generated and gypsum (FGD) generated from the TPP 2.4 Coal-based electricity generation Electricity generation in the country is predominately coal based and the following sections discuss feedstock, technologyas well asthe possible environmental impacts. Coal as a feedstock: Coal is a sedimentary rock containing combustible organic matter in the form of macerals (dehydrogenated plant fragments) as well as inorganic matterformed millions of years ago from plant materials decomposed aerobically and later metamorphosed under anaerobic conditions at high temperature and pressure. Proven reserves of coal are economically recoverable using existing technology and forms less than 10% of the global estimated reserves. Based on nature of plant/mineral materials and conditions of formation; peat, lignite, sub-bituminous, bituminous and anthracite varieties of coals are found. ‘Type’ refers to the coal’s composition, the origin of the organic portion, and its organic components. ‘Rank’ rates the maturity of coal by the degree of metamorphism they have undergone. It correlates generally with carbon content and heat content of the coal. Lignite has the least and anthracite has the highest ranks. ‘Grade’ gives the quality or suitability of coal for a particular purpose. The geological coal reserves in India are estimated at 276.81 billion tonnes (upto a depth of 1200 m and seam thickness of above 0.9 m), of which proven reserves are only 40%. These are mostly of anthracite, sub-bituminous, bituminous and lignite types. According to the Integrated Energy Policy Report (IEPR) of the Government of India (GoI), the extractable reserves are speculated to last only for another 40-50 years. The percentage composition of Indian coal is given in Table 5 11 Table 5: Constituents of Indian coal, based on samples from 30 TPPs
The Gross Calorific Value (GCV) of different grades of Indian coals ranges from 1330 - 6200 kcal/kg (Table 6). Good quality coal with high GCV is used for metallurgical industries and the lower quality ones (almost 78% of the total) are used for electricity generation.The current demand for Indian coal is above 700 million tonnes (mt) per annum, and the gap in supply is met through imports from Indonesia, Australia and South Africa. Also, these imported coals are of higher quality in comparison to Indian coals (Table 7). However ‘mineral nationalism’ advocated by many countries in recent times would certainly affect the coal imports and hence power generation in India (with too much dependence on coal). Table 6: Grades of Indian coal and their Gross Calorific Value (GCV)
Table 7: Comparison of domestic and imported coals [Properties of coal]
Coal ash: The inorganic matters in the form of minerals ranging from 2-40% for different varieties of coals are considered as impurities. The major mineral matters include aluminosilicate clays, silica, carbonates of calcium, magnesium or iron and sulphides among other traces12. All elements in coal excluding carbon, hydrogen, nitrogen, oxygen and sulphur contribute to formation of coal ash which is a mixture of oxides (silica SiO2, alumina Al2O3 and magnetite Fe2O3), hydroxides, carbonates, silicates and sulphates of calcium, iron, aluminum and other metals in trace amount 13. Indian coal has very high ash content. The MoEF through its notification in 1999 mandates the coal-based TPPs for proper and timely utilization of fly ash generated. Indian TPPs generated over 116 million tonnes (Mt) of fly ash in 2008/09, and is projected to increase to 170 Mt by 2012. Cement sector consumed 42.5%, while 16.4% was used for construction (road/embankments/dykes) and 12.3% for land reclamation 2. However, mismanagement of coal ash results in environmental issues, which is discussed in Annexure I. Coal-based thermal power technology: Raw coal containing impurities undergo beneficiation, wherein coal is reduced in size through breaking (>75 mm), crushing (<75 mm) and grinding (< 6 mm) using size reduction equipments. Many further physical and chemical processes are involved in coal beneficiation and this ‘washed coal’ is used for electricity generation 14 The major segments of a coal based TPP are 1) fuel supply and preparation, 2) boiler with furnace, 3) turbine and generator, 4) heat rejection unit, 5) condenser, 6) cooling tower and 7) units for emissions reduction and disposal. Washed coal is conveyed from bunkers to the mills for pulverizing and drying using pre-heated air. The coal combustion in the furnace generates heat (at 1400-1600°C) and releases flue gases where nearly 6% of the fuel heat is lost. Through the heat exchanger surface, the steam generator (boiler) receives heat from the hot flue gases and boils water to high pressure steam which drives large turbines. The turbines connected to the generators convert thermal energy of steam to mechanical energy where ~50% of the fuel heat input is lost. Further, the generator converts the mechanical energy from turbine to electricity at gross installed capacity. At one end of the furnace, flue gases are cooled down by the super-heater (SH), the re-heater (RH) and the feed water pre-heater (economiser). The air heater uses flue gas heat for combustion air and the cooled flue gas reaches exit temperature. Induced-draught fans that run on auxiliary power from the TPP are used to transport flue gases to different filtration units and finally help release the filtered gases through the flue stack. The exhaust steam from turbines is converted back to water in the condenser. This condensate is sent to the boiler as feed through a stream of preheating processes. In order to make-up for the loss, water is constantly fed into this stream through a De-mineralizing (DM) unit which removes undesirable salts causing hardness. The closed cooling water circuit in the condenser absorbs the waste heat of the exhaust steam. It is re-cooled in natural-draught cooling towers which releases the heated cooling air to the atmosphere. The power output from the TPP is called net output capacity and is the difference of gross installed capacity and auxiliary power requirements within the plant. These auxiliary requirements include electricity for coal milling, feed pump, combustion air, flue gas fans, station service transformer etc which ranges from 6-10% of the gross output. So the total efficiency of a thermal power plant is the ratio of net output capacity to the supplied fuel power. This total efficiency is based on various components like steam generator efficiency, thermal efficiency, mechanical losses of the turbine, generator efficiency, electrical and mechanical losses of the generator, auxiliary power efficiency etc. The highest potential for improving efficiency in thermal plants is found in the steam generator section. Plant Load Factor (PLF) of a power plant is the ratio of the actual power generated to the total power generation capacity and highlights the overall performance of TPPs 14 There are 107 TPPs in India under the central, state and private sectors with a total installed capacity of 99.50 GW (52% of the total installed capacity), generating electricity from coal or lignite. The average PLF of central and private thermal utilities in India is above 70% though state sector falls below due to the unavailability of coal, etc. Earlier studies reveal that only 30% of the coal based TPPs in India have high technical efficiencies 15. Addition of capacities and life extension projects for existing plants has also been envisaged by GoI. Captive Power Plants (CPPs) based near the coal mines majorly cater to the iron-steel, chemicals, aluminium, automobile, and cement industries. More number of Ultra Mega Power Projects (UMPPs) with private participation is being proposed in the country. The Ministry of Power (MoP) envisages the UMPPs to use supercritical technology to achieve higher fuel savings. Coal based Merchant Power Plants (MPP) which were initiated to attract private participation can trade the electricity generated on a competitive market facilitated by the GoI. Supercritical technology operating at higher efficiencies and producing lower emissions is expected to dominate capacity addition by the end of thirteenth Five-year plan 2 2.5 Emissions from coal-based thermal power generation SOX: Sulphur occurs in organic and inorganic forms. Inorganic forms like pyrite constitutes 30-70% of the sulphur in coal with trace amounts of marcasite, gypsum and iron sulphate. Organic forms like thiophene, organic suphide, mercaptan and organic disulphide constitutes the rest. Suphur in coal is approximately 10% and results in formation of major oxides like sulphur dioxide (SO2) and traces of sulphur trioxide (SO3) 12. The combustion of hard coal having sulphur content of 1% with 90% conversion results in SO2 emission levels of 1.6–1.7g/m3 14 NOX: Nitrogen constitutes 0.5-2% of coal and during combustion produces ~95% nitrogen monoxide (NO) and ~5% nitrogen dioxide (NO2) referred generally as nitrogen oxides (NOX). On combustion of high-volatile hard coal (with nitrogen content of 1.5%), a complete conversion of nitrogen would produce NO emissions of 4,500 mg/m3 at 6% O2 14. The conversion reactions are: O + N2↔ NO + N (high oxygen condition) (1) COX: Huge amount of CO2 is produced during the combustion of coal and released into the atmosphere. Coal-based TPPs in India emitaround 980 gCO2/kWh contributing to 60% of CO2 emissions(where CO2 shares over 50% of the overall GHG emissions) in the country 16. Incomplete combustion of coal results in production of carbon monoxide (CO), hydrocarbons and soot (negligible). In fact, CO is an intermediate during formation of CO2 on complete combustion 14 Trace elements: Coal also contains many trace elements including mercury, selenium and arsenic naturally. Although abundance of mercury in coal is comparatively lower, the higher consumption of coal results in significant release. Almost 90% of the mercury is not retained in the ash and hence quantification is cumbersome from the flue release. Based on a detailed literature survey, the world-wide average mercury content is 0.10±0.01 ppm. If expressed on an ash basis, bituminous rank coals contain 0.87±0.08 ppm Hg, and lower rank coals contain 0.62±0.06 ppm. Analysis of Indian bituminous coal revealed Hg contents ranging from 0.15 to 0.87 ppm 17 2.6 Environmental impact of coal-based power generation Impact of fly ash (heavy metal leaching, bio-accumulation, mutagenicity, genotoxicity, radioactivity): During formation of coal ash, traces of vaporous pollutants and heavy metals also accumulate over the ash particles. The quantity and distribution of particles depend on the ash content in coal, combustion systems and combustion conditions. Coal ash contains toxic elements which are hazardous for living organisms. Elements having lower mass (Cu, Zn) precipitate with the fly ash, while elements having higher mass (Co) settle in bottom ash 18. Enrichment of components is found to be higher in fly ash when compared to bottom ash 19. Based on the nature of coal and combustion conditions, fly ash may contain various levels of heavy metals such as antimony, arsenic, barium, boron, cadmium, chromium, cobalt, copper, lead, mercury, molybdenum, nickel, selenium, silver, and zinc 20. These elements can potentially be released to the soil, surface water, and groundwater by leaching processes also affecting the biodiversity A study of three coal thermal plants based in Delhi reveals the heavy metal contents of fly ash and bottom ash (Table 8). Heavy metal concentration in fly ash is higher than bottom ash. Cr and Zn concentrations are higher in fly ash while Mn is higher in bottom ash 18. According to the analyses on fly ash and bottom ash samples collected from five thermal plants (ranging from 90-3000 MW capacities) in India, concentrations of toxic elements, such as arsenic, mercury, lead and cadmium were in the range as given in Table 9. Enrichment of components was found to be higher in fly ash when compared to bottom ash 19. The investigation of heavy metals in groundwater (bore wells) near an ash disposal site in Orissa, India showed high concentrations of iron, barium, copper, manganese, lead, vanadium and zinc 21. It was reported that fly ash contains higher concentrations of Boron (B), Cobalt (Co), Chromium (Cr), Cadmium (Cd), Molybdenum (Mo), Nickel (Ni), Arsenic (As) and Selenium (Se) than normally found in soils 22. Table 8: Heavy metals in fly ash and bottom ash samples collected from 3 TPPs
Table 9: Heavy metals (mg/kg) in fly ash and bottom ash samples collected from 5 TPPs
A study by Natusch et.al 23 reveals that Na, SO4, As, Se, Mo, Cr, and Pb levels were higher in fly ash affected ground water than in samples from unaffected areas. Baba et.al 24 studied the effect of Yatagan TPP on surface and ground water. Their study revealed that concentrations of Ca2+, Cd2+, Pb2+, and SO42- exceed the WHO limits in wells outside the ash pond and near the plant. Leaching of soluble ions zinc (Zn), lead (Pb) and iron (Fe) from ash ponds into the ground water was observed in studies near Vijayawada Thermal Power Station. The leaching potential of ash ponds is higher due to diurnal and seasonal variations in temperature, moisture and other parameters. The water samples within a distance of 10 km around the TPP showed an increase in TDS, calcium hardness, magnesium, total hardness, chlorides and alkalinity 25. Studies indicate that leachability of cationic metals such as cadmium, chromium, zinc, lead, mercury, and silver increases with decreasing pH values or at acidic conditions 26. Bio-accumulation of heavy metals in plants lead to increased elemental composition eventually entering the food chain. An investigation of fly ash contaminated regions in Uttar Pradesh, India showed the bio-accumulation of heavy metals like iron, zinc, copper, molybdenum, boron, silicon, aluminium, chromium, lead, cadmium, mercury and arsenic in native aquatic, terrestrial and algal species in the vicinity 26 Leachate from fly ash dumpsites has genotoxic potential and may lead to adverse effects on vegetation and on the health of exposed human populations. A study on the mutagenicity and genotoxicity effects of fly ash leachate showed predominance of the metals like sodium, silicon, potassium, calcium, magnesium, iron, manganese, zinc, and sulphate. The Ames Salmonella mutagenicity assay conducted on two-tester strains and genotoxicity assay on fly ash leachate carried in vitro on human blood cells and in vivo on Nicotiana plants indicated that the leachate was directly mutagenic and resulted in DNA damage in whole blood cells, lymphocytes, and in Nicotiana plants 27. Certain organic constituents contained in coal, during combustion results in formation of organic pollutants (mutagens and carcinogens) like Polycyclic Aromatic Hydrocarbons (PAH) and Polychlorinated biphenyls (PCB) which are adsorbed to the fly ash. The quantity of organic pollutants like PAHs and PCBs generated during coal combustion depends on the feed quality, combustion temperature, residence time in the combustion zone, turbulence and air to fuel ratio. Due to high rate of coal consumption, reasonable amounts of fly ash are released through the stack even in presence of ESPs. Based on the fly ashes generated from five thermal plants in India, the concentration of Benzo(a)pyrene which is the most potent carcinogenic and mutagenic Polycyclic Aromatic Hydrocarbons (PAH) varied as 0.82 - 18.14 ng/g. The total PAHs and Polychlorinated biphenyls (PCB) in the fly ash samples were found to be in the range of 43.61 - 936.14 ng/g and 7.34 ng/g - 178.69 ng/g respectively28. Investigations in thirty power plants in India reveal enrichment of radionuclide by 2-5 times in the fly ash compared to coal samples, which are of same order as ambient soil (Table 10) 11. Table 10: Radionuclide in coal, fly-ash and soil samples collected from 30 TPPs in India
SOX, NOX, COX: Table 11 lists an assessment of CO2, CO, SO2 and NO emissions of eleven TPPs in India with varied installed capacities (60, 67.5, 210 and 250 MW) 29. Increased levels of CO2 are a concern for global warming and rising temperatures. Enhanced levels of SOX and NOX change the quality of water during precipitation (acid rain refers to the precipitation with dissolved SOX and NOX). The rain water enriched with SOX and NOX leads to acidification of aquatic ecosystem, acidification of soil, damage to vegetation at higher elevation, decay of building materials and paints, formation of smog, enhances ground level ozone, impaired functioning of the upper respiratory system in humans and animals (mammals, amphibians, etc.). In addition to this, their particulate matter derivatives—sulphates and nitrates—contribute to visibility degradation and harm public health. High concentrations of sulphur dioxide have affected breathing, causing respiratory illnesses, and also aggravating existing heart and lung diseases. Exposure at very low concentrations can irritate the lungs and throat and cause bronchitis. Also, an exposure to low levels of SO2 over a long period depletes the respiratory system's ability to defend against bacteria and foreign particles 30, 31, 32. Table 11: Range of CO2, CO, SO2 and NO emission from TPPs in India
Trace elements: The trace elements that are released during combustion will have potentially harmful impacts to both human health and the environment. Nearly 50 – 60% of the mercury is retained in the cleaned coal whose combustion in TPPs pose threat of release to the environment 17. Other pollution impacts: The hydrobiological parameters in the vicinity of ash pond and cooling water outfall from Ennore Thermal Power Station recorded an increase in mean temperature (35 °C), salinity (3.5%), nitrite,ammonia, phosphate, silicate, suspended solids, BOD and decrease in pH (8.1), dissolved oxygen (DO) (5.5 mg l-l), nitrate 33. An increased TDS, TSS, hardness, calcium, magnesium, and chlorides in Satpura dam due to the effluents discharged from TPP was reported at Sarni, Madhya Pradesh 34. Coastal TPPs are associated with marine pollution. The temperature of water was high up to 2 km from discharging point of Tuticorin TPP and the depth of Bay, ash layer and turbidity of the water increased due to ash slurry discharge 35.The cooling water discharge of Tuticorin TPP to Tuticorin Bay deteriorated the fish population 36. The ash slurry and cooling water discharge to shore of Bay of Bengal increased temperature, salinity, nitrite, ammonia, phosphate, silicate, suspended solids, BOD and decreased the dissolved oxygen, nitrate and total gross productivity 33. Discharge of water with high temperature can result in increase of photorespiration and decrease in biomass productivity (algae) leading to a decline in fish production. 2.7 Mitigation of Pollutants Along with other impurities, minerals are removed during beneficiation in coal washeries. The extraneous mineral matters causing ash formation are physically separable even up to the extent of less than 1% 12. Particulate reduction: Mechanical separators, fabric filters or Electrostatic Precipitators (ESP) are used to remove particulates from flue gas based on emission limit requirements. Mechanical separators remove particulates based on their property of inertia. Removal efficiency increases with increasing particulate size and reaches up to 90%. ESPs charge the particulates and deflect them using an electric field. They have high particulate removal efficiency of up to 99.8 % with less pressure losses and are economical for large power plants. Fabric filters are permeable filtering media made of synthetic or natural fibers on which particulates are collected and removed at specific intervals. Certain filters even reach up to 99.9% particulate removal efficiencies and are economically viable alternatives for ESPs. However, its usage is less common in large power plants 14 SOX reduction: Desulphurisation methods are used to reduce sulphur content of the fuel and desulphurise flue gas. Sulphur content in coal is reduced majorly through physical processes during coal preparation. In the case of coal containing 70% of sulphur pyrite and 30% of organic sulphur, the physical cleaning reduces the sulphur content by ~50%. However, organic suphur bonded to the carbon is difficult to be removed 12. Sulphur oxides (SOX) in flue gas can be captured by alkali, alkaline earth or metal oxides. These processes work in dry (additive injection in furnace), semi-dry or wet (downstream desulphurization) conditions and typically employ limestone (CaCO3), lime (CaO) or hydrated lime (Ca(OH)2). Lime being abundant is a more commonly used capturing agent, delivering gypsum as a reusable byproduct. Dry additive processes achieve only up to 60% desulphurisation efficiency and are minimally employed. Wet processes achieve 95-99% and semi-dry processes achieve around 80% 14. NOX reduction: Primary measures for limiting formation of NOX include low NOX burner, furnace air staging, coal re-burning etc with reduction efficiencies in the range of 30-60%. These are called combustion engineering methods. Secondary downstream DeNOX processes are mostly based on reduction of NO already formed during combustion of coal. Two commonly used methods are Selective Non-Catalytic Reduction (SCNR) and Selective Catalytic Reduction (SCR) where NO is reduced to molecular nitrogen and water vapour by ammonia (NH3). NO removal efficiency of 30-50% is typically achieved (upto 70% on favourable conditions) especially in furnaces with low thermal outputs and small furnace cross section where SCNR method is suitably employed. SCR method uses less amount of NH3 with higher NOX removal efficiency of 70-90% on favourable conditions 14. |
|||||||||||||||||||||||||||||||||||||||||||||||||||||||||||||||||||||||||||||||||||||||||||||||||||||||||||||||||||||||||||||||||||||||||||||||||||||||||||||||||||||||||||||||||||||||||||||||||||||||||||||||||||||||||||||||||||||||||||||||||||||||||||||||||||||||||||||||||||||||||||||||||||||