MATERIALS AND METHODS
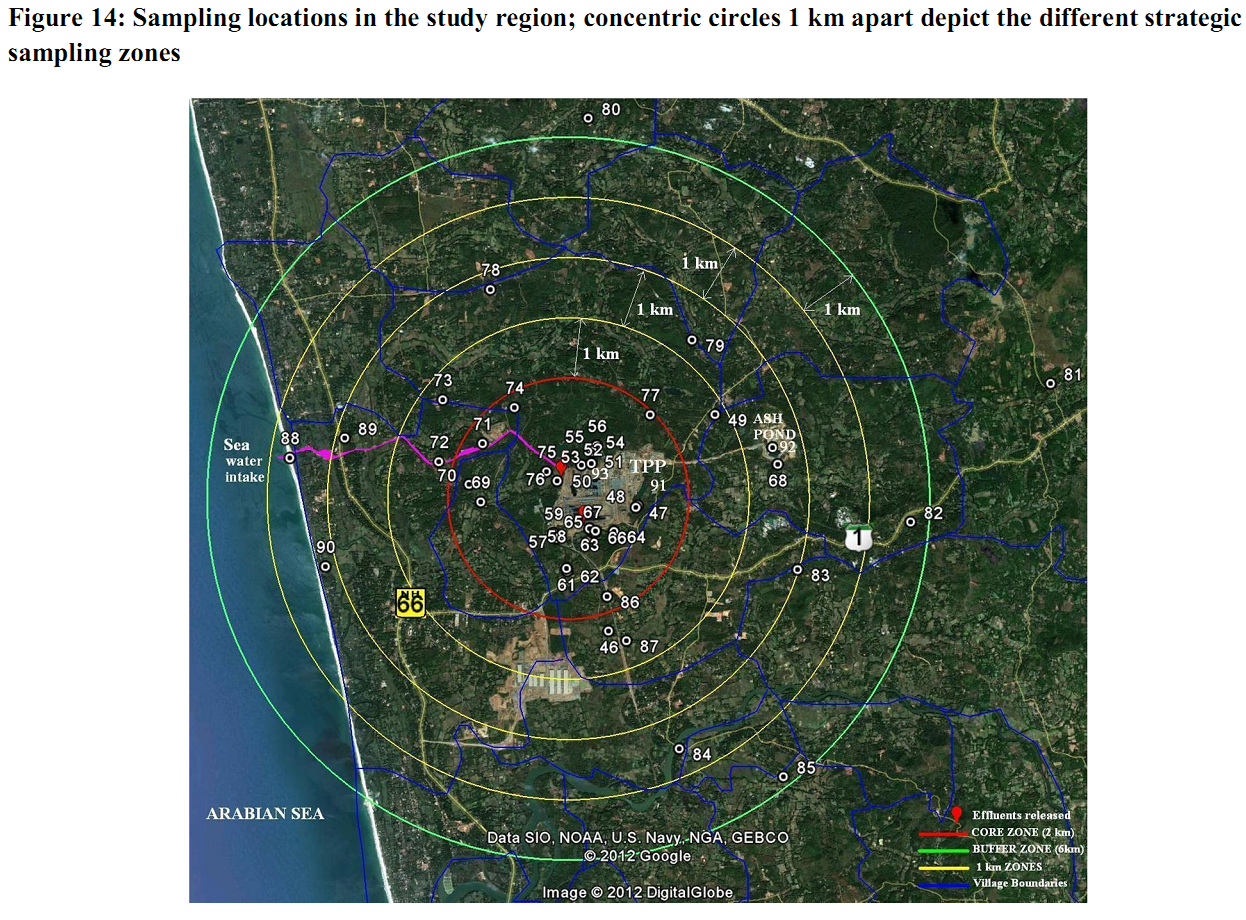
5.1 Field sampling and analyses Water was sampled from select locations within a 2 km core zone as well as 6 km buffer zone around the TPP site during field visits fromAugust to November, 2011. These sampling locations were assigned codes (ranging from 46 to 93) and spatially mappedover the study region (Figure 14). Two villages beyond the buffer zone were also visited for sampling to understand the impact (if any) beyond the study region. Table 16 lists the sampling locations collected during field visits. The water samples were collected depending upon accessibility and availability from open-wells, bore-wells, ponds, effluent outlets, streams etc. These were collected in one litre acid washed polythene bottles. On site laboratory studies as well as laboratory analysis were undertaken. The water quality parameters were analyzed with the help of standard methods (APHA, 1998). Table 17 lists the parameter wise method adopted for quantification. In addition to the primary field investigations, water quality analyses reports (for villages in the study region for the period December 2010 to June 2011 as well asin February, May and October, 2011) were collected from the regional office of the State Pollution Control Board (PCB). Figure 14: Sampling locations in the study region; concentric circles 1 km apart depict the different strategic sampling zones Table 16: Sampling locations in the study region
Table 17:Standard methods followed for water quality analysis
5.2 Land use land cover analysis The spatio-temporal changes in land use and land cover (LULC) of the study region after the introduction of TPP as well as other developmental activities were studied using Remote Sensing (RS) with geospatial techniques. The collection of remotely sensed data involving monitoring of large areas enables the change analyses at local, regional and global scales over time 43. Remote sensing data along with Global Positioning System (GPS) help in effective land cover analysis 44. Successful utilization of RS data for LULC detection requires careful selection of appropriate data. RS data: 1) IRS 1C LISS III pan merged data (2003), 2) IRS – P6 LISS-III (2011), and 3) Google Earth (http://earth.google.com) summarised in Table 18 were used in this study. Table 18: Details of Remote Sensing data
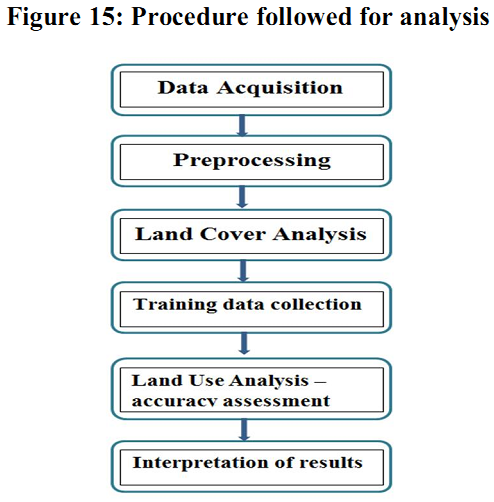
Ancillary data: Ancillary data provides information to assist the interpretation of different land use types from remotely sensed images. In this study, topographic maps of scale 1:50,000 generated by Survey of India provided ground control points to rectify remotely sensed images and scanned paper maps. The GPS (Garmin GPS unit) provided location details and field measurements. Method: Figure 15 depicts procedure followed in the study. The RS data of IRS satellites (Indian Remote Sensing Satellites launched in the course of the Indian Space Programme) were used. This requires pre-processing stages like atmospheric correction and geometric correction in order to enable correct area measurements, precise localization and multi-source data integration 45, 46. Geometric correction is the process of referencing a map/image to a geographic location (real earth surface positions) using GCPs (ground control points). GCPs were collected from the topo-sheet (SOI) as well as from field. This helped in geometrically correcting the distorted remote sensing data. Figure 15: Procedure followed for analysis Land cover analysis and Land use analysis: Spatiotemporal change detection process involves determining the changes associated with LULC properties with reference to geo-registered multi temporal remote sensing data. The monitoring of land cover involves the computation of vegetation indices. The land cover analysis was done using NDVI (Normalized Difference Vegetation Index). Among all techniques of land cover mapping, NDVI is most widely accepted and applied 47, 48, 49, 50. Calculation of NDVI for multi-temporal data is advantageous in areas where vegetation changes rapidly. The capability of capturing changes in land cover and extracting the change information from satellite data requires effective and automated change detection techniques 51. NDVI is calculated by using visible Red and NIR bands of the data reflected by vegetation. Healthy vegetation absorbs most of the visible light that hits it, and reflects a large portion of the near-infrared light. Sparse vegetation reflects more visible light and less near-infrared light. NDVI for a given pixel always results in a number that ranges from minus one (-1) to plus one (+1), using Equation 1
Training data was collected in order to validate the RS results andto improve the accuracy of image registration, preparing training sites and to check the accuracy of the classified data. The land use analysis was carried out with supervised classification scheme with select training sites.The supervised classification approach preserves the basic land use characteristics through statistical classification techniques using a number of well-distributed training pixels. Gaussian Maximum Likelihood algorithm is a common, appropriate and efficient method in supervised classification techniques by using availability of multi-temporal “ground truth” information to obtain a suitable training set for classifier learning. Supervised training areas are located in regions of homogeneous cover type. All spectral classes in the scene are represented in the various subareas and then clustered independently to determine their identity. The following classes of land use were examined: built-up, water, cropland, open space or barren land, and forest. Such quantitative assessments, will lead to a deeper and more robust understanding of land-use changesforan appropriate policy intervention. GRASS GIS (Geographical Analysis Support System), which is a free and open source software having the robust support for processing both vector and raster files accessible at http://wgbis.ces.iisc.ac.in/grass/index.phpis used for the analysis. Accuracy assessments decide the quality of the information derived from remotely sensed data. The accuracy assessment is the process of measuring the spectral classification inaccuracies by a set of reference pixels.These test samples are then used to create error matrix (also referred as confusion matrix) kappa (κ) statistics and producer's and user's accuracies to assess the classification accuracies. Kappais an accuracy statistic that permits us to compare two or more matrices andweighs cells in error matrix according to the magnitude of misclassification. 5.3 Socioeconomic survey A socioeconomic survey was conducted based on contingency evaluation technique through a structured questionnaire. Stratified random sampling was adopted and samples were chosen so as to represent all categories in the villages (Yellur, Nadsal, Padebetu, Santhur, Nandikur, Palimar, Karnire) within 6 km buffer zone (Figure 9). The questionnaire covered the parameters relating to crops yield, vegetation, livestock, personal health and hygiene as well as livelihood. In addition, select medical practitioners were interviewed to understand the health instances related to the changes in environmental status subsequent to setting up of TPP. |
||||||||||||||||||||||||||||||||||||||||||||||||||||||||||||||||||||||||||||||||||||||||||||||||||||||||||||||||||||||||||||||||||||||||||||||||||||||||||||||||||||||||||||||||||||||||||||||||||||||||||||||||||
 … (1)
… (1)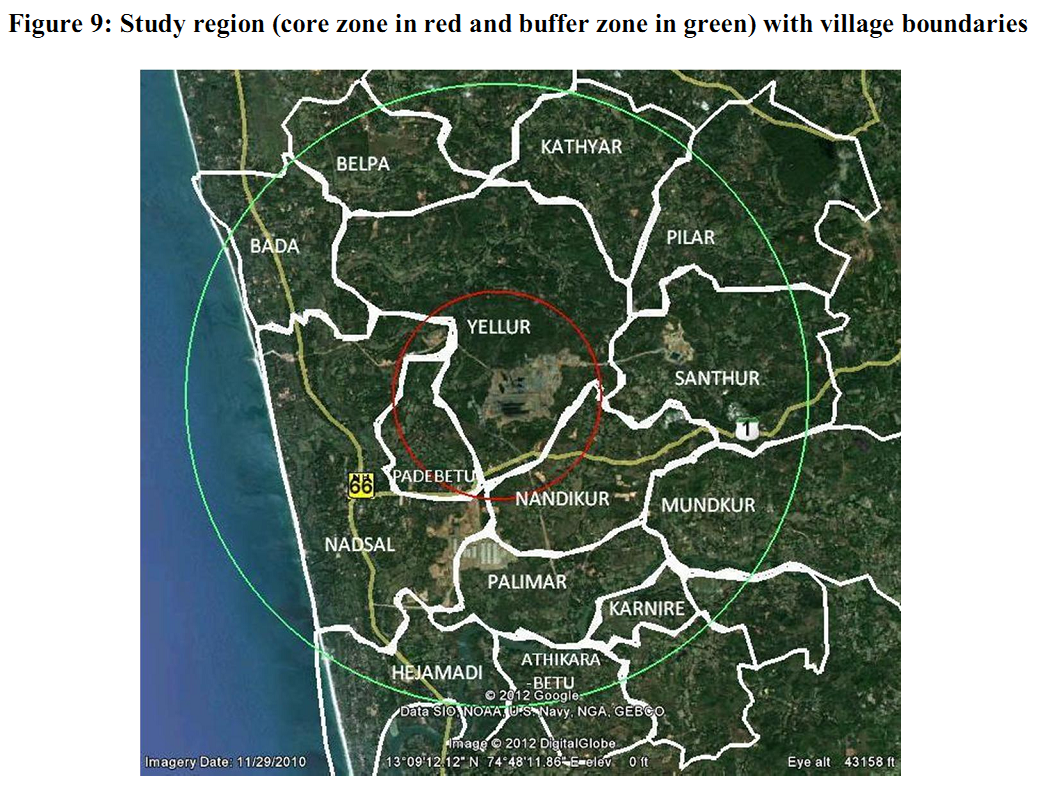