|
 |
 |
|
| E Mail: cestvr@ces.iisc.ac.in , energy@ces.iisc.ac.in URL: http://ces.iisc.ac.in/energy , http://ces.iisc.ac.in/biodiversity | |||
| Synopsis Introduction Study Area Objectives Methodology Results and Discussion Acknowledgement Bibliography | Home PDF |
|
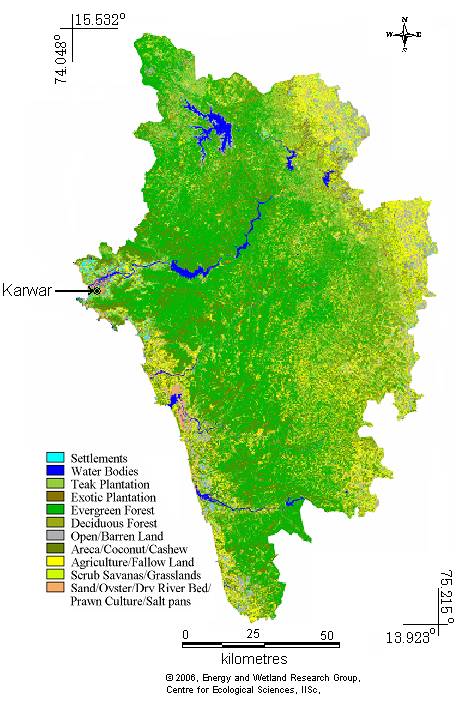
RESULTS AND DISCUSSION Figure 5 illustrates the forest cover in Uttara Kannada in 1984. The figure shown is a digitized vector image obtained from the Forests of South India map, by the French Institute. The figure shows a large area covered under the evergreen belt. Semi-evergreen is seen in pockets blended with the evergreen and moist deciduous patches. Moist deciduous forests are found towards the eastern part of the district. It is observed that the dry deciduous patch is very less and is found in the north eastern part of the district, mainly in Mundgod taluk. Figure 7 depicts the NDVI image of Uttara Kannada. This gives the vegetative cover of the district. The Western Ghats region of the district showed a very high vegetative index value implying that the area is heavily forested. Besides the river valley region also showed a reasonably high index value. Figure 8: Land-use map from IRS 1D, LISS 3 data Figure 6 depicts merged and cropped false colour composite (FCC) image of Uttara Kannada. This figure clearly distinguishes the different features associated with the image. The features that are at a high altitude such as the ghat section, and hilly areas could be identified easily from this image. Also the vegetation cover is very distinct, being bright in colour and thus easily identified. The transportation network such as the Konkan railway, which is a recent construction (not marked on the toposheet), is very distinctly visible on this composite image. Built up areas, water bodies, bridges, national highways and agricultural land are also clearly distinguishable. Land-use classification for Uttara Kannada was done using parallelepiped, minimum distance to mean and maximum likelihood hard supervised classifiers respectively. The area is classified into 11 land-use classes namely, urban agricultural land, waste land, forest, water bodies, etc. Parallelepiped classified images contains many areas which are left unclassified. While in minimum distance to means classifier, many pixels were not been assigned to the appropriate class or left unassigned. Figure 8 depicts landuse map of the district classified using Gaussian Maximum Likelihood Classifier (GMLC). The level of accuracy in GMLC is 88.5% (Table 4 and 5)compared to unsupervised classifier (58.07%). Kappa coefficient - KHAT k value (0.79) obtained from supervised classification matrix indicated that an observed classification is 79 percent better than one resulting from a chance.According to Parallelepiped classifier, the percentage of each type of landcover area is less compared to that of Minimum Distance to Mean classifier and the Maximum likelihood classifier. For example, the percentage of forested area (evergreen type) depicted in case of Parallelepiped is 34, whereas, in case of Minimum Distance to Mean, it is 39.59%, and in case of Maximum Likelihood it is about 40.66%. Area under various land-uses are listed in Table 3. The Maximum likelihood classifier is the best type of classifier with the overall accuracy (Table 4 and 5) of 88.5% compared to the other two types. Table 3: Area under various land-uses in Uttara Kannada district
Table 4: Error matrix of classified data (using MLC)
Table 5: Producers, Users and Overall Accuracy for the error matrix
Agriculture/Fallow Land: AFL, Areca/Coconut/Cashew: ACC, Exotic Plantation: EPL, Teak Plantation: TPL, Evergreen Forest: EGF, Deciduous Forest: DEF, Scrub Savanas/ Grasslands: SSG, Settlements: SMS, Open/Barren Land: OBL, Sand/Oyster/Dry River Bed/Prawn Culture/Salt pans: SOR, Water Bodies: WAB On comparing figure 5 and 8, it is very clear that the evergreen forests have undergone tremendous transformation. Most of the evergreen forested area have been transformed into semi-evergreen forests, and some have been converted into plantations such as, Teak, Arecanut, Acacia spp., etc. It is found that semi-evergreen and moist deciduous forest types predominate the forested area of Uttara Kannada. The complete stretch of the central ridge zone (ghat section), which was once dominated by the evergreen forests, is now dominated by the semi-evergreen forest. Evergreen is seen in patches mainly towards the south-west and in the ghat section. Moist deciduous is seen almost in all places distributed throughout the district. It is more common in the eastern Sirsi, south of Yellapur, eastern Siddapur and western region of the coastal taluks. Dry deciduous forests were spotted in the taluks of Mundgod, Haliyal, western Sirsi and north-eastern part of Yellapur. |
|||||||||||||||||||||||||||||||||||||||||||||||||||||||||||||||||||||||||||||||||||||||||||||||||||||||||||||||||||||||||||||||||||||||||||||||||||||||||||||||||||||||||||||||||||||||||||||||||||||||||||||||||||||||||||||||||||||||||||||||||||||||||||||||||||||||||

| E-mail | Sahyadri | ENVIS | Energy | GRASS | CES | IISc | E-mail |