| 


   | 


            Prospects of Renewable  Energy  
        
          | 
       
   
 Energy  is essential for economic and social development of a region or a nation.  However, consumption of fossil fuels is the major cause of air pollution and  climate change. The threat posed to sustainability by greenhouse gas emissions  and deterioration of the natural resource base (for example oil crisis, Fuel  wood scarcity, etc.) has caused worldwide concern.  Improving energy  efficiency and de-linking economic development from energy consumption  (particularly of fossil fuels) is essential for sustainable development of a  region. The energy sector, on one hand, is a part of the economy and on the  other hand it itself consists of parts such as energy supply and energy demand  interacting with each other. Both these interactions are of immense complexity.  Energy is required for all the economic activities. Energy supplies are  essential for both intermediate production as well as final consumption. So,  economic development is dependent on the energy system of the country. In turn,  the implementation of technologies or improvement of the energy system is  dependent on economic factors such as capital costs, energy prices etc. Also,  the demand supply balances involve the flow of energy from source as primary  energy to service as useful energy. At each stage of the energy flow,  technologies are involved with different conversion efficiencies and losses 
India has  abundant renewable energy resources such as solar, wind, biomass,  etc. which are environmentally benign and can  effectively meet energy demand. About 5200 MW of power generating capacity  based on renewable energy sources has been installed in the country so far,  which constitutes about 3.8% of the total installed capacity. The effective  transition from a fossil fuel driven energy system to the renewable energy  systems is possible only through the policy shift, capacity building,  strengthening institutions and building infrastructure. There is a need for  strengthening of existing research institutions and creation of a few centers  of excellence that have state of the art research / testing facilities for  renewable energy technologies.  
Centralised  energy planning exercises cannot pay attention to the variations in  socio-economic and ecological factors of a region which influence success of  any intervention. Decentralised energy planning advocated these days is in the  interest of efficient utilisation of resources, ensuring more equitable sharing  of benefits from development. The regional energy planning endevaour needs to  focus on the area based decentralised energy plans for meeting energy needs for  subsistence and development with least cost to the environment and the economy.  The regional planning mechanisms take into account all resources available and  demand in a region. This implies that the assessment of the demand and supply,  and the intervention in the energy system which may appear desirable due to  such exercises, must be at a similar geographic scale. For example, bioresource  assessment of supply and demand at the aggregate level is likely to be misleading  as scarcity and surplus is always at a localised level. Consequently, the  energy interventions in the form of energy supply enhancement, containing  demand and/or encouraging alternative fuels may be aimed at the wrong area or  target group. 
  India's present energy  scenario calls for the effective management of all available resources in order  to attain national objectives. A well-balanced fuel mix, in which all energy  resources are appropriately utilized, is essential for sustainable development.  An energy resource that are renewed by nature and whose supply is not affected  by the rate of consumption is often termed as renewable energy. Planned  interventions to reduce energy scarcity can take various forms, such as  
  
    - energy conservation through promotion and use       of energy efficient stoves for cooking and water heating, compact       fluorescent and LED bulbs in place of ordinary incandescent bulbs, 
 
    - supply expansions of bio-resources through       agroforestry, farm forestry and community forestry, and 
 
    - alternatives—renewable sources of energy such       as micro/ mini/small hydropower plants and wind, solar and biomass- based       systems


Ecologically  sound development of the region is possible when energy needs are integrated  with the environmental concerns at the local and global levels. Energy planning  entails preparation of area based decentralised energy plans for meeting energy  needs for subsistence and development with least cost to the environment and  the economy. The need to search for renewable, alternate and non-polluting  sources of energy assumes top priority for self-reliance in the regional energy  supply. This demands an estimation of available energy resources spatially to  evolve better management strategies for ensuring sustainability of resources.   The spatial mapping of availability and demand of energy resources would help  in the integrated regional energy planning through an appropriate energy supply  - demand matching.  
  Insights to Renewable  Energy harvesting in the campus of Agastya Foundation, Kuppam 
  The  electric energy requirement in Agastya Foundation is mainly for lighting the  roads and buildings (lighting, fans, computers, projectors and for the  operation of science models). Most of the loads in the organisation are low  power loads and heating loads (met by solar water heaters). Sustained supply of  electricity to meet the demand in the campus is possible by harvesting renewable  sources through appropriate technologies. Source wise renewable energy potential  assessment is done to recommend suitable renewable energy harvesting  technologies.  
  Solar energy: Kuppam  being in arid region receives abundant solar energy throughout the year.  Agastya campus at Kuppam receives cloud free solar irradiance for over 7 months,  which can be harvestedfor thermal and electric energy requirements in the  campus. Figure 1 gives the monthly variation of solar insolation in the region.  The region receives insolation over 6 kWh/m2/d during summer  (February to May) which reduces in monsoon and winter. 
  The  region receives highest insolation of 6.51 kWh/m2/d during March  whereas lowest is observed in November (4.17 kWh/m2/d). The average  solar insolation in the region is about 5.16 kWh/m2/d. This  potential is adequate to generate heat and electric energy to meet domestic  energy demand [1]. 
  
  Figure  1: Monthly variation in solar insolation 
  
   
  Figure  2: Harvestable rooftop electricity potential from SPV installation 
 
  The  organisation has buildings (such as guest house, labs, workshop, auditorium  etc.)with reinforce concrete flat roofs. Most of these buildings require electricity  during day time except guest houses where the electricity is mainly used for  lighting, fans and computer operation. Similar loads are found in guest houses  where the operation is mostly during evening and night. Rooftop mounted solar  photovoltaic (SPV) systems can conveniently meet the electricity demand in both  scenarios [2]. Figure 2 shows the daily  harvestable electricity from every rooftop in the organisation (at η=10% and  80% of the roof area), which have been classified into 4 categories (high,  better, average, low). In this study, the analysis shows that the building with  higher spatial extent roof area generates higher electricity since 80% of the  area is considered for PV panel installation. However, area of installation is  directly proportional to the energy generation with same efficiency and  irradiation. 
  The  auditorium has the highest roof area which has the potential to generate about  750 kWh of electricity every day while lowest is found to 23 kWh/day. Nevertheless,  all buildings can be self-reliant of electricity by SPV installation in a  fraction of rooftop area [3].  
 
    
  Figure  3: Rooftop solar PV technology 
 
  Figure  3 illustrates the installation and grid connection of rooftop SPV system. The  electricity generated can be directly used in the building and the extra energy  can be exported to the grid. Most of the states and also Ministry of New and  Renewable Energy are encouraging solar PV installation through feed in tariff  and providing generation based incentives (GBI) [4].  The return on investment mill be higher with supplying unused electric energy to  electricity supply companies. Rid connected systems do not require energy  storage devices (batteries) which reduces the capital and maintenance cost. The  rooftop systems for guest houses may require batteries since lights, fans etc.  can be used after sunset.  
Typical solar rooftop  system for Parijata guest house: Table 1 shows  the typical rooftop solar PV system which can be installed in the guest house.  Capital cost and technical specification to the load of one room is computed  which can be deduced to any number of rooms and estimation holds good for other  guest house in the organisation.  
 
  Table 1:  Techno-economic specifications of Rooftop SPV system 


        Component | 
      Specification  | 
      Cost    (INR)  | 
     
    
      Electric Load per room  | 
      2 Fans + 2 CFL/LED Lamps 
        = (80*2) + (15*2) 
        = 160 + 30= 190 (200 W)  | 
         | 
     
    
      Hours of usage  | 
      6 hours (full load)  | 
         | 
     
    
      Total energy required  | 
      200*6= 1.2 kWh  | 
         | 
     
    
      Battery capacity  | 
      200 Ah 
        (Inverter efficiency = 90%, battery efficiency =    85% and depth of discharge = 70%)  | 
      ~ 20,000 
        (10,000 per 100 Ah, 2 batteries)  | 
     
    
      PV Panel  | 
      600 Wp  | 
      42,000 – 45,000 
        (3 panels of 200 Wp each)  | 
     
    
      Inverter  | 
      250 VA  | 
      5000-8000  | 
     
    
      Roof area required  | 
      1.5m2 for each panel. (4.5 m2    for 3 panels or per room)  | 
     
    
      Total cost  | 
      Approximately 75,000 excluding fitting, mounting    and labour costs.  | 


Solar Street light is one of the applications of SPV  system which helps to provide light to remote locations. Agastya organisation  has already installed few solar street lights (and few of them were  non-functional). Battery is an important component of the solar street light  system which needs regular maintenance and observation. It must be placed in a water  proof dry container and shielded from dust, moisture and insects. Distilled  water level in the battery should be checked once in 3-4 month and complete  charge drain (or over changing) be avoided to enhance the life of these  batteries. Panels shall be cleaned regularly since dust accumulation and bird  droppings are common. Regular maintenance and servicing will enhance the  lifespan with higher conversion efficiencies.  
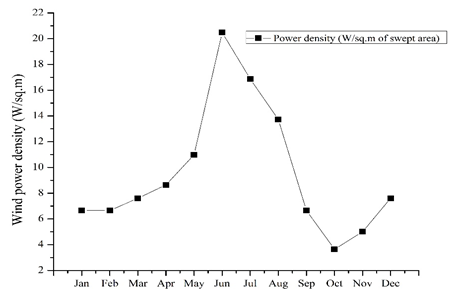
Wind energy scenario: Region  has a lower average wind speed which less than 2.5 m/s in most of the months.  During June and July region experiences higher wind speed of over 3 m/s. Figure  4 gives the monthly variation in wind power density in Agastya foundation  region. The wind power density ranges from 3.64 W/m2 (October) to  20.5 W/m2 (June) in the region. It shows that, low speed vertical  axes wind turbines are feasible for small capacity electricity generation,  which may be integrated with solar PV systems. 
 
    
  Figure  4: Variation in wind power density 
 
  Wind energy conversion  systems 
Wind  Energy Conversion System (WECS) uses wind to convert mechanical energy into  electrical energy. Main components of WECS are blades, gears, turbine, a  generator and a pillar to mount all the equipment at the required height. Wind  potential assessment is a prominent pre-installation procedure to assure  perfect selection of a site to harness maximum energy. 
  Power  generated by the wind turbine is directly proportional to the cube of the wind speed  and swept area. Maximum power obtained from any WECS is limited to 59.3% of the  total kinetic power available in wind which is given by Betz constant (Cp).  Power harnessed by WECS can be obtained using the expression given below [5]; 
  Pavail  = (1/2)*ρ*A*V3*Cp                                                                                (3) 
  where,  Pavail – wind power, ρ  – air mass density, A – swept area (area of wind flow), V – wind velocity and Cp  – Betz constant (maximum = 59.3%) assumed as 0.4 (40%). 
 
  Table 2: Available small-scale wind turbines [6] 


        Rated power, Prated (kW) | 
      Rotor swept    area (m2)   | 
      Sub-category   | 
     
    
      Prated <    1 kW  | 
      A < 4.9 m2  | 
      Pico wind  | 
     
    
      1 kW < Prated<    7 kW  | 
      A < 40 m2  | 
      Micro wind  | 
     
    
      7 kW < Prated<    50 kW  | 
      A < 200 m2  | 
      Mini wind  | 
     
    
      50 kW < Prated<    100 kW  | 
      A < 300 m2  | 
      (Not defined)  | 


Bioenergy  prospects  
  Agastya foundation is spread over 172 acres which  mainly has scrub/grass land with few trees. There are few patches with exotic  species - Acacia (Acacia auriculiformis)  and Nilgiri (Eucalyptus tereticornis)  in the region, and the biomass may be used for energy. Biomass gasifier can be  used to generate electricity which can meet the motive (water pumps) and  mechanical (workshop/construction) electricity demand. The organisation is  located in the arid region and suitable for energy plantations. Technically, energy  plantation refers to growing high biomass yielding species of trees and shrubs  which are harvestable in a comparably shorter time and are explicitly meant for  fuel. The biomass harvested from trees are mostly dry due to the weather which  can be further dried in sunlight for better combustion. The fuel wood may be  used either directly in wood burning stoves and boilers or processed into  methanol, ethanol and producer gas. The energy plantations provide inexhaustible  renewable sources (with recycle time of 3-8 years) of energy and provide  reliable electricity.  The key features  of energy plantations are given in Table 3. 
 
  Table 3: Features of Energy plantation  and comparison with coal 
  
    
       | 
      Wood  | 
      Coal  | 
     
    
      Energy density (GJ/dry    tonne)  | 
      19.8  | 
      29.3  | 
     
    
      Heat rate (kJ/kWh)  | 
      7200 - 18000  | 
      10900  | 
     
    
      % Carbon  | 
      25.3  | 
      24.1  | 
     
    
      Total Carbon (kg C/GJ)  | 
      26.62  | 
      24.65  | 
     
    
      1 dry tonne of wood    displaces 370 kg of coal Carbon  | 


Selection of multipurpose species provides a number  of by-products like oils, organic compounds, fruits, edible leaves, forage for livestock,  etc. [7]. Data collected from Forest Department  reveals that annual woody biomass available is in the range 11.9 to 21 t/ha/yr.  An energy forest raised at Hosalli village in Tumkur district to support a wood  gasifier plant has annual yield of 6 t/ha/yr. Singh and Tokay [8] have concluded that energy plantations of  different species shown net productivity of 15.7 to 32.62 ton/ha/yr. after 4  years of planting, which is shown in the Table 4. 
  Agastya  organisation shall promote energy plantation is few specific places which have  been delineated, shown in Figure 5. Plantation can be dine in a phased manner  which will help in irrigating the saplings, managing protecting the young  plants and also helps in regular biomass harvesting. About 3 ha of area near  the western boundary of the region is specified for which already has few  Acacia (Acacia auriculiformis) and  Nilgiri (Eucalyptus tereticornis)  trees. The adjacent forested area also has Eucalyptus plantation which will connect the landscape for movements of animals,  reptiles and insects.  
Table 4: Net productivity of Energy  plantation [8] 


        Species | 
      No. of trees/ha  | 
      Net productivity    (ton/h/yr) after 4 yrs.  | 
     
    
      Acacia Nilotica  | 
      2770  | 
      15.7  | 
     
    
      Eucalyptus Teriticornis  | 
      14933  | 
      29.19  | 
     
    
      LeucaenaLeucocephala  | 
      19689  | 
      32.62  | 


Trees  can be planted in the periphery of football playground selecting some fruit  bearing trees which also give shades and biomass. Grasslands are to be retained  un-disturbed which shelters vast insects and grass hoper which is linked to the  bird diversity. However, few fruit bearing trees and scrub flora can be planted  in these areas which help bird nesting and attract butterflies. The  organisation has many Acacia  auriculiformis and Eucalyptus tereticornis trees, which may be harvested in phased manner and planting of native species  suitable for bioenergy would help in addressing the energy requirement while  enhancing the local ecology.  
   
  
  Figure  5: Areas for energy plantation  
Electricity generation  from biomass gasification   
Fuel  wood can be converted into gas using thermo-chemical processes with only 2 - 4%  of ash. Gasification is carried out in oxygen starved environment to generate  carbon monoxide and hydrogen which are combustible. The reactions are carried  out in elevated temperature of 500-1,400 °C and pressure of 33 bar (480 psi).  Air based gasifiers normally produce gas with high nitrogen content, whose  calorific value varies between 4 and 6 MJ/Nm3 (100-1200 kilo calories/Nm3).  Oxygen and steam based gasifiers produce gas with relatively high calorific  value of 10 to 20 MJ/Nm3. Gas generated from biomass is also called  as Producer gas which is highly combustible [9].  
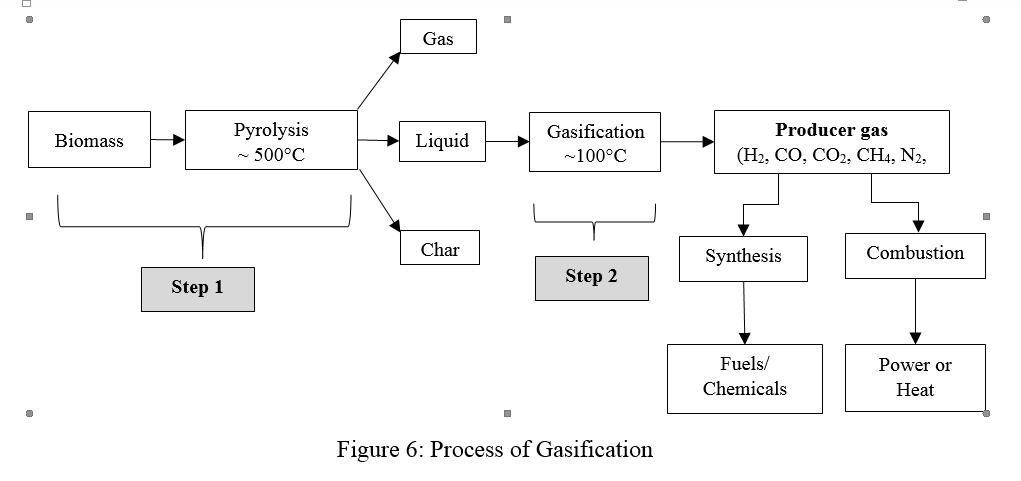
  Pyrolysis  is the primary step of converting biomass into gas in which it gets decomposed,  produces volatile materials (75-90%) in the form of gas and liquid, and char  which is non-volatile. Later, volatile hydrocarbons and char are converted to  combustible gas. Figure 6 shows the biomass gasification process and by-products  generated in the process. Many types of biomass gasifiers (Table 5) have been  developed depending upon the flow of fuel and oxidants and means of supporting  structures [10]. 
 
  Table 5: Types of  gasifiers 


        Gasifies type | 
      Flow direction  | 
      Type of    support  | 
     
    
      Fuel  | 
      Oxidant  | 
     
    
      Updraft fixed bed  | 
      Down  | 
      Up  | 
      Grate  | 
     
    
      Downdraft fixed bed  | 
      Down  | 
      Down  | 
      Grate  | 
     
    
      Bubbling fluidized bed  | 
      Up  | 
      Up  | 
      None  | 
     
    
      Circulating fluidized bed  | 
      Up  | 
      Up  | 
      None  | 


(Source: NREL) 


  The  combustible gas (producer gas) generated during gasification may either be used  for cooking or electricity generation. The combustible gas may be directly fed  to external combustion engines which are connected to alternators. Table 6  shows the cost comparison of different non-conventional power plants. 
  
  Table 6: Capital cost  comparison of different power plants


        Type of technology | 
      Capital cost (million    rupees/MW)  | 
     
    
      Solar photovoltaic  | 
      300-400  | 
     
    
      Micro-hydel  | 
      40-60  | 
     
    
      Wind  | 
      40-50  | 
     
    
      Biomass  | 
      20-40  | 


(Source: Biomass gasifier-based power generation  system back to basics, with a difference, The Energy and Resource Institute. (http://www.teriin.org/index.php?option=com_content&task=view&id=59)) 
The  capacity of the biomass based electricity generation ranges from few kilowatts  few hundreds of kilowatt. Fuel requirement for gasifier is about 1.2 kg to  generate 1 kWh of electricity which runs for 4 to 5 hours/day. These types of  systems are best suited for distributed generation, have the capacity to meet  the demand of domestic electricity consumption. Remote area electrification is  possible where the conventional grid supply is not feasible [11]. Producer gas can be used with conventional fuels  such as diesel or natural gas which allows 60-80% savings in fossil fuel  consumption. MNRE (Ministry of New Renewable Energy, http://www.mnre.gov.in) is  encouraging gasifier projects for both in community level and for individual  household. Central Financial Assistance (CFA) is being provided for various  components of gasifier plants from 15,000 per kW to 5 lakhs (one time)  depending upon the application and benefitting population. Also the ministry  organizes technical courses for technicians in order to understand the  technology and for effective implementation [12]. 
   
Biogas generation 
  The  organization has few cattle which produce sufficient dung to produce biogas.  Hundreds of students come to the organization every day, who produce  significant amount of food waste which can be used along with animal residue to  produce biogas. The wet organic residues offer very high potential of biogas  production which can meet the cooking fuel demand in guest house or of employee  colony. The slurry generated in the biogas production is good manure which can  be used to prepare compost or directly fed to agricultural or horticultural  plantations. Biogas mainly comprises of methane (60-65%) and carbon dioxide  (35-40%) having a small fraction Hydrogen sulphide and water vapour. Biogas  generation from dung, organic waste or agricultural and horticultural residues  is dependent on temperature, carbon-nitrogen ratio (C:N), pH and retention  period. Temperature is the most prominent factor that affects the biogas  generation; The optimum conditions for biogas generation are: temperature  30-35°C, pH 6.8-7.5, carbon : nitrogen ratio (C:N) 20-30, solid contents 7-9%,  retention time 20-40 days. The retention period decides the rate of digestion,  longer the retention time more the gas generated for a given amount of waste.  There are many technologies available for biogas generation depending upon the  availability of resources. The most widely used technologies are: 
  
    - Fixed       Dome model (40 and 55 days retention period)
 
    
      - Deenabandhu        brick masonry
 
      - DeenabandhuFerro-cement        in-situ construction
 
     
    - Floating       Dome model (30,40 and 55 days retention period)
 
    
      - KVIC        (Kadhi and Village Industries Commission) floating metal drum
 
      - KVIC        reinforced cement concrete (RCC) digester
 
     
    - Prefabricated       Model for limited field trial (40 days retention period)
 
    
      - Sintex        - HDPE pre-fabricated Deenbandhu
 
     
    - Optimized       design developed by Application of Science and Technology to Rural Areas       (ASTRA) of IISc [13, http://astra.iisc.ac.in].
 
    - Fixed       dome type designed by University of Agricultural Sciences - Bhagyalaxmi       design.


Arrangements  may be made to collect food waste. Waste collection and transportation to the  biogas plant will be easier and effective. Significant amount of biogas can be  generated from above mentioned technologies which can be used for coking or  electricity generation. 


  Reference 
  
    - Ramachandra T.V.,  Rishabh Jain and Gautham Krishnadas, 2011. Hotspots of solar potential in  India. Renewable and Sustainable Energy Reviews, 15: 3178–3186.
 
    - Ramachandra T.V. and  Ganesh Hegde, 2014. Scope for Distributed Renewable Energy Systems in South  India. 2014 IEEE Global Humanitarian Technology Conference - South Asia  Satellite (GHTC-SAS), 26-27 September 2014.
 
    - Ramachandra T.V.,  Ganesh Hegde and Gautam Krishnadas, 2014. Scope for Solar Energy in Uttara  Kannada, Karnataka State, India: Roof Top PV for domestic electricity and  standalone systems for irrigation. Productivity,  55 (1): 101-119.
 
    - Solar policies –Salient  Features, Ministry of New and Renewable Energy, Government of India  (http://mnre.gov.in/).
 
    - Ramachandra T.V.,  Ganesh Hegde and Gautham Krishnadas, 2014. Potential Assessment and  Decentralized Applications of Wind Energy in Uttara Kannada, Karnataka, International  Journal of Renewable Energy Research, 4 (1): 1-10.
 
    - Cabello M. and J.A.G.  Orza, 2010. Wind speed analysis in the province of Alicante, Spain: Potential  for small-scale wind turbines. Renewable  and Sustainable Energy Reviews, 14: 3185-3191.
 
    - Ramachandra T.V.,  Ganesh Hegde, Bharath Setturu and Gautham Krishnadas, 2014. Bioenergy: A  sustainable Energy Option for Rural India. Advances  in Forestry Letters (AFL), 3 (1): 1-15.
 
    - Singh V. and O.I. Toky,  1995. Biomass and net primary productivity in Leucaena, Acacia and Eucalyptus,  short rotation, high density (‘energy’) plantations in arid India. Journal of Arid Environments, 31:  301-309.
 
    - Patra S.K. and P.P.  Datta, 2006. Insights into Biomass Gasification Technology. Technical Digest, 6: 14-19.
 
    - Ciferno Jared P. and  Marano John J., 2002. Benchmarking Biomass Gasification Technologies for Fuels,  Chemicals and Hydrogen Production, National Energy Technology Laboratory, U.S.  Department of Energy, 2002
 
    - Ravindranath N.H. and  Ramachandra T.V., 1996. Renewable energy options for decentralized electricity  generation. Ecology, 11(2): 23-32.
 
    - Ministry of New and  Renewable Energy, Govt. of India. Viewed on 25th February 2013. (http://www.mnre.gov.in/file-manager/offgrid-biomass-gas-schemes/biomassgasifier-2010-11.pdf)
 
    - Subramanian D.K., 1984.  Energy utilization in Karnataka. In: Saldanha C. J., editor. Karnataka state of  environment report, 1984.


 |