|
|
Large scale land-use land-cover (LULC) dynamics leading to deforestation is one of the drivers of global climate changes and alteration of biogeochemical cycles. This has given momentum to investigate the causes and consequences of LULC by mapping and modelling landscape patterns and dynamics and evaluating these in the context of human-environment interactions in the rapidly transforming landscapes. Human induced environmental changes and consequences are not uniformly distributed over the earth. However their impacts threaten the sustenance of human-environmental relationships. Land cover refers to physical cover and biophysical state of the earth’s surface and immediate subsurface and is confined to describe vegetation and manmade features. Thus land cover reflects the visible evidence of land cover of vegetation and non-vegetation. Land use refers to use of the land surface through modifications by humans and natural phenomena. Land use is characterized by the arrangements, activities and inputs people undertake in a certain land cover type to produce, change or maintain it. Alteration the structure of the landscape through large scale LULC has influenced the functioning of landscape, which include nutrient, regional water and bio-geo chemical cycles (Ramachandra et al., 2013).
Temporal remote sensing data offers aided an important means of in detecting and analysing changes occurring in the landscape. Remote sensing methods have been widely applied in mapping land surface features (Ramachandra et al., 2015). Spatial data acquired through satellite borne remote sensors offers a tremendous advantage over historical maps or air photos, as it provides consistent observations over a large geographical area, revealing explicit patterns of land cover and land use. It presents a synoptic and repetitive view of the landscape at low cost (Bharath, H.A., 2012, Ramachandra et al., 2012, 2014). Recent advancements in remote sensing technologies offer multi-resolution (spatial, spectral and temporal) datasets that are used to assess spatial structure and pattern of changes in the landscape. Spatial patterns of changes in the landscape is understood by analysis of land use changes. Human induced land use and land cover (LULC) changes have been the major driver of the landscape dynamics at local levels. Land use assessment was carried using the maximum likelihood classification technique. This method has already been proved as a superior method as it uses various classification decisions using probability and cost functions (Duda et al., 2000; Ramachandra et al., 2012, 2014). Analysis revealed an increase in vegetation cover in the study region.
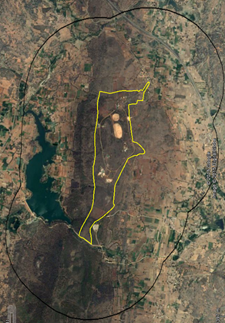
Study area: Study area considered for analysis was Agastya foundation campus at Kuppam. The campus is located 12o48’30” to 12o49’41” N latitude and 78o14’56” 78o15’29”E longitude. The study region consisted of campus and 3.5km buffer from the campus boundary. This was considered to understand the regional landscape change influence. Study area is as shown in the Figure 1.
Data: Land use dynamics was analysed using temporal remote sensing data of the period 2000 to 2014. The time series spatial data of year 2000, 2006 and 2010 were acquired from Landsat Series Thematic mapper (28.5m) sensors. IRS P6 LISS4MX data for the year 2014 of resolution 5m was procured from the National Remote Sensing Centre (http://nrsc.gov.in), Hyderabad. Survey of India (SOI) topographic maps of 1:50000 and 1:250000 scale were used to generate base layers (boundary, etc.) etc. Ground control points to register and geo-correct spatial data were collected using handheld pre-calibrated GPS (Global Positioning System), Survey of India Topographic maps (http://www.surveyofindia.gov.in) and online remote sensing data portals [Google earth, http://earth.google.com, BHUVAN http://bhuvan.nrsc.gov.in).
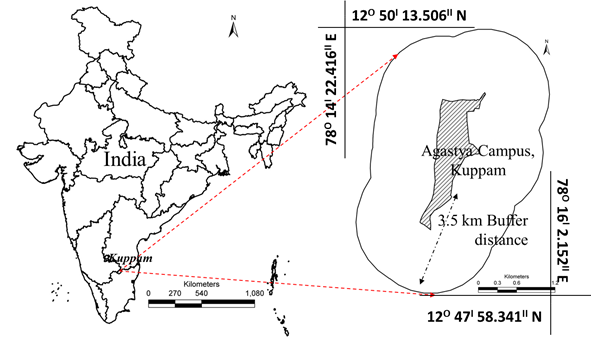
Figure 1: Study area Agastya foundation campus at Kuppam (with 3.5 km buffer)
Method: Assessment of land use dynamics involved:
-
Procuring spatial data and compilation of collateral data (discussed in the earlier section)
-
Data pre-processing: The remote sensing data obtained were geo-referenced, rectified and cropped pertaining to the study area. Geo-registration of remote sensing data (Landsat data) has been done using ground control points collected from the field using pre calibrated GPS (Global Positioning System) and also from known points (such as road intersections, etc.) collected from geo-referenced topographic maps published by the Survey of India and from online BHUVAN portal (http://bhuvan.nrsc.gov.in).
-
Preparation of False Colour Composite: False colour composite (Figure 2) is the representation of earth features in their non-original colours, which facilitated identification of heterogeneous landscape elements (for geo-rectification and also training data collection). FCC is prepared by combination of spectral bands NIR, GREEN and RED bands.
-
Preparation of training data set: training datasets (training polygons) required to classify the remote sensing data into various land use classes were compiled for various land use categories based on the site knowledge [Field data, Topographic maps (the Survey of India), Google earth (http://www.googleearth.com), Bhuvan (http://bhuvan.nrsc.gov.in), and also considering spectral properties of landscape elements (from FCC). Training data is collected so as to cover at least 25% of the total area and spread uniformly across the study area.
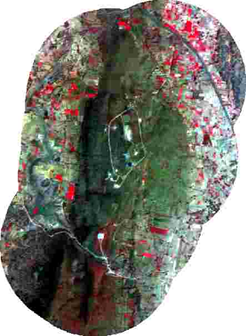
Figure 2: False colour composite of the campus with 3.5 km buffer
-
Land use analysis using temporal satellite image: Land use analyses were carried out using supervised pattern classifier - Gaussian maximum likelihood classifier (GMLC) for Landsat and IRS data. The method involved (Ramachandra et al., 2012): i) generation of False Colour Composite (FCC) of remote sensing data (bands – green, red and NIR). This helped in locating heterogeneous patches in the landscape ii) selection of training polygons (these correspond to heterogeneous patches in FCC) covering 25% of the study area and uniformly distributed over the entire study area, iii) loading these training polygons co-ordinates into pre-calibrated GPS, vi) collection of the corresponding attribute data (land use types) for these polygons from the field. GPS helped in locating respective training polygons in the field, iv) supplementing this information with Google Earth (latest as well as archived data), v) 60% of the training data has been used for classification, while the balance is used for validation or accuracy assessment. Land use was computed using the temporal data through open source program GRASS - Geographic Resource Analysis Support System (http://ces.iisc.ac.in/grass). Land use categories include i) water bodies (lakes/tanks, rivers, streams, ii) built up (buildings, roads or any paved surface, iii) open spaces iv) vegetation cover (tree cover). Supervised pattern classifier based on Gaussian maximum likelihood algorithm computes the mean and variance of digital numbers under each training data set, based on which unknown pixel is categorized under a land use class. Recent remote sensing data (2014) was classified using the training data collected from field using pre-calibrated GPS and online data portal. Classification of earlier time data, training polygon along with attribute details were compiled from the historical published topographic maps, vegetation maps, revenue maps, etc. Of the overall signatures, 65% of the total signatures are considered in classification of the image and 35% of the pure signatures are used for assessing the accuracy.
-
Accuracy assessment: Accuracy assessment was done to check the integrity of classified data with reference to the reference data (either field data or collateral data). Statistical assessment of classifier performance based on the performance of spectral classification considering reference pixels is done which include computation of kappa (κ) statistics and overall (producer's and user's) accuracies. Kappa is estimated as a measure of agreement between the reference map and the classified map.
Results
Land use analysis: Temporal land use analyses considering remote sensing data of the period 2001 to 2014 were done as discussed in the methods section and results are presented in figure 3 and table 1. Figure 4 depicts the land cover in the region (based on temporal Google images). Land use analyses reveals of an increase in vegetation cover in the study region during 2001 to 2014. The data considered here are of January month (except 2006, April month). The increase in vegetation cover from 11.19 (2001) to 18.76 (2014)% is noticed mainly in the campus and immediate vicinity. Other category includes open area, open lands, cultivation fields, etc. The urban growth is specific to villages and some pockets in the campus. Shrinkage in water spread area highlights the need for watershed based interventions (ecological and engineering) to harvest rainwater and sustain water resources in the region.
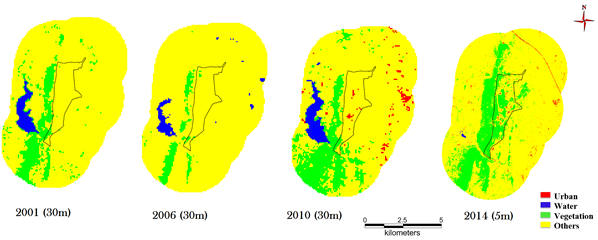
Figure 3: Land use dynamics in the study region - Agastya campus, Kuppam with 3.5 km buffer
|
2001 |
2006 (April) |
2010 |
2014 |
Urban |
0.02 |
0.02 |
1.75 |
0.81 |
Water |
2.9 |
2.1 |
3.99 |
0.09 |
Vegetation |
11.19 |
4.13 |
16.67 |
18.76 |
others |
85.89 |
93.75 |
77.58 |
80.33 |
Table 3: Category-wise land uses (%) in the study region - Agastya campus, Kuppam with 3.5 km buffer
2009 (May) 2011 (December)
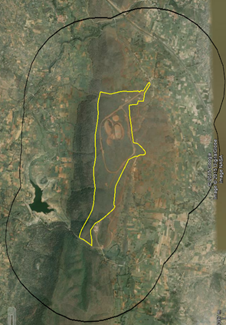 
2012 (April) 2013 (February)
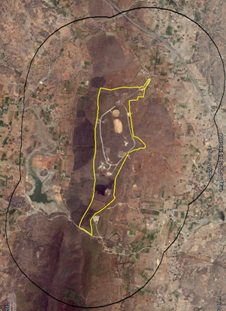 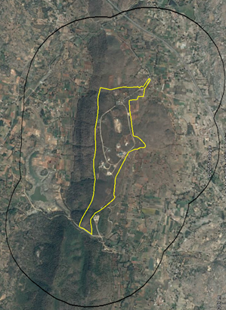
Figure 4: Google earth data reflecting land use dynamics in the study region.
Overall accuracy of the land use classification ranged from 86.4% (2000), 80.3% (2006), 96.2% (2010) and 93.34% (2014) with kappa of 0.82 (in 2000), 0.71 (2006), 0.92 (2010) and 0.91(2014) indicating that the classified information was comparable to the reference data (compiled from field study for validation).
References
- Ramachandra T V and Subash Chandran M D, 2012, Ecology and Environment, (Developed under HRD Project on Pedogogy, Co-ordinated by IITK)
- Ramachandra T.V., 2008. Environment Education for Ecosystem Conservation, Capital Publishing Company, New Delhi.
- Ramachandra T.V., Subash Chandran M D., Gururaja K V and Sreekantha, 2007. Cumulative Environmental Impact Assessment, Nova Science Publishers, New York.
- Ramachandra T.V., 2006. Management of Municipal Solid Waste, Commonwealth Of Learning, Canada and Indian Institute of Science, Bangalore, Printed by Capital Publishing Company, New Delhi [Reprinted in 2009 by TERI Press, New Delhi].
- Ramachandra T.V., 2006.Soil and Groundwater Pollution from Agricultural Activities, Commonwealth Of Learning, Canada and Indian Institute of Science, Bangalore, Printed by Capital Publishing Company, New Delhi [Reprinted in 2009 by TERI Press, New Delhi].
- Vijay Kulkarni and Ramachandra T.V., 2006. Environmental Management, Commonwealth Of Learning, Canada and Indian Institute of Science, Bangalore, Printed by Capital Publishing Company, New Delhi [Reprinted in 2009 by TERI Press, New Delhi].
- Ramachandra T.V., Ahalya N. and Rajasekara Murthy, 2005. Aquatic Ecosystems: Conservation, Restoration and Management, Capital Publishing Company, New Delhi
- Ramachandra T.V. and Ahalya N., 2004. Wetland ecosystem in India: Conservation and Management, Monograph- DEF Environmental Research Update, Journal of Environmental Biology
- Ramachandra T.V. and Bharath H. Aithal, 2015. Wetlands: Kidneys of Bangalore’s Landscape, National wetlands, 37:12-16
- Ramachandra T V and Ganesh Hegde, 2015. Decentralised renewable energy options for Western Ghats, MGIRED Journal, 1(1):24-43, Mahatma Gandhi Institute for Rural Energy and Development
- Ramachandra T.V., 2014. Hydrological Responses at Regional Scale to Landscape Dynamics, J Biodiversity, 5(1,2): 11-32
- Ramachandra, T.V.; Bharath H. Aithal and Durgappa D. S. 2012. Insights to urban dynamics through landscape spatial pattern analysis, Int. J Applied Earth Observation and Geoinformation, 18; 329-343, http://dx.doi.org/10.1016/j.jag.2012.03.005.
- Ramachandra T V, Bharath H Aithal, Beas Barik, 2014. Urbanisation Pattern of Incipient Mega Region in India, TEMA - Journal of Land Use, Mobility and Environment, 7(1): 83-100, DOI: 10.6092/1970-9870/2202
|