|
|
Unabated construction activities in ecologically fragile valley zone of the interconnected lake systems highlight prevailing negligent, incompetent and corrupt executive mechanism, which is evident with the
- Violations in valley zone (restricted land uses as per the CDP 2015).
- Violations in 30m buffer (regulated activities as per BDA norms -lakes, natural drains, flood plains).
- Construction of high rise buildings and letting untreated sewage t lakes (highlights weak regulatory mechanism in the region).
- Water contamination (water act 1974, 1977)
- Unauthorized occupation of lake bed
- Article 21, constitution of India – right to clean drinking water and clean environment.
- Grant of environmental clearance (?) by the state level committee further confirms incompetency and lacuna in the decision making process.
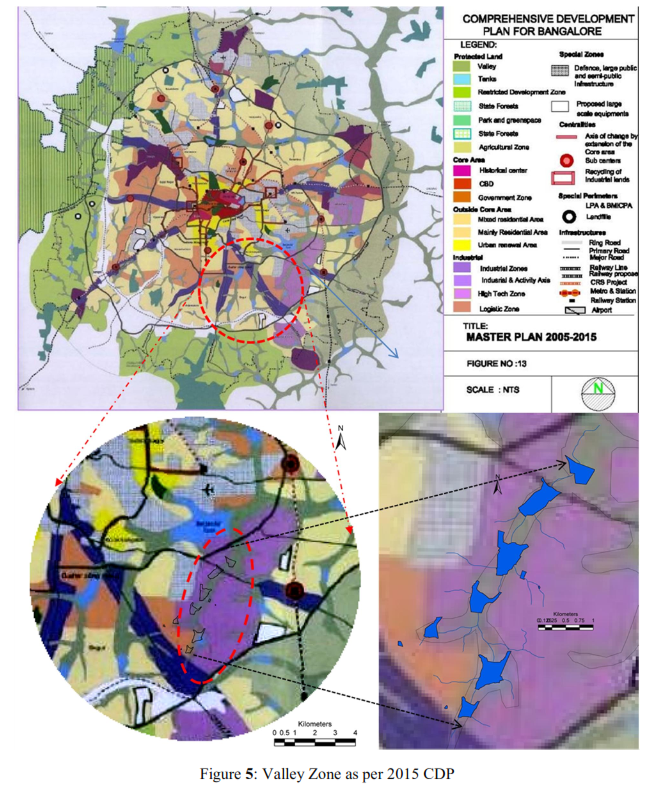
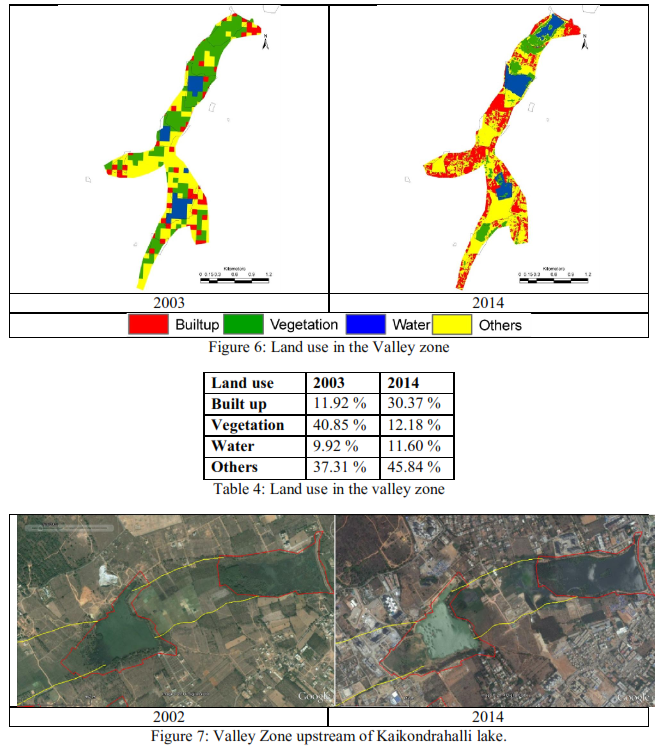
Encroachment of Valley Zone: The valley zone along with the lakes in par with the City Development Plan is as depicted in figure 5, the land use along the valley zone is as in figure 6 and table 4, it can be clearly observed that the laws made by the policy makes have been outrun by the developers by encroaching the valley zone (as shown in figure 7).
Violation of BDA, BBMP and MoEF norms of protecting wetlands and regulated activities in the buffer zone.
The BDA norms specify that the distance between the wetlands (lakes, natural drainages) and any developmental activity should be atleast 30m, whereas the MoEF specifies the distance as 200 m. Figure 8, figure 9 and table 5 depicts the land use in the buffer regions.

Buffer |
30 m |
100 m |
200 m |
Land use |
2003 |
2014 |
2003 |
2014 |
2003 |
2014 |
Built up |
12.89 |
23.55 |
16.12 |
38.40 |
19.16 |
45.31 |
Vegetation |
41.40 |
10.99 |
37.36 |
8.42 |
33.09 |
6.69 |
Water |
11.75 |
11.91 |
5.70 |
6.27 |
3.56 |
3.83 |
Others |
33.95 |
53.55 |
40.83 |
46.91 |
44.19 |
44.17 |
Table 5: Land use in buffer zone (as percentage)
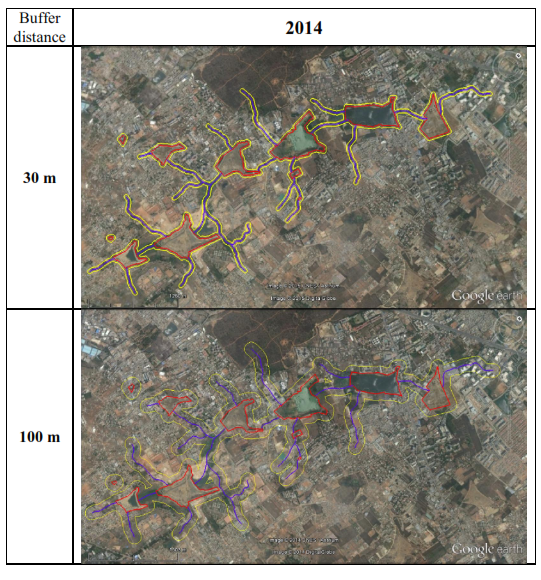
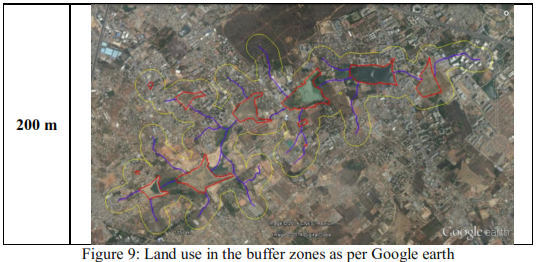
Figure 9: Land use in the buffer zones as per Google earth
Hydrology: The Catchment of Kaikondrahalli, Bangalore on an average receives rainfall of 760mm, figure10 and 11 describe the rainfall in the catchment. With average rainfall of 760mm, the runoff in the catchment based on the various land use, the runoff in the catchment is about 5.5 Million cubic meters.

|
T.V. Ramachandra
Centre for Sustainable Technologies, Centre for infrastructure, Sustainable Transportation and Urban Planning (CiSTUP), Energy & Wetlands Research Group, Centre for Ecological Sciences, Indian Institute of Science, Bangalore – 560 012, INDIA.
E-mail : cestvr@ces.iisc.ac.in
Tel: 91-080-22933099/23600985,
Fax: 91-080-23601428/23600085
Web: http://ces.iisc.ac.in/energy
Bharath H AithalEnergy & Wetlands Research Group, Centre for Ecological Sciences, Indian Institute of Science, Bangalore – 560 012, INDIA.
E-mail: bharath@ces.iisc.ac.in
Vinay SEnergy & Wetlands Research Group, Centre for Ecological Sciences, Indian Institute of Science, Bangalore – 560 012, INDIA.
E-mail: vinay@ces.iisc.ac.in
Bharath Setturu
Energy & Wetlands Research Group, Centre for Ecological Sciences, Indian Institute of Science, Bangalore – 560 012, INDIA.
E-mail: settur@ces.iisc.ac.in
Asulabha K S
Energy & Wetlands Research Group, Centre for Ecological Sciences, Indian Institute of Science, Bangalore – 560 012, INDIA.
E-mail: asulabha@ces.iisc.ac.in
Sincy V.
Energy & Wetlands Research Group, Centre for Ecological Sciences, Indian Institute of Science, Bangalore – 560 012, INDIA.
E-mail: sincy@ces.iisc.ac.in
Sudarshan P.Bhat
Energy & Wetlands Research Group, Indian Institute of Science, Bangalore – 560 012, INDIA.
E-mail: sudarshan@ces.iisc.ac.in
Citation: Ramachandra T V, Bharath H.Aithal, Vinay S, Bharath Setturu, Asulabha K S, Sincy V and Sudarshan P. Bhat, 2015. Vanishing Lakes Interconnectivity & Violations in Valley Zone: Lack of Co-ordination among Para-State Agencies, ENVIS Technical Report 85, CES, Indian Institute of Science, Bangalore 560012
| Contact Address : |
| |
Dr. T.V. Ramachandra
Energy & Wetlands Research Group,
Centre for Ecological Sciences,
New Biological Sciences Building, 3rd Floor, E-Wing, Lab: TE15
Indian Institute of Science, Bangalore – 560 012, INDIA.
Tel : 91-80-22933099 / 22933503(Ext:107) / 23600985
Fax : 91-80-23601428 / 23600085 / 23600683 [CES-TVR]
E-mail : cestvr@ces.iisc.ac.in, energy@ces.iisc.ac.in,
Web : http://wgbis.ces.iisc.ac.in/energy |
|