|
|
PHYTOPLANKTON and ZOOPLANKTON ANALYSIS
Plankton collection and Identification: The plankton samples were collected by filtering 50 litres of lake water through the standard plankton net (No. 25 bolting silk cloth net of mesh size 63 mm and 30 cm diameter). The final volume of the filtered sample was made to 20 ml and then transferred to another 125 ml plastic bottle and labeled, mentioning the time, date and place of sampling. The samples collected were preserved by adding 2ml of 5% formalin. The phytoplanktons and zooplanktons were identified microscopically according to the standard keys.
Physico-chemical parameters:
Temperature: The variation in temperature effects various physical, chemical and biological reactions in the aquatic organisms. An increase in the temperature speeds up the chemical reactions, increases the rate of metabolic activities, reduces the solubility of gases like dissolved oxygen and carbon dioxide in the water. Aquatic organisms have varying tolerance to temperature.
Total Dissolved Solids (TDS) and Electrical Conductivity (EC): Total Dissolved solids are solids that are in the dissolved state in water. TDS constitutes inorganic salts, as well as a small amount of organic matter. Electrical Conductivity is the ability of water to conduct an electric current. It depends on the total concentration, mobility, valence and the temperature of the solution of ions. Most dissolved inorganic substances in the ionised form in water also contribute to conductivity. Higher TDS and EC indicate pollution. The chloride, carbonates, bicarbonates, phosphates, nitrates, sodium, potassium, iron, manganese, sulphates, etc. also contribute towards EC and TDS in lakes.
pH: pH is the measure of acidity or alkalinity of water. pH scale ranges from 0 to 14 (i.e., very acidic to very alkaline) with pH 7 being neutral. A higher pH affects mucous membranes, causes bitter taste, corrosion, and affects aquatic life. In lakes, the diurnal and seasonal variations in pH are governed by the rate of photosynthesis, respiration as well as the equilibrium between carbon dioxide/bicarbonate/carbonate ions. pH of a lake can be affected by inflow of domestic sewage, industrial effluents and atmospheric deposition of acid-forming substances.
Turbidity: Turbidity in water is caused due to the presence of clay, silt, organic and inorganic matter, plankton and other microscopic organisms. It restricts light penetration and thus, reduces photosynthesis in water bodies. It also makes water unfit for domestic purposes as well as other industrial uses.
Dissolved Oxygen:Dissolved oxygen (DO) is the most essential factor in aquatic system as it reflects the various biological activities and changes occurring in lakes, brought about by the aerobic and anaerobic organisms present. The presence of high amount of organic matter, hydrogen sulphide, ferrous ions, ammonia, nitrates and other oxidisable substances in lakes imposes a very high oxygen demand, which may in turn, lead to oxygen depletion thus, affecting other aquatic life. DO more than 5 mg/l favors good aquatic life.
Biochemical oxygen demand (BOD): BOD is the amount of oxygen utilized by microorganisms in stabilizing or oxidation of the organic matter in water bodies. Naturally, BOD is contributed by plankton or plant decay and leaf fall. Other sources of oxygen-consuming waste include domestic wastes and stormwater runoff from farmland or urban areas. BOD test is conducted for 5 days at 20ºC.
Chemical oxygen demand (COD): Chemical oxygen demand (COD) determines the oxygen required for chemical oxidation of most organic matter and oxidizable inorganic substances with the help of strong chemical oxidant. COD is also determined by the presence of various organic and inorganic materials like calcium, magnesium, potassium, sodium etc.
Alkalinity: Alkalinity is a measure of the buffering capacity of water governed by the equilibrium between carbonic acid, bicarbonates and carbonates in water. Also, he presence of excess of hydroxyl ions, borates, silicates, phosphate etc. causes alkalinity.
Chlorides:It is an indicator of water pollution. The presence of chloride in water can be attributed to the dissolution of salt deposits, discharge of effluents from industries, sewage discharges, irrigation etc. The excreta contains high quantities of chlorides and other nitrogenous compounds.
Total hardness, Calcium hardness and Magnesium hardness: Hardness of water is mainly due to the presence of calcium, magnesium, carbonates, bicarbonates, sulphates, chloride, nitrates etc. Higher values of hardness in lakes are attributed to the regular addition of sewage and detergents. Hard water is unfit for domestic and industrial purposes. Calcium is an important micronutrient in aquatic environment and is especially required in large quantities by molluscs and vertebrates. Magnesium acts as a co-factor in various enzymatic reactions and constitutes the chlorophyll molecule, which is essential for photosynthesis. Sewage and industrial wastes are major contributors of calcium and magnesium in lake water.
Nitrates and Phosphates: Nitrate is the oxidized form of nitrogen and end- product of aerobic decomposition of organic nitrogenous matter. The major sources of nitrate are precipitation, surface run off, sewage, organic matter, leaf litter etc. Phosphates are essential for the growth of phytoplankton (used up as orthophosphates) and acts as a limiting nutrient that limits primary productivity of aquatic ecosystems. The major sources of phosphorus are domestic sewage, detergents, agricultural runoff and industrial wastewater.
Sodium and Potassium:Sodium is highly soluble in water and makes water saltly and unfit for use. Sodium is present is in water treatment chemicals, in domestic water softeners, and in sewage effluents. Potassium is found in lesser concentrations naturally than calcium, magnesium and sodium ions. The natural source of potassium is weathering of rocks, but it also increases due to sewage entry to lakes.
Phytoplankton and Zooplankton: Algae are an important component of biological monitoring programs or water quality assessment because of their rapid reproduction rates and very short life cycles, making them valuable indicators of short-term impacts. They are the primary producers in lakes and thus, are directly affected by physical and chemical factors. Algal assemblages are sensitive to some pollutants and to the variation of environmental and natural disturbances. Zooplanktons are an essential part of aquatic ecosystems and act as indicators of pollution. They serve as a food resource for higher trophic levels and feeds on the algal community.
Physico- chemical characteristics of Kaikondrahalli Lake: The water quality analysis of Kaikondrahalli Lake, collected from 3 different sites like inlet, middle and outlet was performed (Table 1). It was found that the inlet sewage water entering the lake has comparatively higher amount of TDS, EC, Turbidity, BOD, COD, alkalinity, hardness, nutrients, sodium and potassium than the lake water (middle and outlet). The algal growth achieved through nutrient uptake and increased photosynthetic activities has increased the oxygen levels in the lake and there is an evident reduction in the nutrient levels. All the physico-chemical parameters of the lake water are within the permissible limits.
Table 2: Water quality of Kaikondrahalli Lake
Parameters |
Kaikondrahalli Inlet |
Kaikondrahalli Middle |
Kaikondrahalli Outlet |
Water quality Standard IS 10500, 1991-2011 |
Desirable |
Permissible |
Water Temperature (0C) |
24.8 |
24.6 |
23.6 |
- |
- |
TDS (mg/l) |
1008 |
671 |
668 |
500 |
2000 |
EC (µS) |
1340 |
1029 |
978 |
- |
- |
pH |
7.69 |
7.92 |
7.86 |
6.5-8.5 |
No relaxation |
Turbidity |
27.67 |
15.5 |
17 |
- |
- |
DO (mg/l) |
2.11 |
5.04 |
4.88 |
- |
- |
BOD (mg/l) |
24.39 |
16.26 |
8.13 |
- |
- |
COD (mg/l) |
152 |
20 |
24 |
- |
- |
Alkalinity (mg/l) |
737.33 |
257.33 |
273.33 |
200 |
600 |
Chloride (mg/l) |
313.35 |
319.03 |
313.35 |
250 |
1000 |
Total Hardness (mg/l) |
436 |
200.67 |
189.33 |
300 |
600 |
Ca Hardness (mg/l) |
151.5 |
38.74 |
39.55 |
75 |
200 |
Mg Hardness (mg/l) |
69.13 |
39.35 |
36.4 |
30 |
100 |
Phosphate (mg/l) |
1.52 |
0.052 |
0.045 |
- |
- |
Nitrate (mg/l) |
0.267 |
0.229 |
0.224 |
45 |
100 |
Sodium (mg/l) |
274.4 |
264.8 |
260 |
- |
- |
Potassium (mg/l) |
63.6 |
51.6 |
52.4 |
- |
- |
Table 3: Algal groups present in Kaikondrahalli Lake
|
|
Middle |
Outlet |
Near Inlet |
i |
Chlorophyceae |
|
|
|
1 |
Chlorella sp. |
+ |
- |
- |
2 |
Closterium sp. |
+ |
- |
+ |
3 |
Cosmarium sp. |
- |
+ |
- |
4 |
Desmodesmus spp. |
+ |
+ |
- |
5 |
Dictyosphaerium sp. |
+ |
+ |
- |
6 |
Kirchenerilla sp. |
+ |
+ |
+ |
7 |
Monoraphidium sp. |
+ |
+ |
+ |
8 |
Oocystis sp. |
+ |
+ |
- |
9 |
Pediastrum spp. |
+ |
+ |
- |
10 |
Scenedesmus spp. |
+ |
+ |
- |
11 |
Spirogyra sp. |
+ |
- |
- |
12 |
Tetraedron sp. |
+ |
+ |
- |
13 |
Xanthidium sp. |
- |
+ |
- |
ii |
Cyanophyceae |
|
|
|
1 |
Aphanotheca sp. |
+ |
- |
- |
2 |
Aphanocapsa sp. |
+ |
+ |
- |
3 |
Chroococcus sp. |
+ |
- |
- |
4 |
Gleocapsa sp. |
+ |
- |
- |
5 |
Merismopedia sp. |
+ |
+ |
+ |
6 |
Oscillatoria sp. |
+ |
- |
+ |
7 |
Phormidium sp. |
- |
- |
+ |
8 |
Radiocystis sp. |
+ |
+ |
- |
iii |
Bacillariophyceae |
|
|
|
1 |
Amphora sp. |
- |
+ |
- |
2 |
Cyclotella sp. |
+ |
+ |
- |
3 |
Cymbella sp. |
+ |
|
|
4 |
Fragilaria sp. |
+ |
- |
- |
5 |
Gomphonema sp. |
+ |
- |
+ |
6 |
Navicula spp. |
+ |
- |
+ |
7 |
Nitzschia spp. |
+ |
+ |
+ |
8 |
Pinnularia sp. |
- |
- |
+ |
9 |
Stauroneis sp. |
+ |
- |
+ |
10 |
Synedra sp. |
+ |
+ |
- |
iv |
Euglenophyceae |
|
|
|
1 |
Euglena spp. |
- |
- |
+ |
2 |
Lepocincilis spp. |
- |
- |
+ |
3 |
Phacus sp. |
+ |
- |
+ |
In Kaikondrahalli Lake, mainly 4 algal groups were found in the order of their occurrence: Chlorophyceae (13 genera)>Bacillariophyceae (10 genera) > Cyanophyceae (8 genera) > Euglenophyceae (3 genera). The middle sampling point had higher algal groups than inlet and outlet. In Kaikondrahalli Lake, pollution-tolerant genera are present (Table 3) which includes: Scenedesmus sp. and Pediastrum sp. (Kumar et al., 2012), Euglena sp. (Mahapatra et al., 2013; Jafari et al., 2006), Lepocinclis sp. (Mahapatra et al., 2013), Nitzschia sp. (Karthick et al., 2009; Venkatachalapathy et al., 2013), Oscillatoria sp. (Singh et al., 2011; Kumar et al., 2012), and Phacus sp., Cyclotella sp., Fragilaria sp. (Venkatachalapathy et al., 2013), Gomphonema sp. (Karthick et al., 2009), Navicula sp. (Hosmani, 2012), Pinnularia sp. (Hosmani, 2012). The sampling point near inlet to the Lake had higher number of Euglenophyceae members, which indicates sewage pollution. The Chlorophycean growth were favoured by high dissolved contents.The sewage contamination characterized by the low transparency, low dissolved oxygen, higher amounts of carbonates, alkalinity, chlorides, total hardness, calcium and magnesium hardness favoured Euglenophyceae growth in Lakes (Verma et al., 2011).
In Kaikondrahalli Lake, 5 groups of zooplanktons were found: Rotifera, Copepoda, Ostracoda, Cladocera and Protozoa. Brachionus sp., Chydorus sp. and Cypris sp. was found to be more in number. Only in the sampling point near inlet, protozoans were very high which indicates high organic pollution (An et al., 2012). The pollution load in lakes increases the Ostracod population (Padmanabha et al., 2008). Brachionus sp. and Keratella sp. are indicators of eutrophication of lakes (Ramachandra et al., 2006; Ozcalkap et al., 2011).
Table 4: Zooplankton groups present in Kaikondrahalli Lake
Kaikondrahalli |
Middle |
Outlet |
Near Inlet |
Rotifera |
|
|
|
Brachionus spp. |
+ |
+ |
+ |
Keratella sp. |
+ |
+ |
+ |
Copepoda |
|
|
|
Harpacticoid sp. |
+ |
+ |
- |
Mesocyclops sp. |
+ |
+ |
- |
Nauplius larva |
+ |
+ |
- |
Thermocyclops sp. |
- |
+ |
- |
Ostracoda |
|
|
|
Cypris sp. |
+ |
+ |
+ |
Cladocera |
|
|
|
Chydorus sp. |
+ |
+ |
- |
Diaphanosoma sp. |
+ |
- |
- |
Protozoa |
|
|
|
Euglena spp. |
- |
- |
+ |
Phacus sp. |
+ |
- |
+ |
Thus, the sewage entry to Kaikondrahalli lake has degraded the quality of the Lake. The pollution tolerant algae and zooplanktons were present in lake, which indicates pollution. It is suggested to let only the treated sewage to the lake to prevent it from further deterioration.
Kasavanahalli Lake
In Kasavanahalli Lake, sewage water directly enters the lake through two main inlets. The high oxygen demand and less dissolved oxygen in the inlets indicate higher pollution loads and high microbial activity. The pH was found to be alkaline due to the presence of high amounts of carbonates and bicarbonates. The untreated sewage water with high nutrients, organic matter and inorganic ions enters the lake and affects its water quality. The sodium content is very high in Kasavanahalli lake which makes the water unfit for consumption and other purposes (Arafath et al., 2008). The increased amount of nutrients had promoted algal growth.
Table 5: Physico- chemical characteristics of Kasavanahalli Lake
|
Kasavanahalli lake Inlet 1 |
Kasavanahalli lake point 1 |
Kasavanahalli Inlet 2 |
Kasavanahalli lake Inlet 2 |
Kasavanahalli lake point 2 |
Kasavanahalli lake point 3 |
Water Temperature (0C) |
25.4 |
24.7 |
22.9 |
21.8 |
24.6 |
25.6 |
TDS (mg/l) |
897 |
533 |
936 |
756 |
515 |
504 |
EC (µS) |
1230 |
897 |
1294 |
1068 |
890 |
868 |
pH |
7.71 |
8.14 |
7.62 |
7.6 |
8.05 |
8.36 |
Turbidity |
23.07 |
704 |
814 |
33.8 |
35.43 |
49.03 |
DO (mg/l) |
0 |
9.76 |
0 |
0.16 |
11.38 |
10.57 |
BOD (mg/l) |
30.49 |
10.16 |
- |
- |
20.33 |
12.2 |
COD (mg/l) |
184 |
16 |
288 |
192 |
28 |
16 |
Alkalinity (mg/l) |
642.67 |
213.33 |
737.33 |
605.33 |
213.33 |
198.67 |
Chloride (mg/l) |
293.47 |
242.82 |
339.85 |
234.77 |
236.67 |
229.09 |
Total Hardness (mg/l) |
349.33 |
161.33 |
402.67 |
347.33 |
141.33 |
144.67 |
Ca Hardness (mg/l) |
98.86 |
35 |
115.16 |
101.54 |
31.53 |
27.79 |
Mg Hardness (mg/l) |
60.86 |
30.69 |
69.86 |
59.73 |
26.68 |
28.4 |
Phosphate (mg/l) |
1.285 |
0.089 |
1.368 |
0.786 |
0.047 |
0.059 |
Nitrate (mg/l) |
0.877 |
0.241 |
0.534 |
0.345 |
0.268 |
0.271 |
Sodium (mg/l) |
273.6 |
318.4 |
480 |
802 |
305.2 |
316.4 |
Potassium (mg/l) |
49.6 |
39.6 |
80 |
98 |
40 |
34.4 |
Table 6: Algal groups present in Kasavanahalli Lake
|
|
Inlet |
L1 |
L2 |
L3 |
i |
Chlorophyceae |
|
|
|
|
1 |
Actinastrum sp. |
- |
+ |
- |
- |
2 |
Ankistrodesmus sp. |
- |
+ |
- |
- |
3 |
Chlorella sp. |
- |
+ |
- |
- |
4 |
Chodatella sp. |
- |
+ |
- |
- |
5 |
Closterium sp. |
- |
+ |
- |
- |
6 |
Cosmarium sp. |
- |
- |
+ |
- |
7 |
Crucigenia sp. |
- |
+ |
- |
- |
8 |
Desmodesmus spp. |
+ |
+ |
+ |
+ |
9 |
Dicloster sp. |
- |
+ |
- |
- |
10 |
Dictyosphaerium sp. |
- |
+ |
+ |
+ |
11 |
Golenkinia sp. |
- |
+ |
+ |
+ |
12 |
Kirchenerilla sp. |
- |
+ |
- |
+ |
13 |
Monoraphidium sp. |
+ |
+ |
- |
+ |
14 |
Oocystis sp. |
- |
+ |
- |
+ |
15 |
Pandorina sp. |
+ |
- |
- |
- |
16 |
Pediastrum sp. |
+ |
+ |
+ |
+ |
17 |
Pyrobotrys sp. |
+ |
- |
- |
- |
18 |
Scenedesmus spp. |
+ |
+ |
+ |
+ |
19 |
Schroederia sp. |
- |
+ |
+ |
- |
20 |
Stigeoclonium sp. |
- |
+ |
- |
- |
21 |
Tetraedron sp. |
+ |
+ |
- |
- |
22 |
Xanthidium sp. |
- |
- |
+ |
- |
ii |
Cyanophyceae |
|
|
|
|
1 |
Aphanocapsa sp. |
- |
- |
+ |
+ |
2 |
Chroococcus sp. |
- |
- |
+ |
- |
3 |
Gleocapsa sp. |
- |
+ |
+ |
+ |
4 |
Merismopedia sp. |
- |
+ |
+ |
+ |
5 |
Oscillatoria sp. |
+ |
- |
- |
- |
6 |
Phormidium sp. |
+ |
+ |
- |
- |
7 |
Tetrabaena sp. |
+ |
- |
- |
- |
iii |
Bacillariophyceae |
|
|
|
|
1 |
Amphora sp. |
- |
- |
+ |
- |
2 |
Cyclotella sp. |
+ |
+ |
+ |
+ |
3 |
Diploneis sp. |
+ |
- |
- |
- |
4 |
Gomphonema sp. |
+ |
+ |
- |
- |
5 |
Navicula spp. |
- |
+ |
- |
+ |
6 |
Nitzschia spp. |
+ |
+ |
+ |
+ |
7 |
Pinnularia sp. |
+ |
- |
- |
- |
8 |
Stauroneis sp. |
- |
+ |
- |
- |
9 |
Surirella sp. |
+ |
- |
- |
- |
10 |
Synedra sp. |
- |
+ |
- |
- |
iv |
Euglenophyceae |
|
|
|
|
1 |
Euglena spp. |
+ |
- |
- |
- |
2 |
Lepocincilis spp. |
+ |
- |
- |
- |
3 |
Phacus sp. |
- |
- |
+ |
- |
4 |
Trachelomonas sp. |
- |
+ |
- |
+ |
In Kasavanahalli Lake, pollution-tolerant genera are present which includes: Euglena sp. (Mahapatra et al., 2013), Nitzschia sp. (Karthick et al., 2009), Phacus sp., Cyclotella sp. (Singh et al., 2011), Gomphonema sp. (Karthick et al., 2009), Navicula sp. (Hosmani, 2012), Pinnularia sp. (Hosmani, 2012) and Trachelomonas sp. (Solorzano et al., 2011). Chlorophyceae were found to be higher in number than Cyanophyceae, Bacillariophyceae and Euglenophyceae.
Table 7: Zooplankton groups present in Kasavanahalli Lake
Kasavanahalli |
Inlet |
L1 |
L2 |
L3 |
Rotifera |
|
|
|
|
Brachionus spp. |
+ |
- |
- |
+ |
Keratella sp. |
+ |
- |
- |
+ |
Philodina sp. |
- |
+ |
- |
- |
Trichocerca sp. |
+ |
- |
- |
- |
Copepoda |
|
|
|
|
Diaptomus sp. |
- |
- |
+ |
+ |
Harpacticoid sp. |
- |
- |
+ |
+ |
Mesocyclops sp. |
+ |
- |
+ |
+ |
Nauplius larva |
- |
- |
+ |
+ |
Thermocyclops sp. |
- |
- |
- |
+ |
Ostracoda |
|
|
|
|
Cypris sp. |
+ |
- |
- |
+ |
Cladocera |
|
|
|
|
Chydorus sp. |
- |
- |
- |
+ |
Daphnia sp. |
- |
- |
+ |
+ |
Diaphanosoma sp. |
- |
- |
- |
+ |
Protozoa |
|
|
|
|
Epistylis sp. |
- |
+ |
- |
- |
Euglena spp. |
+ |
- |
- |
- |
Phacus spp. |
- |
- |
+ |
- |
In Kasavanahalli Lake, 5 groups of zooplanktons were found: Rotifera, Copepoda, Ostracoda, Cladocera and Protozoa. Cypris sp., Mesocyclops sp. and Diaphanosoma sp. were found to be more in number in nutrient rich lakes. Only in the sampling point near inlet, protozoans were very high which indicates high organic pollution (An et al., 2012). The pollution load in lakes increases the Ostracod population (Padmanabha et al., 2008). Mesocyclops sp., Daphnia sp., Brachionus sp. and Keratella sp. are indicators of eutrophication of lakes (Ramachandra et al., 2006; Ozcalkap et al., 2011; Wang et al., 2007). The Kasavanahalli is also rich in nutrients and had supported variety of phytoplankton and zooplankton that are tolerant to pollution levels.
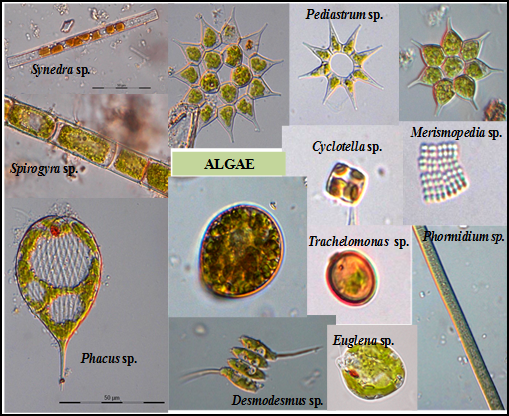
Figure 1: Algae in Lakes
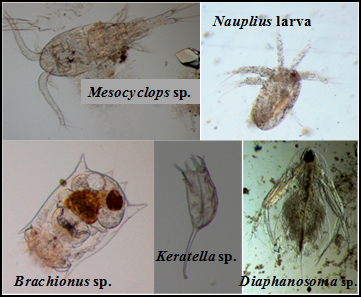
Figure 2: Zooplankton in Lakes
Conclusion:
The results reveal that the lake water is polluted due to sewage entry as indicated by high values of COD, BOD, TDS, Sodium and EC. Kasavanahalli Lake is highly disturbed due to anthropogenic activities. The Lake water was mainly used for washing, bathing and construction purposes in the lake vicinity. Due to continuous inflow of sewage, both Kaikondrahalli and Kasavanahalli Lakes seem to be threatened. Thus, proper environment management plan must be adopted to control the sewage entry into these lakes. Otherwise, it may cause contamination of groundwater and also some adverse health effects. Hence, necessary precautionary measures have to be taken before the water is used for domestic and irrigational purposes.
References
- Anon, 2011. National Wetland Atlas, SAC/EPSA/ABHG/NWIA/ATLAS/34/2011 Space Applications Centre (ISRO), Ahmedabad, India, pp. 310.
- Durga, M. M., Chanakya, H.N., Ramachandra, T.V., 2011. Assessment of treatment capabilities of Varthur Lake, Bangalore, India Int. J. Environmental Technology and Management, 14 (1/2/3/4).
- Garg, J.K., Singh, T.S., Murthy, T.V.R., 1998. Wetlands of India, Project Report: RSAM/SAC/RESA/PR/01/98, Space Applications Centre (ISRO), Ahmedabad, pp. 239.
- Infochange India, http://infochangeindia.org/water-resources/news/indian-govt-has-a-duty-to-protect-lakes-ponds-supreme-court.html. (Last accessed 10.1.15).
- Ramachandra, T.V., Bharath, H. A. Kumar, u., 2012. Conservation of Wetlands to Mitigate Urban Floods, Resources, Energy, and Development. 9(1), pp. 1-22.
- Ramachandra, T.V., 2009. Conservation and management of urban wetlands: Strategies and challenges, ENVIS Technical Report: 32, Environmental Information System, Centre for Ecological Sciences, Bangalore.
- Ramachandra, T.V., Bharath, H. A., Durgappa, D. S., 2012. Insights to Urban Dynamics through Landscape Spatial Pattern Analysis. International Journal of Applied Earth Observation and Geoinformation, 18, 329-343.
- Ramsar Convention, 2013. The Ramsar Convention Bureau, Rue Mauverney 28, CH-1196, Gland, Switzerland, (Last accessed 3.1.15), available at: www.ramsar.org.
- Vijayan, V.S., 2004. Inland Wetlands of India: Conservation Priorities, a report prepared by SACON (Salim Ali Centre for Ornithology and Natural History), Kerala.
- Ramachandra T.V., 2009.Soil and Groundwater Pollution from Agricultural Activities, Commonwealth Of Learning, Canada and Indian Institute of Science, Bangalore, Printed by TERI Press, New Delhi.
- Ramachandra T V, 2009a, Conservation and management of urban wetlands: Strategies and challenges, ENVIS Technical Report: 32, Environmental Information System, Centre for Ecological Sciences, Bangalore.
- Ramachandra T V, 2009b. Essentials in urban lake monitoring and management, CiSTUP Technical report 1, Urban Ecology, Environment and Policy Research, Centre for Infrastructure, Sustainable Transportation and Urban Planning, IISc, Bangalore
- Kulkarni, V. and Ramachandra T.V. 2009, Environmental Management, Commonwealth Of Learning, Canada and Indian Institute of Science, Bangalore, Printed by TERI Press, New Delhi
- Ramachandra T.V and Kumar U, 2008, Wetlands of Greater Bangalore, India: Automatic Delineation through Pattern Classifiers, The Greendisk Environmental Journal. Issue 26 (http://egj.lib.uidaho.edu/index.php/egj/article/view/3171).
- Ramachandra T V and Uttam Kumar, 2009, Land surface temperature with land cover dynamics: multi-resolution, spatio-temporal data analysis of Greater Bangalore, International Journal of Geoinformatics, 5 (3):43-53
- Ramachandra T V and Mujumdar P M, 2009. Urban floods: case study of Bangalore, Journal of Disaster Development, 3(2):1-98
- Ramachandra T.V. and Shwetmala, 2009, Emissions from India's Transport sector: State wise Synthesis, Atmospheric Environment, 43 (2009) 5510–5517.
|
T.V. Ramachandra
Centre for Sustainable Technologies, Centre for infrastructure, Sustainable Transportation and Urban Planning (CiSTUP), Energy & Wetlands Research Group, Centre for Ecological Sciences, Indian Institute of Science, Bangalore – 560 012, INDIA.
E-mail : cestvr@ces.iisc.ac.in
Tel: 91-080-22933099/23600985,
Fax: 91-080-23601428/23600085
Web: http://ces.iisc.ac.in/energy
Bharath H AithalEnergy & Wetlands Research Group, Centre for Ecological Sciences, Indian Institute of Science, Bangalore – 560 012, INDIA.
E-mail: bharath@ces.iisc.ac.in
Vinay SEnergy & Wetlands Research Group, Centre for Ecological Sciences, Indian Institute of Science, Bangalore – 560 012, INDIA.
E-mail: vinay@ces.iisc.ac.in
Bharath Setturu
Energy & Wetlands Research Group, Centre for Ecological Sciences, Indian Institute of Science, Bangalore – 560 012, INDIA.
E-mail: settur@ces.iisc.ac.in
Asulabha K S
Energy & Wetlands Research Group, Centre for Ecological Sciences, Indian Institute of Science, Bangalore – 560 012, INDIA.
E-mail: asulabha@ces.iisc.ac.in
Sincy V.
Energy & Wetlands Research Group, Centre for Ecological Sciences, Indian Institute of Science, Bangalore – 560 012, INDIA.
E-mail: sincy@ces.iisc.ac.in
Sudarshan P.Bhat
Energy & Wetlands Research Group, Indian Institute of Science, Bangalore – 560 012, INDIA.
E-mail: sudarshan@ces.iisc.ac.in
Citation: Ramachandra T V, Bharath H.Aithal, Vinay S, Bharath Setturu, Asulabha K S, Sincy V and Sudarshan P. Bhat, 2015. Vanishing Lakes Interconnectivity & Violations in Valley Zone: Lack of Co-ordination among Para-State Agencies, ENVIS Technical Report 85, CES, Indian Institute of Science, Bangalore 560012
| Contact Address : |
| |
Dr. T.V. Ramachandra
Energy & Wetlands Research Group,
Centre for Ecological Sciences,
New Biological Sciences Building, 3rd Floor, E-Wing, Lab: TE15
Indian Institute of Science, Bangalore – 560 012, INDIA.
Tel : 91-80-22933099 / 22933503(Ext:107) / 23600985
Fax : 91-80-23601428 / 23600085 / 23600683 [CES-TVR]
E-mail : cestvr@ces.iisc.ac.in, energy@ces.iisc.ac.in,
Web : http://wgbis.ces.iisc.ac.in/energy |
|