|
|
Effect of Vehicular traffic
The road network is as depicted in figure 12, the nearest main road (Sarjapur road) from the existing construction site behind Kaikondrahalli lake is 1.5 km, with road width of 7.0 m, 2 lanes and 2 way
Figure 12: Existing road network(Source: Google Maps).
Road maximum capacity: As per IRC (Indian Road Congress) for a 2 lane road with traffic flow on both sides, for roads with no frontage access, no standing vehicles, very little cross traffic (intersection) capacity is 1200 PCU/hour (PCU- Passenger Car Unit) (Table 6).
No. of Traffic Lanes and width |
Traffic Flow |
Capacity in PCU per hour for traffic condition |
Roads with no frontage access, no standing vehicles, very little cross traffic |
Roads with frontage access, but no standing vehicle and high capacity intersections |
Roads with free frontage access, parked vehicles and heavy cross traffic |
Two lane 7.0-7.5 m |
One way |
2400 |
1500 |
1200 |
Two lane 7.0-7.5 m |
Two way |
1500 |
1200 |
750 |
Three lane 10.5 m |
One way |
3600 |
2500 |
2000 |
Four lane 14.0 – 15.5 m |
One way |
4800 |
3000 |
2400 |
Four lane 14.0 – 15.5 m |
Two way |
4000 |
2500 |
2000 |
6 lane 21 m |
Two way |
6000 |
4200 |
3600 |
Table 6: Capacity of Urban Roads as per IRC
Source: Highway Engineering. S.K.Khanna & C.E.G.Justo,8th Edition, Table 5.8,pp 191
V/C ratio |
LOS |
Performance |
0.0 – 0.2 |
A |
Excellent |
0.2 – 0.4 |
B |
Very Good |
0.4 – 0.6 |
C |
Average / Fair |
0.6 – 0.8 |
D |
Poor |
0.8 – 1.0 |
E |
Very Poor |
1.0 – 1.2 |
F |
Very Very Poor |
Table 7: Category of Roads based on traffic and service, Source: IRC
For Connecting road between Sarjapur Road and the , with average length of a PCU as 4.5m at an average speed of 35kmph and driver reaction time of 0.7 seconds, the capacity was estimated to be 3094 PCU/hour, on either side of the road, where as for Sarjapur Road, with average length of a PCU as 4.5m at an average speed of 45kmph and driver reaction time of 0.7 seconds, the capacity was estimated to be 3372 PCU/hour, on either side of the road. Table 8 explains the effectiveness of the road based on the traffic. Due to the dwelling apartments additional 3000 vehicles as PCU is likely to be added
Description of Road |
Connecting road |
Sarjapura Road |
Vehicle speed in kmph |
35 |
45 |
Average length of vehicle PCU in m |
4.5 |
4.5 |
Number of lanes |
2 |
4 |
Driver reaction time in seconds |
0.7 |
0.7 |
average spacing between vehicles
= (0.278*velocity* reaction time )+ Vehicle Length |
11.3 |
13.3 |
Theoretical Maximum Capacity of Lane as PCU per lane per hour
= 1000*( Velocity)/( Spacing b/w vehicles) |
3094 |
3394 |
PCU Density vehicle/km/lane
= Number of Vehicles per hour/Vehicle speed |
88 |
75 |
Maximum capacity flow occurs when speed is Velocity/2 and Density is PCU Density/2 (or Jam Density)
Maximum flow of traffic as number of PCU per lane per hour per km
= Velocity/2 * PCU Density/2 |
770 |
843 |
Length of the road |
1.8 |
0.8 |
Maximum flow as vehicles per km per hour |
2310 |
2697 |
Peak Hour Traffic |
800 |
2000 |
Current Vehicular Traffic to Maximum Capacity Ratio (ratio of peak hour traffic to maximum flow) |
0.34 |
0.74 |
Current Level of Service |
Good |
Average |
Additional Vehicles as PCU due to the apartments |
2000 |
Additional Vehicles added to traffic per hour |
800 |
800 |
Number of Vehicles due to addition |
1600 |
2800 |
Vehicular Traffic to Maximum Capacity Ratio due to addition of new vehicles |
0.69 |
1.04 |
Level of Service due to the additional vehicles |
Average |
Very Very Poor |
Reference: Highway Engineering. S.K.Khanna & C.E.G.Justo
[Assumption: 800 PCU/hour addition during peak hours for 3 hours (example : 8 AM to 11 AM)]
Table 8: Vehicular Traffic
The equivalent ratio of V/C (Table 7) to the LOS is D and F respectively for the connecting road and the Sarjapur road, indicating very poor traffic conditions, creating bottle necks. The probable bottle necks are as depicted in figure 13.
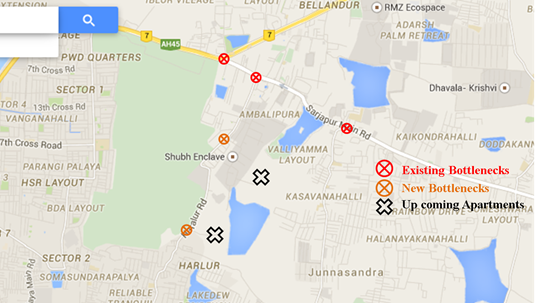
Figure 13: Bottlenecks
|
T.V. Ramachandra
Centre for Sustainable Technologies, Centre for infrastructure, Sustainable Transportation and Urban Planning (CiSTUP), Energy & Wetlands Research Group, Centre for Ecological Sciences, Indian Institute of Science, Bangalore – 560 012, INDIA.
E-mail : cestvr@ces.iisc.ac.in
Tel: 91-080-22933099/23600985,
Fax: 91-080-23601428/23600085
Web: http://ces.iisc.ac.in/energy
Bharath H AithalEnergy & Wetlands Research Group, Centre for Ecological Sciences, Indian Institute of Science, Bangalore – 560 012, INDIA.
E-mail: bharath@ces.iisc.ac.in
Vinay SEnergy & Wetlands Research Group, Centre for Ecological Sciences, Indian Institute of Science, Bangalore – 560 012, INDIA.
E-mail: vinay@ces.iisc.ac.in
Bharath Setturu
Energy & Wetlands Research Group, Centre for Ecological Sciences, Indian Institute of Science, Bangalore – 560 012, INDIA.
E-mail: settur@ces.iisc.ac.in
Asulabha K S
Energy & Wetlands Research Group, Centre for Ecological Sciences, Indian Institute of Science, Bangalore – 560 012, INDIA.
E-mail: asulabha@ces.iisc.ac.in
Sincy V.
Energy & Wetlands Research Group, Centre for Ecological Sciences, Indian Institute of Science, Bangalore – 560 012, INDIA.
E-mail: sincy@ces.iisc.ac.in
Sudarshan P.Bhat
Energy & Wetlands Research Group, Indian Institute of Science, Bangalore – 560 012, INDIA.
E-mail: sudarshan@ces.iisc.ac.in
Citation: Ramachandra T V, Bharath H.Aithal, Vinay S, Bharath Setturu, Asulabha K S, Sincy V and Sudarshan P. Bhat, 2015. Vanishing Lakes Interconnectivity & Violations in Valley Zone: Lack of Co-ordination among Para-State Agencies, ENVIS Technical Report 85, CES, Indian Institute of Science, Bangalore 560012
| Contact Address : |
| |
Dr. T.V. Ramachandra
Energy & Wetlands Research Group,
Centre for Ecological Sciences,
New Biological Sciences Building, 3rd Floor, E-Wing, Lab: TE15
Indian Institute of Science, Bangalore – 560 012, INDIA.
Tel : 91-80-22933099 / 22933503(Ext:107) / 23600985
Fax : 91-80-23601428 / 23600085 / 23600683 [CES-TVR]
E-mail : cestvr@ces.iisc.ac.in, energy@ces.iisc.ac.in,
Web : http://wgbis.ces.iisc.ac.in/energy |
|