|
|
|
Land use: Land use Dynamics: Gaussian MLC classifier was used, the land use (figure 3, Table 3) results shows that Built up area in the catchment has increased from 22.14% in 2003 to over 46.2% compromising the laws of the city developmental authorities, CDP, MoEF.
| Land use |
2003 |
2014 |
Built up |
22.14% |
46.62% |
Vegetation |
23.23% |
5.51% |
Water |
2.61% |
2.89% |
Others |
52.01% |
44.98% |
Table 3: Land use in the catchment
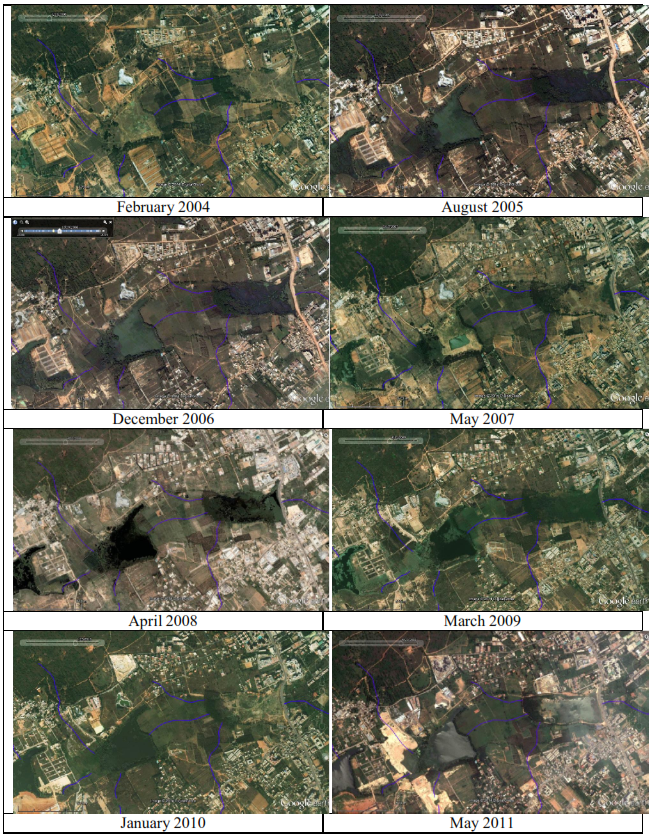
Temporal remote sensing data (Google earth data) were compared in order to visualize, understand the land use dynamics in the catchment with respect to the acquired satellite data (Figure 4).


|
T.V. Ramachandra
Centre for Sustainable Technologies, Centre for infrastructure, Sustainable Transportation and Urban Planning (CiSTUP), Energy & Wetlands Research Group, Centre for Ecological Sciences, Indian Institute of Science, Bangalore – 560 012, INDIA.
E-mail : cestvr@ces.iisc.ac.in
Tel: 91-080-22933099/23600985,
Fax: 91-080-23601428/23600085
Web: http://ces.iisc.ac.in/energy
Bharath H AithalEnergy & Wetlands Research Group, Centre for Ecological Sciences, Indian Institute of Science, Bangalore – 560 012, INDIA.
E-mail: bharath@ces.iisc.ac.in
Vinay SEnergy & Wetlands Research Group, Centre for Ecological Sciences, Indian Institute of Science, Bangalore – 560 012, INDIA.
E-mail: vinay@ces.iisc.ac.in
Bharath Setturu
Energy & Wetlands Research Group, Centre for Ecological Sciences, Indian Institute of Science, Bangalore – 560 012, INDIA.
E-mail: settur@ces.iisc.ac.in
Asulabha K S
Energy & Wetlands Research Group, Centre for Ecological Sciences, Indian Institute of Science, Bangalore – 560 012, INDIA.
E-mail: asulabha@ces.iisc.ac.in
Sincy V.
Energy & Wetlands Research Group, Centre for Ecological Sciences, Indian Institute of Science, Bangalore – 560 012, INDIA.
E-mail: sincy@ces.iisc.ac.in
Sudarshan P.Bhat
Energy & Wetlands Research Group, Indian Institute of Science, Bangalore – 560 012, INDIA.
E-mail: sudarshan@ces.iisc.ac.in
Citation: Ramachandra T V, Bharath H.Aithal, Vinay S, Bharath Setturu, Asulabha K S, Sincy V and Sudarshan P. Bhat, 2015. Vanishing Lakes Interconnectivity & Violations in Valley Zone: Lack of Co-ordination among Para-State Agencies, ENVIS Technical Report 85, CES, Indian Institute of Science, Bangalore 560012
| Contact Address : |
| |
Dr. T.V. Ramachandra
Energy & Wetlands Research Group,
Centre for Ecological Sciences,
New Biological Sciences Building, 3rd Floor, E-Wing, Lab: TE15
Indian Institute of Science, Bangalore – 560 012, INDIA.
Tel : 91-80-22933099 / 22933503(Ext:107) / 23600985
Fax : 91-80-23601428 / 23600085 / 23600683 [CES-TVR]
E-mail : cestvr@ces.iisc.ac.in, energy@ces.iisc.ac.in,
Web : http://wgbis.ces.iisc.ac.in/energy |
|