|
Lotic Ecosystems: Intra basin variations in quality
Lotic Ecosystems: Intra basin variations in quality
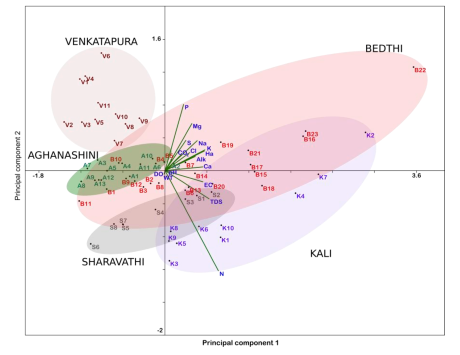
Principal component analysis reveals that BRB (Bedthi River Basin) contains sites with pristine to heavily polluted waters. Most of the sites in BRB in the northern portion stand out separately in ordination space due to their very high amount of ions and nutrients. SRB (sharavathi River Basin), KRB (Kali River Basin) and ARB (Aghanashini River Basin) sites seem to fall in the same quality of water, where as the VRB (Venkatapura River Basin) stands out separately with very pristine water quality status (Fig 18, 20). NMDS plot of the water quality variables shows that ionic and physical parameters have the same origin, where as nutrients arise from different source (Fig. 19)
Figure 18: PCA plot for water quality variables across the river basins
Seasonality of Benthic Diatoms and water quality
The water chemistry data along the Bedthi River showed high annual variation across sites. Stream water chemistry differed between the three groups of sites (Figure 16). The parameters which showed significant different among the groups were pH, conductivity, chlorides, hardness, calcium, magnesium, sodium and potassium. All the above mentioned parameters were high in HPAS, moderate in MPPS and very low in LPFS. Irrespective of the pollution status, dissolved oxygen (DO) levels across water quality regimes were roughly similar with mean DO levels (Mean±S.D) of 7.51±1.67, 7.08±2.21, 6.43±2.91. However an anoxic DO level of 0.86 mgL-1 was observed in one sample from the HPAS (KAL) (Refer the Table 2 for detailed water chemistry data). PCA results indicated that water quality differed markedly among sampling sites and across seasons (Figure 3) with the first component explaining 84.6% of the total variation. Three distinct clusters were observed along a pollution gradient. Sample scores from HPAS (KAL and MAN) were positioned to the right along PCA axis 1, and were characterized by higher conductivity, phosphates, nitrates, alkalinity, hardness, calcium, sodium and potassium levels. MPPS (AND, DAN) were positioned along the PCA axis 2. In contrast, samples from the LPFS (HAS, KAM) were located to the left along PCA axis 1, and were characterized by higher DO and low levels of ions and nutrients. Water chemistry parameters like pH, carbon dioxide, alkalinity, nitrates, sulphates were positively loaded while dissolved oxygen was negatively loaded with principal axes. These results indicate that water chemistry between the sites was strongly different throughout the year.
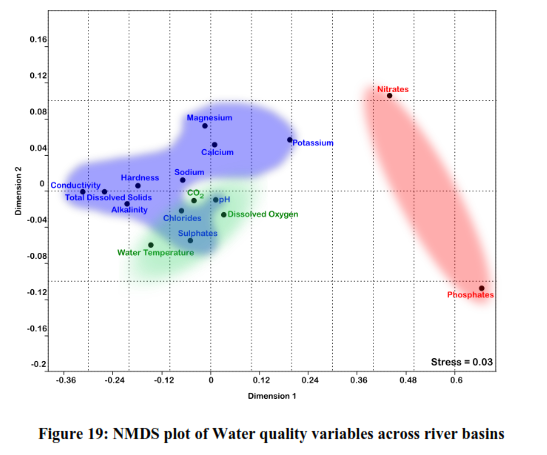
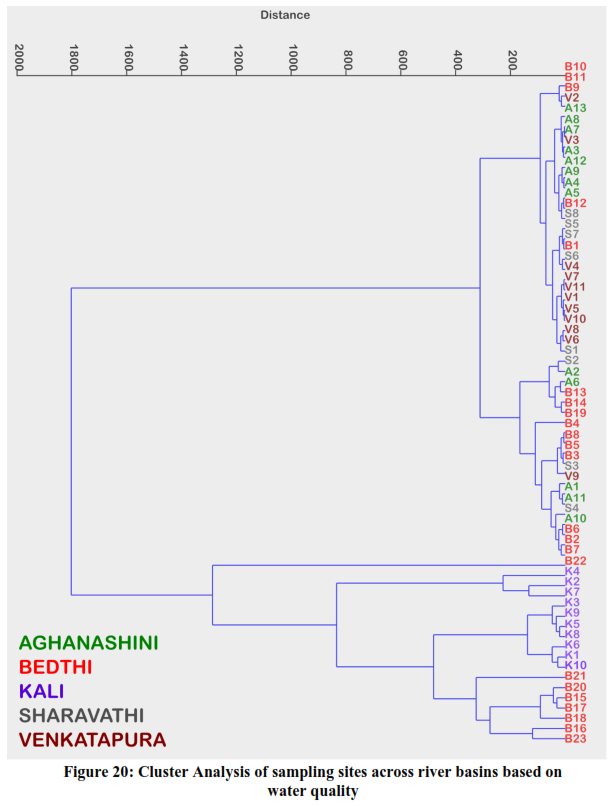
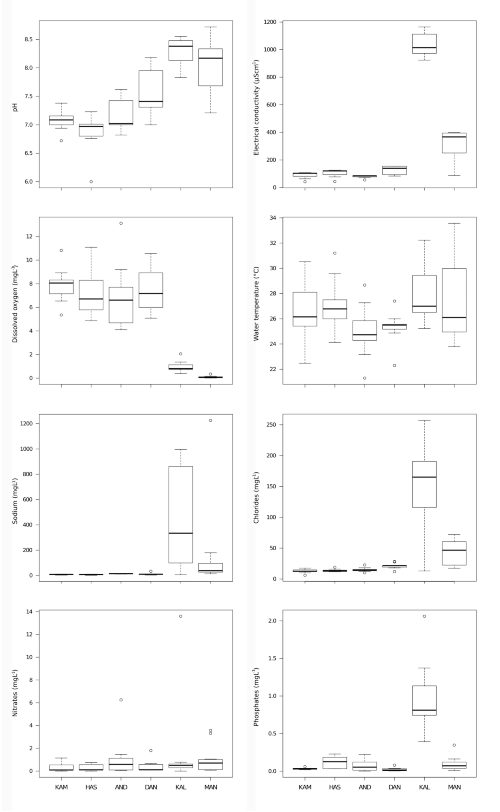
Figure 21: Water chemistry at sampled sites during the study period Jan 2006 - Dec 2006 at BRB
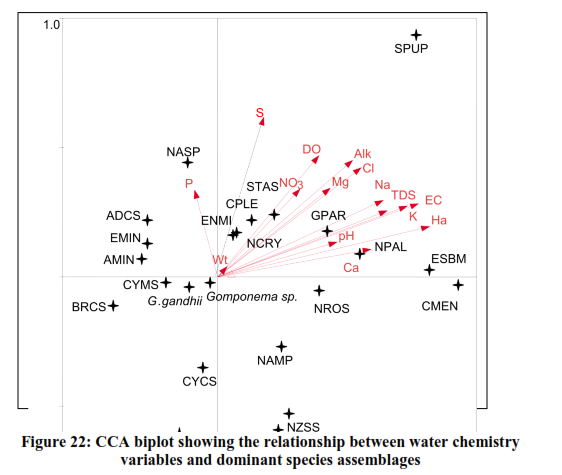
One hundred and three species of diatoms were recorded from all the six sites during the study period, with a flora typical of oligotrophic to eutrophic condition. Among the taxa recored, the most abundant diatom species were Achnanthidium minutissimum(Kϋtz) Czarn., Gomphonema gandhiiKarthick & Kociolek, G. difformum Karthick & Kociolek, Nitzschia palea(Kϋtz) W. Sm., Nitzschia frustulum(Kϋtz) Grun., Cymbella sp. and Navicula sp. Achnanthidium minutissimum, Gomphonema gandhii and G. difformum, were present throughout most of the study in LPFS and MPPS, while Nitzschia palea and Nitzschia frustulum were dominant in HPAS. In contrast, Cymbella sp. was the only diatom present at the MAN site during the month of April. The samples from headwater oligotrophic streams (often with low pH and conductivity) were characterized by the occurrence of Gomphonema gandhii, Achnanthidium minutissimum and Gomphonema difformum. Assemblages from eutrophic streams (HPAS) were characterized by dominance of Nitzschia palea, N. frustulum and occasionally with Cyclotella meneghiniana.
The species richness was highest at three sites; KAM, DAN and MAN, even though each one inherited different water chemistry regimes. All six sites were characterized with very low species richness during the monsoon season (Table 3). In all sites across the study, the diversity (H') ranged between the highest 2.34 in DAN during the month of February to lowest of 0 in KAM and KAL during the monsoon months. Kruskal–Wallis results showed that the species diversity across three water chemistry regimes were significantly different (Kruskal–Wallis, H = 6.97; p = 0.03).
Species abundances across season suggested trends within community composition in ordination space (Figure 22). In sites KAM and KAL communities of post monsoon season aggregated in ordination space, however this trend were not seen in HAS, DAN, MAN and AND sites. In LPFS (KAM and HAS) and MPPS (AND and DAN) diatom assemblages were identical for pre-monsoon, monsoon and post-monsoon seasons respectively, whereas the assemblages in HPAS (KAL and MAN) were not identical across seasons. Though there are trends on community composition, it looks like there is a strong relation with the seasonally dynamic environmental variables. The difference in the species richness among sites were not significant (Kruskal–Wallis H = 6.07; p = 0.29). Species richness from highest to lowest within water quality regimes, followed the order LPFS > MPPS > HPAS. Overall, species richness was lowest during the monsoon months in all the sites. Changes in species composition or percentage turnover (T) did not follow any trend irrespective of site water chemistry. The highest mean turnover (94.44%±11.11) was observed in MAN, indicating the lowest persistence (Figure 5), followed by DAN (79.08±14.47), HAS (70.46±27.64) and AND (64.77±23.71). The mean species turnover was less than 50% in KAL (47.96±38.1) and KAM (44.03±20.85). Interestingly, KAL showed a wide range of turnover with a minimum of 9% during the post monsoon and a maximum turnover of 100% during the monsoon months. In LPFS sites 25% of the species were persistent across seasons and in MPPS sites 30% of the species were persistent. However in the HPAS sites a minimum persistence of 7.14% was observed for KAL and 80% persistence in MAN. The differences in turnover were significant across sites (Kruskal–Wallis H = 17.52; p = 0.0036).
Table 3: Species richness and diversity across space and time at BRB sites
MONTHS |
LPFS |
HPAS |
MPPS |
KAM |
HAS |
KAL |
MAN |
AND |
DAN |
JAN |
14 (1.10) |
10 (1.04) |
7 (1.58) |
-L- |
4 (0.81) |
14 (2.27) |
FEB |
10 (1.58) |
6(1.10) |
7 (1.65) |
9 (1.63) |
4 (1.04) |
19 (2.34) |
MAR |
4 (1.25) |
6 (0.85) |
8 (1.73) |
14 (1.90) |
6 (0.95) |
-D- |
APR |
7 (1.47) |
7 (0.67) |
9 (1.65) |
1 (0) |
8 (0.93) |
-D- |
MAY |
11 (1.40) |
4 (0.47) |
3 (0.92) |
8 (1.34) |
11 (1.76) |
-D- |
JUN |
9 (1.16) |
3 (0.15) |
4 (1.02) |
-M- |
3 (0.98) |
5 (1.14) |
JUL |
4 (0.77) |
-M- |
1 (0) |
-M- |
6 (1.19) |
7 (1.46) |
AUG |
-M- |
-M- |
-M- |
-M- |
5 (0.79) |
5 (1.35) |
SEP |
1 (0) |
-M- |
1 (0) |
-M- |
2 (0.69) |
9 (1.67) |
OCT |
4 (0.78) |
5 (0.77) |
5 (1.34) |
5 (1.15) |
9 (1.29) |
9 (1.35) |
NOV |
4 (0.82) |
4 (0.94) |
6 (1.54) |
-L- |
-L- |
4 (0.84) |
DEC |
4 (0.87) |
-L- |
8 (1.76) |
16 (2.02) |
2 (0.69) |
10 (1.39) |
Percentage occupancy showed a significant relationship with local maximum species abundance (r = 0.49; P = <0.0001) and local mean species abundance (r = 0.37; P = <0.0001). This positive correlation was slightly stronger for the local maximum abundance; however it was highly significant for both the local abundance measures. Species that occurred locally with more frequency also tended to be abundant across the sites. The species–occupancy frequency distribution (Figure 23) followed a “satellite-mode” (Hanski, 1982) of species distribution, where a high proportion of species occurred at a small number of sites. Sixty-three species occurred in only one site, twenty two species in two sites, eleven species occurred in three sites; five species occurred in four sites, three species occurred in five sitesand none of the species occurred in all the six sites.
|
Dr. T.V. Ramachandra
Centre for Sustainable Technologies, Centre for infrastructure, Sustainable Transportation and Urban Planning (CiSTUP), Energy & Wetlands Research Group, Centre for Ecological Sciences, Indian Institute of Science, Bangalore – 560 012, INDIA.
E-mail : cestvr@ces.iisc.ac.in
Tel: 91-080-22933099/23600985,
Fax: 91-080-23601428/23600085
Web: http://ces.iisc.ac.in/energy
Subash Chandran M.DEnergy & Wetlands Research Group, Centre for Ecological Sciences, Indian Institute of Science, Bangalore – 560 012, INDIA.
E-mail: mds@ces.iisc.ac.in
Joshi N.V.Energy & Wetlands Research Group, Centre for Ecological Sciences, Indian Institute of Science, Bangalore – 560 012, INDIA.
E-mail: nvjoshi@ces.iisc.ac.in
Karthick B.
Energy & Wetlands Research Group, Centre for Ecological Sciences, Indian Institute of Science, Bangalore – 560 012, INDIA.
Sameer Ali
Energy & Wetlands Research Group, Centre for Ecological Sciences, Indian Institute of Science, Bangalore – 560 012, INDIA.
Vishnu D. Mukri
Energy & Wetlands Research Group, Centre for Ecological Sciences, Indian Institute of Science, Bangalore – 560 012, INDIA.
Citation:Ramachandra T.V., Subash Chandran M.D., Joshi N.V., Karthick B., Sameer Ali, Vishnu D. Mukri, 2012. Ecohydrology of Lotic Ecosystems of Uttara Kannada, Central Western Ghats , ENVIS Technical Report 40, Energy & Wetlands Research Group, CES, IISc, Bangalore, India.
| Contact Address : |
| |
Dr. T.V. Ramachandra
Energy & Wetlands Research Group,
Centre for Ecological Sciences, TE 15, New Biology Building, Third Floor, E Wing, [Near D Gate], Indian Institute of Science, Bangalore – 560 012, INDIA.
Tel : 91-80-22933099 / 22933503-extn 107
Fax : 91-80-23601428 / 23600085 / 23600683 [CES-TVR]
E-mail : cestvr@ces.iisc.ac.in, energy@ces.iisc.ac.in,
Web : http://wgbis.ces.iisc.ac.in/energy |
|