|
Relationship of LULC with water chemistry and diatom assemblages
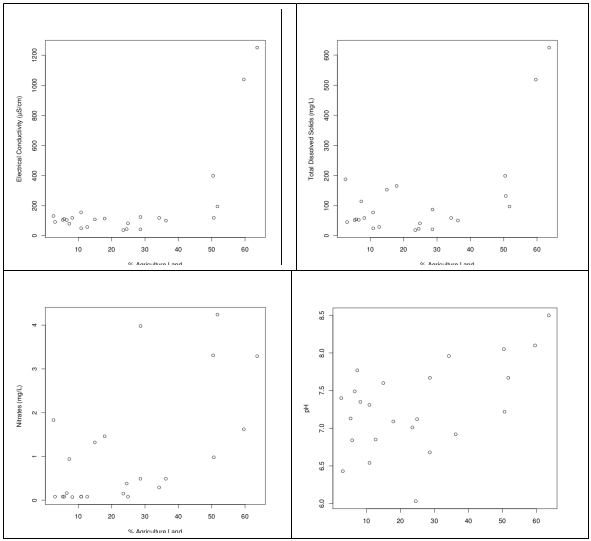
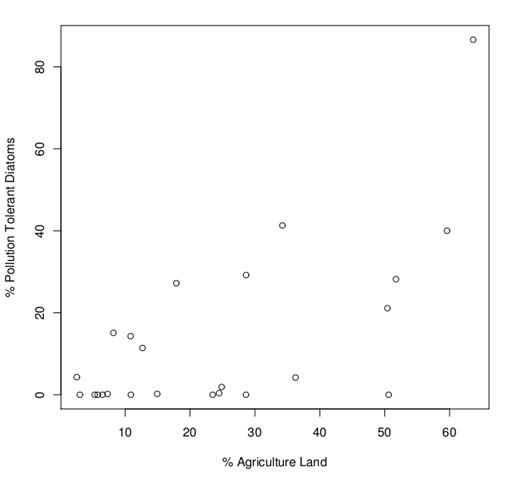
Correlation between percentage agricultural land cover with water chemistry variables and diatom autecological indices revealed the role of landscape level drivers in natural forest cover due to creation of new settlement for relocation of people and associated increase in cultivation of crops (Hegde et al., 1994). Earlier studies confirm that agricultural expansion as one of the major driver for deforestation (Menon and Bawa, 1998) in Western Ghats determining the environmental condition of streams and diatom assemblages (Figure 27). The gradient of percentage agriculture land cover were positively correlated with water chemistry variables like electrical conductivity (r = 0.67), total dissolved solids (r = 0.62), nitrates (r = 0.60) and pH (r = 0.52). Gradient of percentage agriculture land cover were positively correlated with percentage pollution tolerant diatoms (r = 0.65, Figure 28). Relation between the diatom autecological indices with land cover and water chemistry variables are given in Tables 7 and 8 respectively. Most of the diatom autecological parameters were positively correlated with forest/vegetative cover and negatively correlated with agriculture/cultivable and scrub land cover. All the diatom indices were normalized to a range of 0-20, where <9 indicates bad water quality, 9 to 12 indicates poor water quality, 12 to 15 indicates moderate water quality, 15 to 17 indicates good quality and >17 indicates high quality. The present study shows that within a similar ecoregion, the diversity and community composition of diatoms changes with LULC pattern. Among all the 24 catchments, most of the catchments were dominated by forest/vegetation land cover. However, forest cover in the leeward side catchment was very low owing to anthropogenic activities. Hydro power projects commenced in the study area since 1960s seem to have lost.
 Figure 25: Dendrogram of the cluster analysis based on (a) LULC and (b) water quality, according to the 24 sampling sites of the Central Western Ghats
Figure 26: PCA bi-plots of water chemistry and LULC variables in study sites in Central Western Ghats streams
Figure 27: Changes in water quality variables along a gradient of percentage agricultural land cover in Central Western Ghats.
Figure 28: Relations between percentage pollution tolerant diatoms with gradient of percentage agricultural land cover in Central Western Ghats
The streams drained from catchment with agriculture and scrub land cover were characterized with ionic and nutrient rich, which notify that the water chemistry variables were decided by the land cover types. Many studies have reported that urban and agricultural land use play a primary role in degrading water quality in adjacent aquatic systems by altering the soil surface conditions, increasing the impervious area and generating pollution (Tong and Chen, 2002; White and Greer, 2006).
Table 7: Percentage LULC classes for each catchment in the study area
|
Forest/ Vegetation |
Agriculture/ Cultivation |
Open Scrub/ Barren Land |
Water Bodies |
Built Up |
Others |
CHI |
52.5 |
34.24 |
10.9 |
1.18 |
0.14 |
1.04 |
MEL |
83.58 |
10.88 |
0.57 |
2.84 |
1.52 |
0.61 |
KEL |
85.83 |
8.19 |
1.4 |
3.03 |
0.92 |
0.62 |
BEE |
90.41 |
2.55 |
0.16 |
5.11 |
1.16 |
0.61 |
ANG |
81.54 |
12.67 |
1.38 |
0.08 |
0.18 |
4.14 |
MAK |
95.45 |
3.02 |
0.38 |
0.01 |
0.13 |
1.01 |
HUR |
52.84 |
28.62 |
11.89 |
3.91 |
0.1 |
2.64 |
MAV |
48.85 |
36.26 |
10.79 |
2.94 |
0.43 |
0.73 |
YEN |
56.15 |
24.49 |
10.47 |
5.61 |
0.16 |
3.12 |
BAI |
70.85 |
23.49 |
0.99 |
0.58 |
0.2 |
3.89 |
DEE |
64.34 |
28.64 |
3.62 |
0.51 |
0.2 |
2.69 |
YAN |
90.83 |
6.52 |
0.56 |
0.02 |
0.08 |
1.98 |
SAP |
42.8 |
50.61 |
4.5 |
0.97 |
0.31 |
0.81 |
BAD |
88.36 |
7.29 |
0.24 |
0.11 |
0.06 |
3.94 |
NAI |
67.43 |
17.89 |
3.65 |
1.03 |
0.44 |
9.58 |
SAK |
80.08 |
14.94 |
0.26 |
0.92 |
0.24 |
3.58 |
AND |
68.1 |
24.87 |
3.36 |
0.93 |
0.98 |
1.77 |
DAA |
86.29 |
10.84 |
0.58 |
1.26 |
0.41 |
0.63 |
HAS |
88.6 |
5.77 |
0.42 |
3.96 |
0.88 |
0.37 |
KAM |
88.8 |
5.31 |
0.6 |
4.01 |
0.89 |
0.39 |
MAN |
23.46 |
50.42 |
20.69 |
0.67 |
0.52 |
4.25 |
KAL |
0.53 |
59.6 |
30.22 |
0.02 |
0.84 |
8.79 |
SAN |
0.13 |
63.63 |
31.48 |
0.02 |
0.16 |
4.59 |
GUN |
36.82 |
51.72 |
10.52 |
0.52 |
0.35 |
0.07 |
Our results conform to earlier studies, suggesting better water quality tendencies in watersheds having less urbanization with more natural vegetation region. Percent agriculture in the catchment ranged from 2 to 63% with an average of 24.27% so the sites we selected covered a good range of the land-use gradient. An aggregated measure of LULC such as percentage agriculture in catchments may only represent the potential of LULC effects on streams. Percentage agriculture lands in catchments were positively correlated with the ionic and nutrient variables. Studies have shown that the percentage of agriculture at watershed scale is a primary predictor for nitrogen and phosphorus (Ahearn et al., 2005).
Table 8: Water chemistry variables of the sampling sites in Central Western Ghats
Water Chemistry variables (Units) |
Mean±S.D |
Range |
pH |
7.28±0.58 |
6.03-8.50 |
Water Temperature (°C) |
26.09±2.52 |
22.10-35.43 |
Electrical Conductivity (µScm-1) |
199.00±301.44 |
37.17-250.67 |
Total Dissolved Solids (mgL-1) |
120.26±149.68 |
18.67-624.67 |
Alkalinity (mgL-1) |
70.44±111.46 |
12.00-421.07 |
Chlorides (mgL-1) |
35.25±62.36 |
4.99-255.92 |
Hardness (mgL-1) |
69.49±96.94 |
12.00-376.00 |
Calcium (mgL-1) |
14.76±17.33 |
1.60-84.97 |
Magnesium (mgL-1) |
15.72±18.58 |
1.17-71.01 |
Dissolved Oxygen (mgL-1) |
7.58±1.77 |
4.81-11.52 |
Phosphates (mgL-1) |
0.18±0.36 |
0.01-1.30 |
Sulphates (mgL-1) |
19.94±18.07 |
2.91-67.91 |
Sodium (mgL-1) |
52.92±201.09 |
1.05-996.03 |
Potassium (mgL-1) |
11.01±35.01 |
0.41-168.33 |
Nitrates (mgL-1) |
1.06±1.33 |
0.07-4.24 |
Diatom community structure in streams of the CWG was strongly related to land use practices as in many other regions (Stevenson et al., 2009; Walsh and Wepener, 2009). The nutritional changes in the streams triggered by the LULC analysis stands as a determining factor in structuring the diatom species composition. Effects of nutrient are commonly identified as one of the most important determinants of diatom species composition in lentic and lotic ecosystems (Pan and Stevenson, 1996). However the diatom species composition at CWG stream were controlled more by the ionic variables than the nutrient concentration, which is evident by the dominance of fresh to brackish water diatom species in agriculture catchments. More of pollution tolerant species were seen in the streams in agriculture dominated catchments. Blinn (1993, 1995) found that higher salinities (≥35 mScm-1) tend to override other water quality parameters in structuring diatom communities in salt lakes. Agriculture dominated sites like SAN and KAL represented water quality with high nutrient concentration along with elevated levels of total dissolved solids, and pH (Figures 25 and 26) which is also supported by positive correlation of percentage agriculture land cover with percentage pollution tolerant diatoms (Figure 28). Correlation analyses between measured land cover of the watersheds and water quality parameters reveal a number of interesting aspects of the pattern effects of land uses on water quality. The application of indices on the diatom communities revealed significant correlation of only percent pollution tolerant diatoms with land use variables. The significant positive correlation of all the water chemistry variables with agriculture land use represents more human induced activities, whereas water temperature did not correlate significantly with any of the variables. This may be due to varying depth and different water regimes (Taylor, 2004). As would be expected streams in catchments with intensive agriculture were characterized by increased concentrations of nutrients and ions, which is evident from the principal component analysis. Clear differences in community composition were seen in NMDS analysis, where diatom community from streams with agriculture land cover was clustered out separately, except one site. According to NMDS analysis, diatom communities were significantly different in streams with different catchment nature. Diatom community in the forested streams were dominated by endemic diatom flora (Gomphonema gandhii Karthick and Kociolek, G. difformum Karthick and Kociolek, G. diminutum Karthick and Kociolek and many unidentified species from genus Navicula), whereas the streams from agricultural dominated landscapes were dominated by cosmopolitan species (Gomphonema parvulum Kützing, Nitzschia palea (Kützing) W.Smith, Achnanthidium minutissima Kützing v. minutissima Kützing).
Conclusions
These results offer insight into our three objectives for this study: (1) all the three water quality regimes shows changes in water quality across seasons, (2) diatom species assemblages changes strongly in all the water quality regimes, due to seasonal water quality conditions, where physical forces are more significant over longer scales of study while eutrophication and regional landuse is moreover evident within climatic seasons, and (3) the species distribution across the sites followed the satellite-mode due to the specific ecological niches of the diatoms. This study also concludes that Western Ghats streams can be monitored during the post monsoon months for biomonitoring ventures and compared to other water monitoring programs. This study also hints that the diatom community in this region is rich with possible endemic taxa; hence considerable amount of importance has to be given for the taxonomy of the lesser-known species before starting the biomonitoring programs.
The analyses and results described here provide insights to the linkages between land use practices and water quality in the streams of CWG and the relative sensitivity of water quality variables to alterations in land use. Agricultural activities in stream catchments are closely linked to increasing nutrient and ionic concentrations. Water quality in the eastern leeward regions was most strongly influenced by agriculture land uses, whereas the western windward catchments were dominated by natural forests. The diatom indices and water chemistry variables relation clearly shows the impact of land use on stream ecosystem. Comparison of community structure for diatoms taken from sites with varying land uses using NMDS analysis reflected differences attributing to LULC. In conclusion, this study highlights the role of landscape and proximate factors in the regulation of diatom species assemblages. Understanding the relative importance of natural and anthropogenic variations on diatom species composition is essential for conservation of lesser known organisms like diatoms
It has been evident from our findings that the causes and sources of water pollution in the 5 River Basins are due to agricultural land use, anthropogenic activities and industrialization. The major occupation in the study area is agriculture, which is main source of increase in nitrates and ionic components in streams. Domestic and industrial sewage discharges in to rivers are responsible for the observed high concentration of electrical conductivity, total dissolved solids, total hardness and other ionic components. Proper treatment of effluent from the industrial processes to the acceptable levels and discouraging stagnation of water through small dams are the two major recommendations to minimize the river ecosystem damage in the central Western Ghats.
|
Dr. T.V. Ramachandra
Centre for Sustainable Technologies, Centre for infrastructure, Sustainable Transportation and Urban Planning (CiSTUP), Energy & Wetlands Research Group, Centre for Ecological Sciences, Indian Institute of Science, Bangalore – 560 012, INDIA.
E-mail : cestvr@ces.iisc.ac.in
Tel: 91-080-22933099/23600985,
Fax: 91-080-23601428/23600085
Web: http://ces.iisc.ac.in/energy
Subash Chandran M.DEnergy & Wetlands Research Group, Centre for Ecological Sciences, Indian Institute of Science, Bangalore – 560 012, INDIA.
E-mail: mds@ces.iisc.ac.in
Joshi N.V.Energy & Wetlands Research Group, Centre for Ecological Sciences, Indian Institute of Science, Bangalore – 560 012, INDIA.
E-mail: nvjoshi@ces.iisc.ac.in
Karthick B.
Energy & Wetlands Research Group, Centre for Ecological Sciences, Indian Institute of Science, Bangalore – 560 012, INDIA.
Sameer Ali
Energy & Wetlands Research Group, Centre for Ecological Sciences, Indian Institute of Science, Bangalore – 560 012, INDIA.
Vishnu D. Mukri
Energy & Wetlands Research Group, Centre for Ecological Sciences, Indian Institute of Science, Bangalore – 560 012, INDIA.
Citation:Ramachandra T.V., Subash Chandran M.D., Joshi N.V., Karthick B., Sameer Ali, Vishnu D. Mukri, 2012. Ecohydrology of Lotic Ecosystems of Uttara Kannada, Central Western Ghats , ENVIS Technical Report 40, Energy & Wetlands Research Group, CES, IISc, Bangalore, India.
| Contact Address : |
| |
Dr. T.V. Ramachandra
Energy & Wetlands Research Group,
Centre for Ecological Sciences, TE 15, New Biology Building, Third Floor, E Wing, [Near D Gate], Indian Institute of Science, Bangalore – 560 012, INDIA.
Tel : 91-80-22933099 / 22933503-extn 107
Fax : 91-80-23601428 / 23600085 / 23600683 [CES-TVR]
E-mail : cestvr@ces.iisc.ac.in, energy@ces.iisc.ac.in,
Web : http://wgbis.ces.iisc.ac.in/energy |
|