| Sahyadri Conservation Series - 53 |
ENVIS Technical Report: 100, April 2016 |
 |
Time-series MODIS NDVI based Vegetation Change Analysis with Land
Surface Temperature and Rainfall in Western Ghats, India
| 
|
The steps involved are listed below and shown in figure 2.
- Creation of base layers: Base layers like district boundary, district with taluk and village boundaries, road network, drainage network, mapping of water bodies, etc. were generated from SOI topographic maps of scale 1:250000 and 1:50000.
- Geo-referencing of MODIS NDVI data: MODIS NDVI data were geo-corrected with known ground control points (GCP’s), projected to Polyconic (latitude-longitude coordinate system) with Evrst 56 datum, and resampled to 250 m × 250 m grid cell, multilayer image stack followed by masking and cropping of the study area.
- Geo-referencing of MODIS LST data: MODIS LST data were geo-corrected with known GCP’s and projected to Polyconic system, Evrst 56 datum, followed by masking and cropping of the study area. These 1 km bands were resampled to 250 m using nearest neighbourhood technique to be consistent with MODIS NDVI bands.
- Computation of LST from MODIS LST bands: MODIS Land Surface Temperature/Emissivity (LST/E) data with 1 km spatial resolution with a data type of 16-bit unsigned integer were multiplied by a scale factor of 0.02 (http://lpdaac.usgs.gov/modis/dataproducts.asp#mod11). The corresponding temperatures for all data were converted to degree Celsius (°C).
- Generation of rainfall maps: Interpolation of rainfall data points were performed by krigging to obtain rainfall raster maps at 250 m spatial resolution so as to maintain consistency of spatial resolutions between datasets.
- NDVI thresholding: NDVI data were thresholded empirically with field data to segregate NDVI values into four LC classes – dense vegetation, agricultural/farmland/grassland, settlement/barren land/soil and water bodies through training data, boxplot, Google Earth and field knowledge.
- Validation of classified maps: The LC maps obtained by thresholding NDVI maps were validated using test data collected from ground and other sources discussed later.
- LC Change detection: LC change detection was performed by comparing the LC area per class during 10 years.
- Seasonal pattern/trend analysis: NDVI, LST and rainfall data of vegetation class (forest and agricultural) were analysed to understand their variations in different seasons (summer, monsoon and winter) during 10 years.
- Statistical analysis: Relationship between time-series NDVI, LST and rainfall data were analysed using statistical methods.
- Trend analysis and modelling: The rainfall patterns in forest and agriculture/grassland areas were modelled and forecasted using autoregressive integrated moving average (ARIMA).
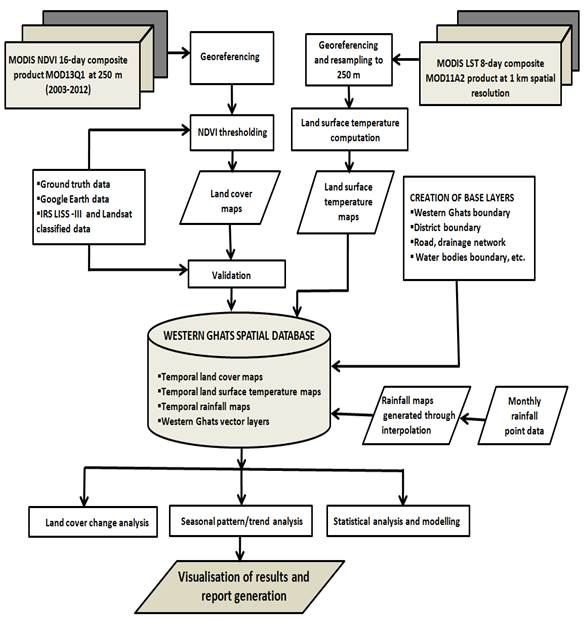
Figure 2: Flowchart of the overall method.
T.V. Ramachandra
Centre for Sustainable Technologies, Centre for infrastructure, Sustainable Transportation and Urban Planning (CiSTUP), Energy & Wetlands Research Group, Centre for Ecological Sciences, Indian Institute of Science, Bangalore – 560 012, INDIA.
E-mail : cestvr@ces.iisc.ac.in
Tel:91-080-22933099/23600985,
Fax:91-080-23601428/23600085
Web: http://ces.iisc.ac.in/energy
Uttam Kumar
Energy and Wetlands Research Group, Centre for Ecological Sciences. Indian Institute of Science, Bangalore – 560 012, India
E-mail: uttam@ces.iisc.ac.in
Anindita Dasgupta
Energy and Wetlands Research Group, Centre for Ecological Sciences. Indian Institute of Science, Bangalore – 560 012, India
Bharath Setturu Energy and Wetlands Research Group, Centre for Ecological Sciences. Indian Institute of Science, Bangalore – 560 012, India
E-mail: settur@ces.iisc.ac.in
Vinay S Energy and Wetlands Research Group, Centre for Ecological Sciences. Indian Institute of Science, Bangalore – 560 012, India
E-mail: vinay@ces.iisc.ac.in
Harish R Bhat Energy and Wetlands Research Group, Centre for Ecological Sciences. Indian Institute of Science, Bangalore – 560 012, India
E-mail: harishrbhat@ces.iisc.ac.in
Citation: Ramachandra T V, Uttam Kumar and Anindita Dasgupta, 2016, Time-series MODIS NDVI based Vegetation Change Analysis with Land Surface Temperature and Rainfall in Western Ghats, India, ENVIS Technical Report 100, Sahyadri Conservation Series 53, Energy & Wetlands Research Group, CES, Indian Institute of Science, Bangalore 560012.
|