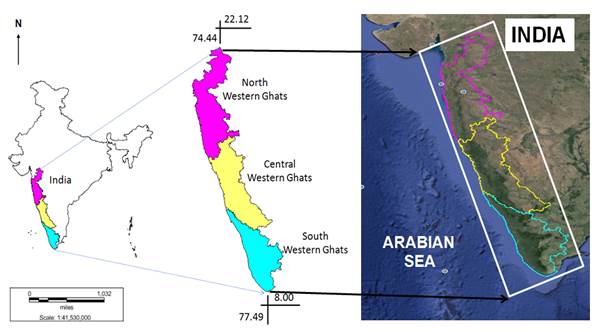
The research was conducted over 160,000 km2 of Western Ghats of the Indian peninsula (figure 1). The rugged range of hills stretching for about 1600 km along the west coast from south of Gujarat state to the end of the peninsula (8-21° N and 73-78° E), is interrupted only by a 30 km break in Kerala, the Palghat Gap (Radhakrishna, 2001) in India. The hill ranges of the Western Ghats extend along the west coast of India from river Tapti in the north to the southern tip of India. Western Ghats have an average height of 900 m amsl with several cliffs rising over 1000 m. The Nilgiri Plateau to the north and Anamalais to the south of the Palghat Gap exceed 2000 m in many places. Towards the eastern side, the Ghats merge with the Deccan Plateau which gradually slopes towards the Bay of Bengal. Their positioning makes Western Ghats biologically rich and biogeographically unique – a veritable treasure house of biodiversity. Hundreds of rivers originate from several mountains and run their westward courses towards the Arabian Sea. Only three major rivers, joined by many of their tributaries flow eastward, longer distances, towards the Bay of Bengal (Dikshit, 2001; Radhakrishna, 2001). The Western Ghat’s rivers are very critical resources for peninsular India’s drinking water, irrigation and electricity (Chandran et al., 2010). The study area includes 3 diverse eco-regions or climatic zone types as shown in figure 1. The complex geography, wide variations in annual rainfall from 1000–6000 mm, and altitudinal decrease in temperature coupled with anthropogenic factors have produced a variety of vegetation types in the Western Ghats. Tropical evergreen forest is the natural climax vegetation of western slopes, which intercept the south-west monsoon winds. Towards the rain-shadow region, eastwards vegetation changes rapidly from semi-evergreen to moist deciduous and dry deciduous kinds, the last one being characteristic of the semi-arid Deccan region as well. All these types of natural vegetation degrade rapidly in places of high human impact in the form of tree felling, fire and pastoralism, producing scrub, savanna and grassland. Lower temperature, especially in altitudes exceeding 1500 m, has produced a unique mosaic of montane ‘shola’ evergreen forests alternating with rolling grasslands, mainly in the Nilgiris and the Anamalais (Pascal, 1988).  Figure 1: Western Ghats, India including major ecological regions (northern, central and southern Western Ghats).
MODIS is a key instrument aboard the Terra and Aqua satellites, which view the entire Earth’s surface every 1–2 days and acquire data in 36 discrete spectral bands ranging in wavelengths from 0.4 mm to 14.4 mm. These data have improved our understanding of global dynamics and processes occurring on land, oceans, and in the lower atmosphere (Ren et al., 2008). MODIS have the advantage of higher spatial and spectral resolutions compared to NOAA (National Oceanic and Atmospheric Administration)/AVHRR, and higher spectral and temporal resolution compared to SPOT (systeme probatoire d’observation de la terre) or TM (Thematic Mapper) multi-spectral data. Since MODIS data are acquired in narrow spectrum, the impact of water vapor absorption in the NIR band is minimized, the red band data is more sensitive to chlorophyll, and therefore the quality of NDVI data is better (Gitelson et al., 1997; Huete et al., 2002; Kaufman and Tanre´, 1996; van Leeuwen et al., 1999). Therefore, MODIS NDVI has been extensively used in crop mapping (Xiao et al., 2005), vegetation phenology (Beck et al., 2006), vegetation classification (Wardlow et al., 2007), and land use/land cover change (Lunetta et al., 2006), etc. Spatial analyses were carried out in Linux based free and open source software GRASS – Geographic Resources Analysis Support System) (http://wgbis.ces.iisc.ac.in/grass) and R statistical package (http://www.r-project.org).
T.V. Ramachandra
Centre for Sustainable Technologies, Centre for infrastructure, Sustainable Transportation and Urban Planning (CiSTUP), Energy & Wetlands Research Group, Centre for Ecological Sciences, Indian Institute of Science, Bangalore – 560 012, INDIA. E-mail : cestvr@ces.iisc.ac.in Tel:91-080-22933099/23600985, Fax:91-080-23601428/23600085 Web: http://ces.iisc.ac.in/energy
Uttam Kumar
Energy and Wetlands Research Group, Centre for Ecological Sciences. Indian Institute of Science, Bangalore – 560 012, India E-mail: uttam@ces.iisc.ac.in
Anindita Dasgupta
Energy and Wetlands Research Group, Centre for Ecological Sciences. Indian Institute of Science, Bangalore – 560 012, India
Bharath Setturu
Energy and Wetlands Research Group, Centre for Ecological Sciences. Indian Institute of Science, Bangalore – 560 012, India E-mail: settur@ces.iisc.ac.in
Vinay S
Energy and Wetlands Research Group, Centre for Ecological Sciences. Indian Institute of Science, Bangalore – 560 012, India E-mail: vinay@ces.iisc.ac.in
Harish R Bhat
Energy and Wetlands Research Group, Centre for Ecological Sciences. Indian Institute of Science, Bangalore – 560 012, India E-mail: harishrbhat@ces.iisc.ac.in
Citation: Ramachandra T V, Uttam Kumar and Anindita Dasgupta, 2016, Time-series MODIS NDVI based Vegetation Change Analysis with Land Surface Temperature and Rainfall in Western Ghats, India, ENVIS Technical Report 100, Sahyadri Conservation Series 53, Energy & Wetlands Research Group, CES, Indian Institute of Science, Bangalore 560012.
| |||||||||||||||||||||||||||||||||||||

