 |
Cellular automata and Genetic Algorithms based urban growth visualization for appropriate land use policies |
 |
1Energy and Wetlands Research Group, Centre for Ecological Sciences [CES],
2Centre for Sustainable Technologies, 3Department of Management Studies, 4Centre for infrastructure, Sustainable Transport and Urban Planning,
Indian Institute of Science, Bangalore – 560012, India.
*Corresponding author: cestvr@ces.iisc.ac.in
|
Results
Simulation and prediction urban modeling results, as shown in table 2 and figure 6 shows a less close match to the reality from 1973 to 1992 in terms of urban count, however, the pattern matches in various directions to some extent.
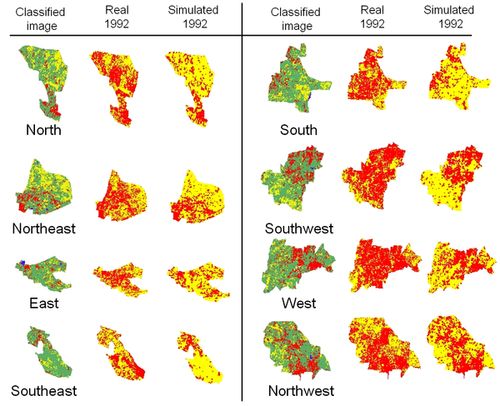
Figure 6: Classified image of 1973, real image and simulated image of 1992. Red colour indicates urban areas, yellow represents other classes (vegetation, water or open land) in real and simulated images.
Table 2: Numerical evaluation results
| Direction |
1973 Simulation / 1992 Prediction |
1992 Simulation / 2006 Prediction |
| |
Fitness % |
Total Error, ∆E% |
f |
Fitness % |
Total Error, ∆E% |
f |
| North |
52.58 |
32.39 |
79.82 |
101.71 |
30.82 |
32.53 |
| Northeast |
66.43 |
30.48 |
64.05 |
101.66 |
35.44 |
37.10 |
| East |
65.51 |
39.82 |
74.31 |
99.87 |
40.68 |
40.81 |
| Southeast |
42.28 |
29.72 |
87.44 |
99.89 |
36.86 |
36.97 |
| South |
46.39 |
33.33 |
86.93 |
105.36 |
29.18 |
34.54 |
| Southwest |
58.55 |
16.71 |
58.16 |
100.58 |
23.24 |
23.81 |
| West |
61.35 |
17.22 |
55.87 |
100.80 |
21.15 |
21.96 |
| Northwest |
86.13 |
33.08 |
46.95 |
102.90 |
36.08 |
38.98 |
| Average |
59.90 |
29.09 |
69.19 |
101.60 |
31.68 |
33.33 |
The reason for the mismatch of the urban pixels is that the growth from 1973 to 1992 has happened haphazardly which has not been reflected and captured by the change in population density of various wards in different directions. In contrast the simulated images of 2006 (figure 7) are more close to the real classified image in terms of the urban count.
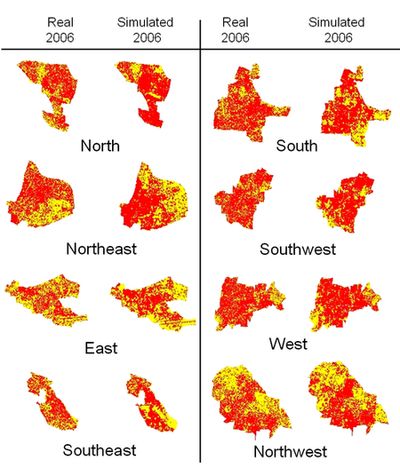
Figure 7: Real image and simulated image of 2006. Red colour indicates urban areas, yellow represents other classes (vegetation, water or open land).
|
|
Citation : Uttam Kumar, Chiranjit Mukhopadhyay and Ramachandra T. V., (2009), Cellular automata and Genetic Algorithms based urban growth visualization for appropriate land use policies, Proceedings of the Fourth Annual International Conference on Public Policy and Management, Centre for Public Policy, Indian Institute of Management (IIMB), Bangalore, India, 9-12 August, 2009.
|