|
Study area and Data
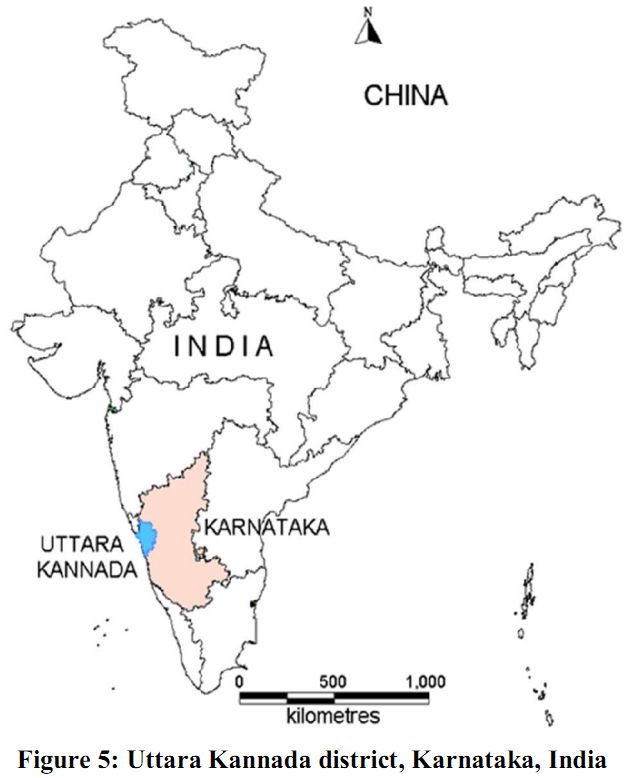
The Uttara Kannada district lies 74°9' to 75°10' east longitude and 13°55' to 15°31' north latitude, extending over an area of 10, 291 km2 in the mid-western part of Karnataka state (Fig. 5). It accounts for 5.37 % of the total area of the state with a population above 1.2 million46. This region has gentle undulating hills, rising steeply from a narrow coastal strip bordering the Arabian Sea to a plateau at an altitude of 500 m with occasional hills rising above 600–860 m. This district with 11 taluks, can be broadly categorised into three distinct regions –– coastal lands (Karwar, Ankola, Kumta, Honnavar and Bhatkal taluks), mostly forested Sahyadrian interior (Supa, Yellapur, Sirsi and Siddapur taluks) and the eastern margin where the table land begins (Haliyal, Yellapur and Mundgod taluks). Climatic conditions range from arid to humid due to physiographic conditions ranging from plains, mountains to coast.
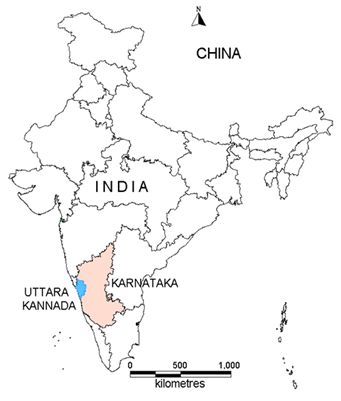
Figure 5: Uttara Kannada district, Karnataka, India
Survey of India (SOI) topo sheets of 1:50000 and 1:250000 scales were used to generate base layers – district and taluk boundaries, water bodies, drainage network etc. Field data were collected with a handheld GPS. Environmental data such as precipitation (rainfall) of wettest month and precipitation in the wettest quarter were downloaded from World Clim – Global Climate Data [http://www.worldclim.org/bioclim].
Other environmental layers used in the model were obtained from USGS Earth Resources Observation and Science (EROS) Center based Hydro1Kdatabase - http://eros.usgs.gov/#/Find_Data/Products_and_Data_Available/ gtopo30/hydro/asia] which are as follows:
- Aspect describes the direction of maximum rate of change in the elevations or the slope direction. It is measured in positive integer degrees from 0 to 360, clockwise from north. Aspects of cells (pixels) of zero slope (flat areas) are assigned values of -1.
- DEM is a digital representation of ground surface topography or terrain represented as a raster (a grid of squares) or as a triangular irregular network. DEMs are commonly built using remote sensing techniques or from land surveying.
- Flow accumulation (FA) defines the number of pixels which flow into each downslope pixel. Since the pixel size of the HYDRO1k data set is 1 km, the flow accumulation value translates directly into upstream drainage areas in square kilometers. Values range from 0 at topographic highs to very large numbers (on the order of millions of square kilometers) at the mouths of large rivers.
- Flow direction (FD) defines the direction of flow from each cell to its steepest down-slope neighbor derived from the hydrologically correct DEM. Values of flow direction vary from 1 to 255.
- Slope describes the maximum change in the elevations between each pixel and its eight neighbors expressed in integer degrees of slope between 0 and 90.
- Compound Topographic Index (CTI) commonly referred to as the Wetness Index, is a function of the upstream contributing area and the slope of the landscape. It is calculated using the flow accumulation (FA) layer along with the slope as:
 (9) (9)
In areas of no slope, a CTI value is obtained by substituting a slope of 0.001. This value is smaller than the smallest slope obtainable from a 1000 m data set with a 1 m vertical resolution.
The global land cover change maps were obtained from Global Land Cover Facility, Land Cover Change http://glcf.umiacs.umd.edu/services/landcoverchange/landcover.shtml; or http://www.landcover.org/services/land coverchange/landcover.shtml]. The spatial resolution of all the data were 1 km. Google Earth data (http://earth.google.com) served in pre and post classification process and validation of the results. 125 landslide occurrence points of low, medium and high intensity were recorded using GPS from the field and published reports.
|