| Sahyadri Conservation Series - 7 |
ENVIS Technical Report: 28, February 2012 |
 |
Landslide Susceptible Zone Mapping in Uttara Kannada, Central Western Ghats |
 |
Energy and Wetlands Research Group, Centre for Ecological Sciences,
Indian Institute of Science, Bangalore – 560012, India.
*Corresponding author: cestvr@ces.iisc.ac.in
LANDSLIDE HAZARD MAPPING OF AGHNASHINI RIVER CATCHMENT, CENTRAL WESTERN GHATS, INDIA
ABSTRACT
Landslides are encountered during the monsoon season in the undulating terrains of the Western Ghats. These cause geomorphic makeovers of the earth's surface resulting in significant damage to life and property. An attempt is made in this paper to identify landslide susceptibility regions in the Aghnashini river catchment of Uttara Kannada district of Karnataka, India using the frequency ratio method based on field investigations during 2007-2008. In this regard, base layers of spatial data such as topography, land cover, geology and soil were considered. Factors that influence landslides were extracted from the spatial database. This was supplemented by the field investigations of landslides. The frequency ratio which is the ratio of probability of occurrence to probability of non-occurrence, for specific attributes. Landslide susceptibility indices were computed and grouped into five classes. A landslide susceptibility map generated for the Aghnashini river catchment would be useful for the Government and other development agencies to implement appropriate mitigation measures to reduce hazards.
INTRODUCTION
The movement of a mass of rocks, debris, or earth down a slope resulting in geomorphic makeover of earth’s surface which contributes to erosion and landscape evolution is often referred as a landslide [1, 2]. Landslides could be due to the temporal conjunction of several factors [3-5], like:
- Quasi-static variables, which contribute to landslide susceptibility, such as geology, slope characteristics (gradient, slope aspect, elevation, etc.), geotechnical properties, long-term drainage patterns, etc.
- Dynamic variables, which tend to trigger landslides, such as rainfall and earthquakes. Depending on quasi static and triggering factors, landslides vary in composition as well as in the rate of movement (0.5x10⁻⁶ to 5x103 mm/sec) [6]. Landslides in vulnerable zones in India have lead to large scale loss of life and property [7].
In this context, identification, mapping and monitoring of landslide susceptible pockets would help in the mitigation of landslides as well as in rehabilitation of victims. These vulnerable pockets can be identified by both direct and indirect techniques based on the significance of causative factors in inducing instability. The assumption that is generally made in identifying landslide hazard susceptibility (LHS) regions [8, 9] is that occurrence of landslides follows past history in the region depending on geological, geomorphological, hydrogeological and climatic conditions. Identification of LHS involves dividing the region into zones depending on degrees of stability, significance of causative factors inducing instability, etc. Identification and mapping of LHS zones aids in delineating unstable hazard-prone areas which help planners choose favourable locations for siting development projects. It also assists in putting into place environmental mitigation measures. Even if the hazardous areas cannot be avoided altogether, their recognition in the initial stages of planning will help to adopt suitable precautionary remedial measures.
Identification of LHS and Mapping: Quasistatic variables and dynamic variables are considered for the likelihood frequency ratio (LRM) model in modelling landslides by various authors. In this regard slope, aspect, curvature, soil texture, soil drainage, soil effective thickness, timber age, timber diameter, distance from drainage, distance from roads, distance from faults, distance from lineaments, parallelism between the fractures, landslide scarps, lithology, geological structure of foliation, geomorphology, normalized difference vegetation index (NDVI) and land use are some of the parameters used by several authors[10-19]. Even a dynamic variable like rainfall is considered in the analysis. The objective of the study is identification and mapping of landslide prone zones of Aghnashini River catchment using frequency ratio analysis. The Aghnashini River is situated in the Central Western Ghats. Due to undulating terrain coupled with high intensity rainfall, the ghats are prone to landslides causing significant damage to property and agriculture. Most of the episodes are triggered by rainfall with the changes in land cover. Effort is made in this paper to identify landslide susceptible regions of Aghnashini river catchment
STUDY AREA
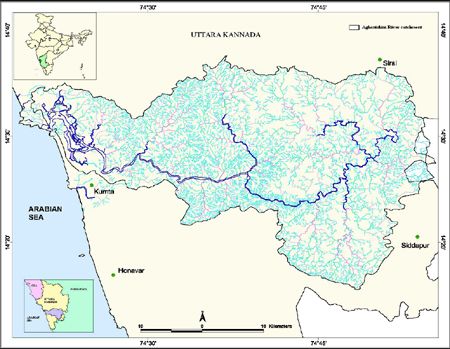
Figure1: Aghnashini River catchment, Central Western Ghats
The Aghnashini River catchment (74.32°-74.92° E and 14.26°-14.62° N) is one of the important west flowing rivers of central Western Ghats, India (Fig 1). This river catchment is of the Uttara Kannada District is neither disturbed by major projects or industries nor does it have a major town in the catchment. The catchment area is about 2985km² (due to lack of data 18.25 km² of catchment which\ falls in Havery district has been excluded). The Aghnashini river catchment with elevation varying from zero meters at sea level to 784 m at the Ghats has an average altitude of 396 m. The soil texture is mainly clayey, gravelly clayey which comprises of 85% of the catchment. The region is made up of laterite, migmatites and granodiorite, pink granite, metabasalt, greywacke, alluvium, and quartz chlorite schist with orthoquartzite spread across the study area. Annual rainfall in the region varies from 3581±687 mm (Kumta), 2450±485 mm (Sirsi) and 2969±704 mm (Siddapur) (all the three rain gauge stations are just outside the catchment). Field investigations were carried out in the region during post monsoon months of 2007 and 2008 with 237 and 53 landslide locations being located respectively of the total number of landslides 83% were due to road cutting.
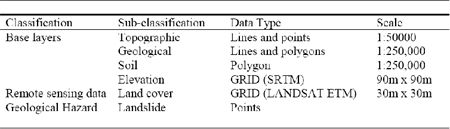
Table 1:Spatial data Work Flow/ Methodology
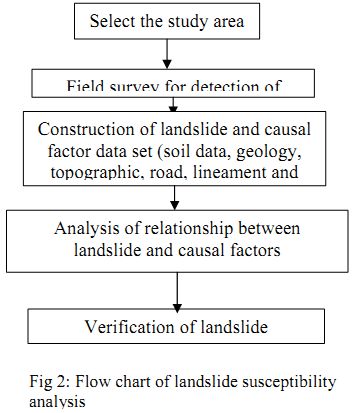
Creation of base layers of spatial data – soil, geology, topography, geo-morphology, land use, etc. This information was collected from the respective government agencies and supplemented with the remote sensing data. Landsat, ETM (Enhanced Thematic Mapper) data of spatial resolution 30 m of bands 2, 3, 4 and 5 (corresponding to Green, Red, Infra Red and Near Infra Red bands of the electromagnetic spectrum) were used for land use and land cover (NDVI) analysis. Road networks with administrative boundaries were digitised from Survey of India (SOI) topographic maps (1:50,000 scale). Soil types and spatial extents were digitised from the soil map of the National Bureau of Soil Sampling and land use planning (NBSS& LUP) of 1:250,000 scale. From this, texture, depth and permeability were derived. Spatial data with type are listed in Table 1.Geomorphological variables such as lithology, lineament, and rock type were extracted from geological and structural maps of the Geological Survey of India (1:250,000 scale). Shuttle radar topographic mapping (SRTM 3 arc-sec) of 90 m resolution was used to derive layers of analysis slope, aspect and toposhapes. This constitutes predisposing factors for the landslide activity. Slope was classified into 10 classes. Aspect represents the angle between the geographic north and a horizontal plain for a certain point. This was classified in nine orientations (flat, N, NE, E, SE, S, SW, W and NW). The topographic features control the superficial and subsurface hydrological regime of the slope and the classes considered are peak, ridge, saddle, ravine, pit, convex hillside, saddle hillside, slope hillside, inflection hillside, concave hillside and unknown hillside which were directly derived from the digital elevation model (DEM). The distance from lineaments and road was calculated by buffering at 90 m intervals.
Development of Spatial Database: Considering the spatial resolution of the data available, all data layers were resampled to 90 m and total number of cells was 165042. Landslides corresponding to 237 and 53 occurrences in 2007 and 2008 respectively were used for computing LSI as well as for sensitivity analysis. Frequency ratio: Frequency ratio is the ratio of occurrence probability to non-occurrence probability for specific attributes. In the case of landslides; if landslide occurrence event is set to B and the specific factor’s attribute to D, the frequency ratio for D is a ratio of conditional probability. If the ratio is greater than 1, greater is the relationship between a landslide and the specific factor’s attribute; and if the ratio is less than 1, the lesser will be the relationship between a landslide and the specific factor’s attribute. Computation of Landslide Susceptibility Index (LSI): Landslide Susceptibility Index (LSI) is the summation of each factor’s frequency ratio values as in equation 1. Landslide susceptibility value represents the relative hazard to landslide occurrence, as higher values are associated with landslide hazards.
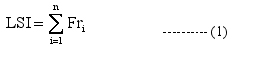
(where, LSI: Landslide Susceptibility Index; Fr: rating of each factor’s type or range). The landslide hazard map was made using the LSI values.
RESULTS AND DISCUSSION
Frequency ratios computed for related factors are listed in equation 1. With high intensity rainfall, slope in the range above 45º with concave and ridge hillside, south–west, north-west, and south-east aspect, and geological aspects such as metamorphic rocks (greywacke / argillite and metabasalt) or Volcanic / Meta volcanic are highly susceptible to landslides. Gravely clay soil with moderate erosion, moderately deep, and well drained has high susceptibility. LSI values computed were classified into five classes (Very high, High, Moderate, Low and Least) based on the degree of vulnerability. These are listed in Table 2 and LHS map is given in Figure 3. Higher values (16.95 % of study area) of LSI indicate higher probability of landslide occurrences (which coincide with the field data of latest occurrences). Validation of LHS map showed an accuracy of 11% and 47% of the 53 regions tallied with the field data of highly vulnerable landslides.
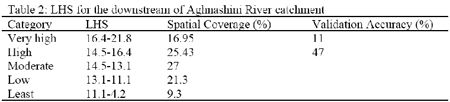
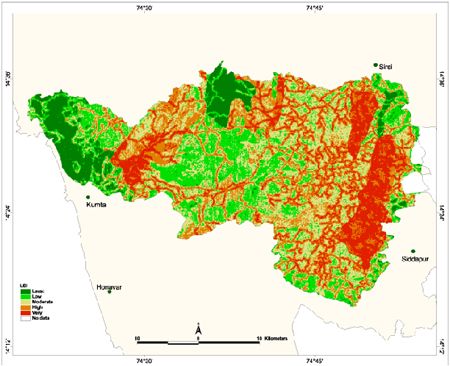
Figure 3: LHS Map of Aghnashini River catchment
REFERENCES
- Cruden, D.M., 1991. A Simple Definition of a Landslide. Bulletin of the International Association of Engineering Geology, No. 43, pp. 27-29
- Guzzetti F (2005), Probabilistic landslide hazard assessment at the basin, doi:10.1016/j.geomorph.2005.06.002
- Atkinson, P.M., Massari, R., 1998. Generalized linear modelling of landslide susceptibility in the central Apennines, Italy. Computers & Geosciences 24, 373– 385.
- Dai, F.C., Lee, C.F., 2001. Terrain-based mapping of landslide susceptibility using a geographical information system: a case study. Canadian Geotechnical Journal 38, 911 – 923
- Wu, W., Sidle, R.C., 1995. A distributed slope stability model for steep forested basins. Water Resources Research 31, 2097– 2110.
- International Union of Geological Sciences Working Group on Landslides, 1995, A suggested method for describing the rate of movement of a landslide, Bulletin of the International Association of Engineering Geology, 52, 75-78.
- International Federation of the Red Cross and Red Crescent Societies, I. (2001). World disasters report 2001.
- Hutchinson JN (1995) Landslide hazard assessment. In: Proc VI Int Symp on Landslides, Christchurch, 1: 1805–1842
- Varnes DJ, IAEG Commission on Landslides (1984) Landslide hazard zonation – a review of principles and practice. UNESCO, Paris, 63.
- Akgun A, Serhat Dag S, and Bulut F (2007) Landslide susceptibility mapping for a landslide prone area (Findikli, NE of Turkey) by likelihood-frequency ratio and weighted linear combination models. Environ Geol. doi:10.1007/s00254-007-0882-8
- Clerici A, Perego S, Tellini C, Vescovi P (2002) A procedure for landslide susceptibility zonation by the conditional analysis method. Geomorphology 48:349–364.
- Donati L, Turrini MC (2002) An objective method to rank the importance of the factors predisposing to landslides with the GIS methodology: application to an area of the Apennines (Valnerina; Perugia, Italy). Eng Geol 63:277–289.
- Lee S, Min K (2001) Statistical analysis of landslide susceptibility at Yongin, Korea. Environ Geol 40:1095–1113
- Lee S, Chwae U, Min K (2002) Landslide susceptibility mapping by correlation between topography and geological structure: the Janghung area, Korea. Geomorphology 46:49– 162
- Lee S, Choi U (2003) Development of GIS based geological hazard information system and its application for landslide analysis in Korea. Geosci J 7:243–252.
- Lee S, Pradhan B (2007) Landslide hazard mapping at Selangor, Malaysias using frequency ratio and logistic regression models. Landslides 4(1):33–41
- Lee S, Talib JA. 2005. Probabilistic landslide susceptibility and factor effect analysis. Environmental Geology 47: 982–990.
- Zezere JL, Reis E, Garcia R, Oliveira S, Rodrigues ML, Vieira G, Ferreira AB (2004) Integration of spatial and temporal data for the definition of different landslide hazard scenarios in the area north of Lisbon (Portugal). Natural Haz Earth Sys Sciences 4:133– 146
- Vijith H., Madhu G., (2007), Estimating potential landslide sites of an upland subwatershed in Western Ghat’s of Kerala (India) through frequency ratio and GIS, Environ Geol.doi:10.1007/s00254-007-1090-2.
|
|