|
RESULTS AND DISCUSSIONS
A. Land use: Land use analysis was carried out for the year 2008, 2010, and 2012 using the Gaussian maximum likelihood classifier. Fig. 3 depicts land use and categorywise changes are listed in Table II. This illustrate an increase in urban area by about 2 folds i.e., from 24.86 % (in 2008) to 48.39% (2012) with the decline of vegetation from 38.34% to 26.40% and other category from 36.26% to 26.85% respectively, indicating a rapid urbanisation process.
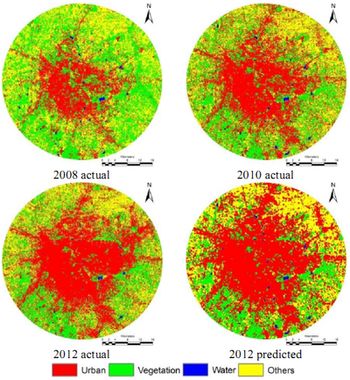
Fig.3. Time series land use maps between 2008 and 2012
Table II: Land use statistics
| Year |
2008 |
| Land use |
Area in hectares |
Percent |
| Urban |
49,958.91 |
24.86 |
| Vegetation |
77,042.07 |
38.34 |
| Water |
1069.20 |
0.53 |
| Others |
72,852.48 |
36.26 |
| Year |
2010 |
| Land use |
Area in hectares |
Percent |
| Urban |
85,012.20 |
42.30 |
| Vegetation |
57,148.47 |
28.44 |
| Water |
1271.43 |
0.63 |
| Others |
57,524.58 |
28.63 |
| Year |
2012 |
| Land use |
Area in hectares |
Percent |
| Urban |
97,531.11 |
48.66 |
| Vegetation |
49,175.64 |
24.40 |
| Water |
723.60 |
0.63 |
| Others |
54,115.02 |
26.85 |
| Year |
2012 - Predicted |
| Land use |
Area in hectares |
Percent |
| Urban |
107,754.48 |
51.62 |
| Vegetation |
44,287.92 |
23.04 |
| Water |
1491.21 |
0.74 |
| Others |
47,423.07 |
21.60 |
B. Accuracy Assessment: Accuracy assessment of the classified information of land use was performed by generating the reference image through the traing data (30% of the ground truth data). Overall accuracy and Kappa was calculated using the module r.kappa in GRASS. The results of accuracy assessment are as shown in Table III.
Table III: Accuracy Assessment
| Year |
Overall accuracy % |
Kappa |
| 2008 |
86.35 |
0.78 |
| 2010 |
91.62 |
0.86 |
| 2012 |
90.43 |
0.85 |
C. Modeling and Prediction: Land use [LU] transitions were calculated to predict land use for the year 2012, using markov chain based on 2008 and 2010 LU and CA loop time of 2 years. With the knowledge of 2008 and 2012, LU for 2020 is predicted. CA filter (Fig.4) was used to generate spatially explicit contiguity weightage factor to change the state of the cell based on neighborhoods.This prediction has been done considering water bodies as constraint and assumed to remain constant over all time frames.
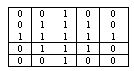
Fig.4. Filter designed for analysis
Table IV: Markov Transition Probabilities
|
Urban |
Vegetation |
Water |
Other |
| Urban |
0.8 |
0.0667 |
0.0667 |
0.0667 |
| Vegetation |
0.2443 |
0.4697 |
0.0047 |
0.2813 |
| Water |
0.3372 |
0 |
0.6628 |
0 |
| Other |
0.3476 |
0.2046 |
0.0018 |
0.446 |
The Multi criterion analysis was used to generate transition probability areas based on transition rules and constraints for 2010 and 2012 LU data. The transition probabilities from Markov and the transition areas from CA were used to predict land use for the year 2012 (Fig. 3). The model was scrutinized for allowable error by validating the predicted versus the actual 2012 land use (Fig. 3). The validation results (Table V) showed a very good agreement between the actual and predicted 2012 LU with kappa of 0.73.On similar lines, LU is simulated for 2020 (Fig.5). The simulated land use (Table VI, Fig.5) shows an increase in built up from 48.66 % (2012) to 70.64% (2020). The process of urbanization is observed to be high in the North East direction, near arterial roads and the national/state highways.
Table V: Validation between predicted and Actual 2012
Kno |
0.8443 |
Klocation |
0.8678 |
Kstandard |
0.8557 |
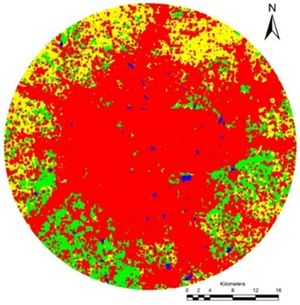
Fig.5. Predicted land use map for 2020
Table VI: Land use 2020
| Year |
2020 - Predicted |
| Land use |
Area in hectares |
Percent |
| Urban |
142,381.08 |
70.64 |
| Vegetation |
27,316.44 |
13.55 |
| Water |
1491.21 |
0.74 |
| Others |
30,356.64 |
15.07 |
D. Urbanisation pattern analysis through spatial metrics: Number of urban patches that gives us degree of fragmentation was calculated for the urban class. The results of the analysis showed the landscape was highly fragmented with 16000 patches in 2012 and by 2020 gets clumped to form an aggregated core connected (along highways) and some clumped developments at outskirts. This signifies the formation of an urban core (Fig. 6)with loss of all other land use (except water) and fragmentedurban patches.
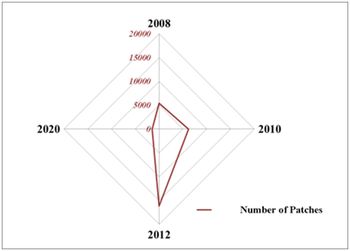
Fig. 6. Number of urban patches
Edge density and Percentage land adjacencies (Pladj) (Fig. 7) were also calculated. Edge is formed when the urban landscape in covered by other land uses. Edge density are significantly higher in 2012 due to fragmented urban landscape and in 2020, the edge density declines to 15 signifying the formation of homogenous urban landscape. Pladj metric accounts to percentage of adjacent landforms of same land use. This also implies that in 2020 the urban class becomes most adjacent dominating class with the loss of other classes.
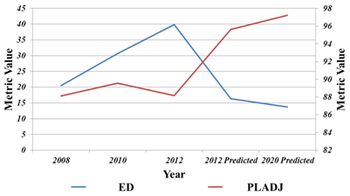
Fig. 7. Edge density and percentage of land adjacencies
Finally NLSI (Normalised landscape shape index) and clumpiness indices were calculated to understand the shape of the landscape and its form. NLSI shows increased value indicating a simple shape or clumped growth. While, in 2008 the lower value indicating convoluted shape, indicating heterogeneous or fragmented landscape with the presence of all land uses next to urban.
Clumpiness index show of clumped growth with the domination of urban land use in 2020, whereas in 2012 the region is with significantly higher proportion of other contributing land uses. Spatial metrics conform of clumped urban growth in Bangalore by 2020 with the loss of all other LU’s indicating an urban paved jungle. This necessitates integrated approaches in land use planning to minimize the damage on local ecology and hydrology due to decline of LU other than urban category. The visualized outcome for 2020 indicates the certain doomsday for the Bangalore city with the current lopsided approaches in urban planning. This will lead to further changes in the regional climate; enhance pollutants in air and water, increase of temperature, consequent thriving of disease vectors and loss of vital natural resources.
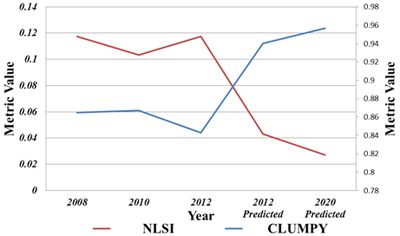
Fig. 8. Normalised Landscape Shape index and Clumpiness index
|
