|
METHOD
The process of urbanisation and sprawl in Bangalore (study area) have been assessed as outlined in Fig. 2, which includes (i) Land use analysis, (ii) Modeling and prediction, (iii) Urban Sprawl Analysis
Land use analysis:
The land use analysis was carried out for the 3 temporal data using the Gaussian maximum likelihood classifier. The data were classified under 4 different classes as shown in Table I.Satellite data classification involved (i) Preprocessing (ii) Classification (iii) Accuracy assessment.
Preprocessing: The raw satellite images geo-corrected, followed by radiometric correction and resampled to 30 m resolution to maintain uniformity for multi temporal data comparisons and for modeling.
Table I. Land use categories
| Land use class |
Land use included in class |
| Urban |
Residential Area, Industrial Area, Paved surfaces, mixed pixels with built-up area |
| Water |
Tanks, Lakes, Reservoirs, Drainages |
| Vegetation |
Forest, Plantations |
| Others |
Rocks, quarry pits, open ground at building sites, unpaved roads, Croplands, Nurseries, bare land |
Land use classification and accuracy assessment: The method involves i) generation of False Color Composite (FCC) of remote sensing data (bands – green, red and NIR). This helped in locating heterogeneous patches in the landscape ii) selection of training polygons covering 15% of the study area and uniformly distributed over the entire study area, iii) loading these training polygons co-ordinates into pre-calibrated GPS, vi) collection of the corresponding attribute data (land use types) for these polygons from the field, iv) Supplementing this information with Google Earth/Bhuvan.Land use classification was done using supervised pattern classifier - Gaussian maximum likelihood algorithm based on various classification decisions using probability and cost functions [40].
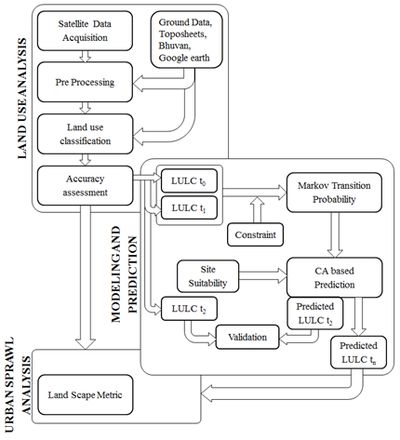
Fig .2. Procedure followed to model, understand the landscape changes
Land usesduring the different period were computed using the temporal remote sensing data through open source GIS: GRASS- Geographic Resource Analysis Support System (http://ces.iisc.ac.in/grass). Four major types of land use classes considered were built-up, vegetation, cultivation area (since major portion is under cultivation), and water body. 60% of the derived signatures (training polygons) were used for classification and the rest for validation. Statistical assessment of classifier performance based on the performance of spectral classification considering reference pixels is done which include computation of kappa (κ) statistics.
Modeling and Prediction:The land use pattern is evolving dynamically and follows the Markovain random process properties with various constrains that include average transfer state of land use structure stable and different land use classes may transform to other land use class given certain condition (Such as non-transition of urban class to water or vice versa). Thus Markov was used for deriving the land use change probability map for the study region and was applied using Markov module. The probability distribution map was developed through Markov process. A first-order Markov model based on probability distribution over next state of the current cell that is assumed to only depend on current state [41]. CA was used to obtain a spatial context and distribution map. CA’s transition rules use its current neighborhood of pixels to judge land use type in the future. State of each cell is affected by the states of its neighboring cells in the filter considered. Besides using CA transition rule and land use transition is governed by maximum probability transition and will follow the constraint of cell transition that happens only once to a particular land use, which will never be changed further during simulation. CA coupled with Markov chain was then used to predict urban land use state in 2020
Urban sprawl analysis:Post prediction and valdation with spatial metrics were employed to quantify the urban growth pattern. Spatial metrics aid in quantifying the land use pattern at a particular time [1][42]. Spatial metrics such as Number of urban patches (NP), Normalised landscape shape index (NLSI), edge density (ED), Clumpy, Pladj were used in the analysis.These selected metrics signify patch, contagion, edge, shape and adjacency.
|
