|
Results and Discussion
Supervised classification was performed using GMLC and was verified with field knowledge, visual interpretation and Google Earth data (http://googleearth.com). The supervised classified land use of temporal data is given in Figure 4 and class statistics in table 2. The percentage of urban has increased from 11.12 (1999) to 24.47 (2008) in the study region (Greater Bangalore with 10 km buffer). The Vegetation has decreased from 47.93 to 38.84%. Land use dynamics is illustrated in Figure 5, which highlight an increase in urban area with consequent decline of other natural resources - vegetation, water bodies, etc. during 1999 to 2008. An overall accuracy of 88%, 98%, 97%, 96% and 74% were obtained for the data of 1999, 2000, 2003, 2006 and 2008 by using the open source programs (i.gensig, i.class and i.maxlik) of Geographic Resources Analysis Support System (http://wgbis.ces.iisc.ac.in/ grass). Accuracy assessment is critical to understand the efficacy of classifiers with spatial data (Congalton and Green, 1999; Li et al, 2003; Lunetta and Lyon, 2004). The Overall accuracy of the classification and Kappa coefficient is listed in Table 3. The analyses substantiate that the percentage urban land is increasing in the all directions with respect to time.
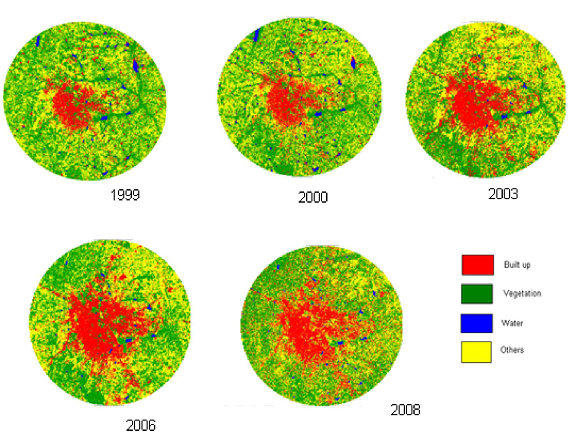
Figure 4: Temporal land use
Table 2: Land Use Statistics
 Year Year
 classes classes |
1999(Nov)
(%) |
2000(Nov)
(%) |
2003(Nov)
(%) |
2006(Dec)
(%) |
2008(Nov)
(%) |
| URBAN |
11.12 |
13.23 |
20.88 |
22.11 |
24.47 |
| VEGETATION |
47.93 |
44.56 |
38.74 |
38.58 |
38.84 |
| WATER |
1.25 |
1.63 |
0.45 |
0.64 |
1.04 |
| OTHERS |
39.69 |
40.58 |
39.93 |
38.66 |
38.66 |
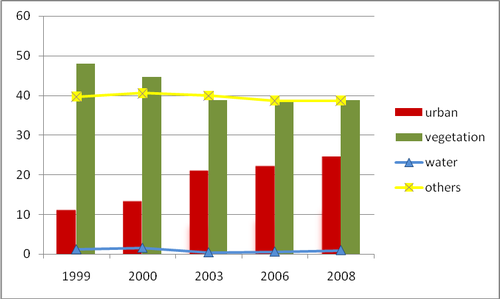
Figure 5: Land Use dynamics of Bangalore
Table: 3 Accuracy assessment of the classification
| YEAR |
1999 |
2000 |
2003 |
2006 |
2008 |
| Over All
Accuracy |
88.00% |
98.00% |
97.00% |
96.00% |
74.00% |
| Kappa
Coefficient |
0.72 |
0.97 |
0.96 |
0.94 |
0.61 |
Temporal analyses carried out earlier indicate the decline of 34.48% during 1973 to 1992, 56.90% during 1973-2002 and 70.69% of water bodies during 1973-2007 in the erstwhile Bangalore city limits (560 sq.km.). Similar analyses done for Greater Bangalore (i.e Bangalore city with surrounding 8 municipalities - spatial extent of 741 sq.km.) indicate the decline of 32.47% during 1973 to 1992, 53.76% during 1973-2002 and 63.43% during 1973-2008 (Ramachandra and Kumar, 2008). This is correlated with the increase in built up area from the concentrated growth model focusing on Bangalore, adopted by the state machinery, affecting severely open spaces and in particular water bodies.
Shannon’s entropy computed direction-wise for 8 zones with 13 concentric circles (n = 13), for Greater Bangalore with 10 km buffer is given in Table 4 for 1999 to 2008 (Figure 6). The entropy values ranges from 0.3701 (1999, NE) to 0.8955 (2008, SW) which is closer to log (n), i.e. 1.11, indicating the dispersed growth or sprawl. Number of patches (NP) in land-use a measure of the fragmentation under urban category is computed. Larger the NP more is the fragmentation in the landscape. Number of patches increased from the central business district (i.e. city centre) to periphery in all directions from 1999 to 2008. Large number of patches also reveal dispersed growth in the periphery - outer circles. City centre show compact growth in 2008 evident from the decline of number of patches in 2008 compared to earlier years and also compared to outer circles.
Table: 4 Shannon’s Entropy
|
NE |
SE |
SW |
NW |
| 1999 |
0.3701 |
0.3902 |
0.5335 |
0.4818 |
| 2000 |
0.4071 |
0.4532 |
0.6141 |
0.5284 |
| 2003 |
0.5821 |
0.6811 |
0.8915 |
0.7106 |
| 2006 |
0.6129 |
0.7277 |
0.8707 |
0.7057 |
| 2008 |
0.6483 |
0.8053 |
0.8955 |
0.8886 |
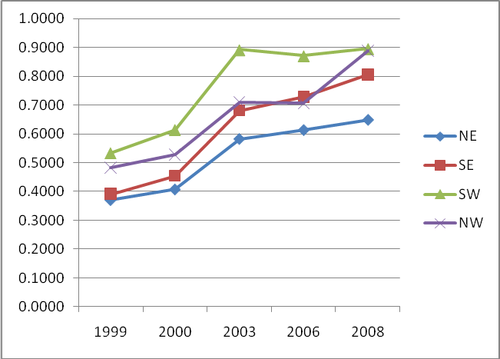
Figure 6: Direction-wise temporal Shannon Entropy
Class area (CA) is a measure of landscape composition; specifically, how much of the landscape is comprised of a particular patch type - built up area. Built up area (in hectares) has increased in all directions from 1999 to 2008. The mean proximity index (MPI) measures the degree of isolation and fragmentation of built-up patch and MPI >=0. MPI = 0 if built-up patches of have no neighbours of the same type within the specified search radius. MPI increases as patches of the corresponding patch type become less isolated and the patch type becomes less fragmented in distribution. MPI analysis indicates of increase at city centre in all directions from 1999 to 2008. However, there is no a significant increase at outskirts, which indicate that city centre has become more compact in 2008. Interspersion and juxtaposition index measures the extent to which built-up patches are interspersed and varies 0 < IJI <=100. Higher values result from landscapes in which built-up are well interspersed or equally adjacent to each other, whereas lower values (IJI=0) characterize landscapes with poorly interspersed built-up patches. IJI at city centre in 2008 in all 8 direction has lower values compared to outer circles, which indicates that city centre has become more compact in 2008. In NEE, SEE, NWW and NNW during 2003 IJI is max in outer circles (circle 9, 10, 11, 12, 13) which shows that sprawl is maximum in these direction in 2003 and urban patches become less interspersed from 2003 to 2008, evident from Figure 7 and is in conformance with NP, MPI and CA analysis.
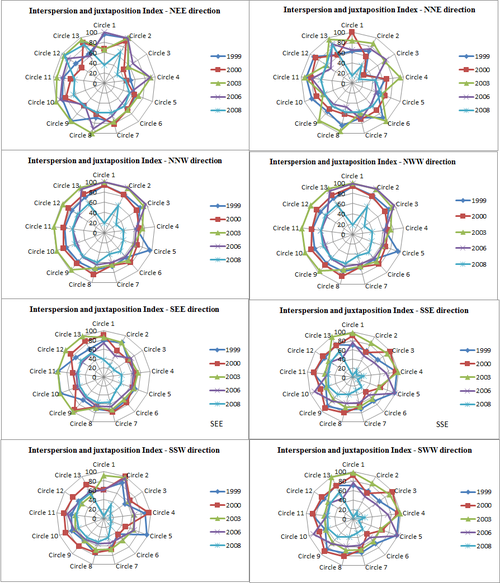
Figure 7: Interspersion and juxtaposition Index
Landscape shape index is a modified perimeter area ratio of the form that measures the shape complexity of the whole landscape. LSI=1 when the landscape consists of a single patch of the corresponding patch type and is circular (vector) or square (raster). LSI increases without limit as landscape shape becomes more irregular. LSI show an increasing trend during 1999 to 2008 in all direction and in all regions (circles). Nearest neighbor distance is defined as the distance from a built-up patch to the nearest neighboring patch of another built-up patch, based on edge-to-edge distance. Mean Nearest Neighbor measures average patch to patch distance. Less value of Mean nearest neighbor distance in landscape indicates that patches are less insular in the landscape. The nearest neighbor distance in urban patches decreases from 1999 to 2008 because of the industrial and residential growth in the study area.
Area weighted Euclidean mean Nearest Neighbor distance (ENN-AM) is a measure of the urban patch isolation. ENN-AM decreased from 1999 to 2008 in all the 8 direction, highlighting clustering of urban patches in 2008 as isolation of urban patches are less in the landscape. Mean patch size measures the average area of all patches in the landscape. MPS decreased from outer circles (at periphery) to interior in all 8 directions 1999 to 2008, given in Figure 8 highlighting the aggregation of patches due to compact growth at city centre while peripheral region is experiencing the sprawl. Shape index measures the complexity of patch shape compared to a standard shape. Mean shape index (MSI) measures the average patch shape, or the average perimeter-to-area ratio, for a particular patch type (class) or for all patches in the landscape. AWMSI of patches is calculated by weighting patches according to their size specifically larger patches are weighted more heavily than smaller patches. AWMSI ≥1 it increases as the patch shape become more irregular. Direction and year-wise AWMSI values show larger patches with irregular patch shape at city centre while at periphery urban patches are simple in structure.
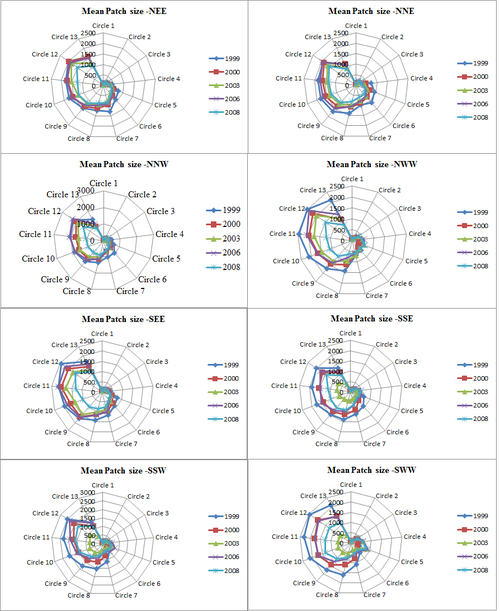
Figure 8: Mean Patch size
Mean Shape Index coefficient of variation (MSI-CV) shows the variability in patch shapes, which indicates higher values at the city centre in all the 8 direction from 1999 to 2008. Aggregation Index shows the level of aggregation in a region and is equal to 1 when the patches are maximally disaggregated and equals 100 when the patches are maximally aggregated into a single compact patch. Figure 9 shows the level of aggregation at city centre compact growth at city centre and a dispersed growth at outskirts, in conformity with the earlier indices: ENN-AM, MPS, AWMSI and MSI.
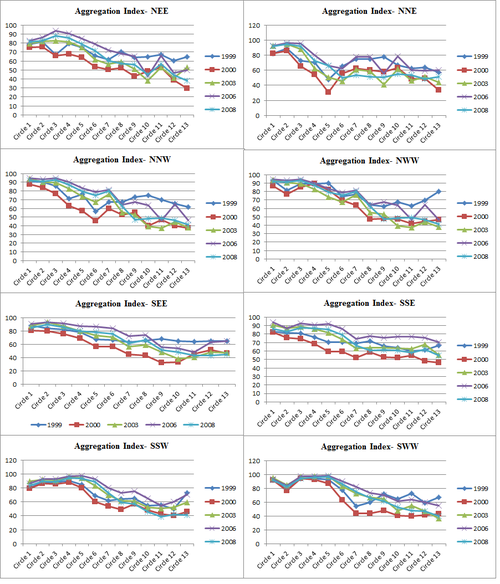
Figure 9: Aggregation Index
|
