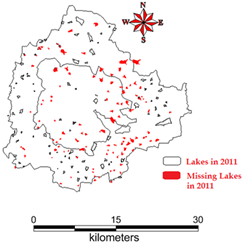
Objective: Mapping water bodies (Spatial extent and location) Knowledge required: We need to know (i) Map (ii) Mapping tools (iii)Details about a Map
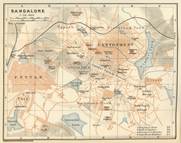
MAP: Is a diagrammatic representation usually on a flat surface of the whole or a part of the Earth surface showing various features like road, water bodies etc.
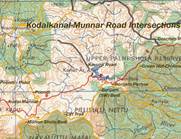
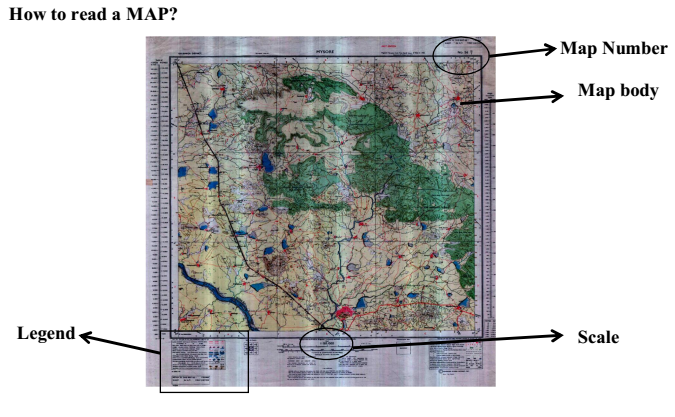
How to read a MAP?
Scale represents map unit on the ground. For example, scale of 1:250,000 means that 1 unit on the map corresponds to 250,000 units on ground.
Examples of Scales: 57/H/9/NE – 1:25000 map of North east area of Bangalore, 57/H/9 – 1:50000 Map of Bangalore, 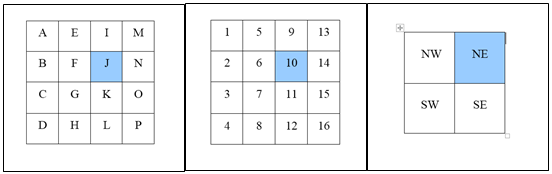
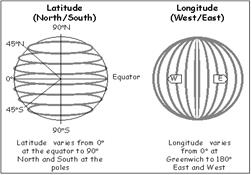
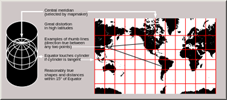
MAP Coordinate system: A coordinate system is a standardized method for assigning codes to locations so that locations can be found easily. Good example is Latitude (LAT) Longitude (long) system.
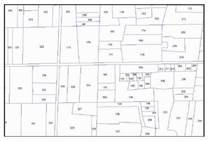
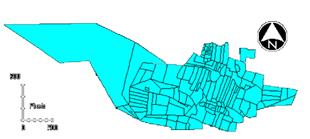
Spatial data: Data that represents the space is referred as spatial data. Two kinds of spatial data are (i) raster and (ii) vector. Both these are used in GIS (Geographic Information System) to store and retrieve geographical data.
Consider the example 96.31°, the whole units of degrees will remain the same (i.e. in 96.31°, longitude, start with 96°). Multiply the decimal by 60 (i.e. .31 * 60 = 18.6). The whole number becomes the minutes (18'). Take the remaining decimal and multiply by 60. (i.e. .6 * 60 = 36). The resulting number becomes the seconds (36"). Seconds can remain as a decimal. GPS NAME: ………………… Area surveyed…………………..
|
 Source: WIKI
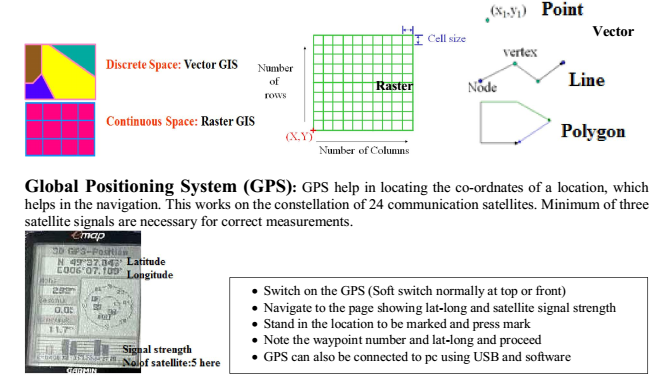
Centre for Sustainable Technologies,
Centre for infrastructure, Sustainable Transportation and Urban Planning (CiSTUP),
Energy & Wetlands Research Group, Centre for Ecological Sciences, Indian Institute of Science, Bangalore – 560 012, INDIA.
E-mail : cestvr@ces.iisc.ac.in
Tel: 91-080-22933099/23600985, Fax: 91-080-23601428/23600085
Web: http://ces.iisc.ac.in/energy
Energy & Wetlands Research Group, Centre for Ecological Sciences, Indian Institute of Science, Bangalore – 560 012, INDIA.
E-mail: asulabha@ces.iisc.ac.in
Energy & Wetlands Research Group, Centre for Ecological Sciences, Indian Institute of Science, Bangalore – 560 012, INDIA.
E-mail: bharath@ces.iisc.ac.in
Energy & Wetlands Research Group, Centre for Ecological Sciences, Indian Institute of Science, Bangalore – 560 012, INDIA.
E-mail: settur@ces.iisc.ac.in
Energy & Wetlands Research Group, Centre for Ecological Sciences, Indian Institute of Science, Bangalore – 560 012, INDIA.
E-mail: durgamadhab@ces.iisc.ac.in
Energy & Wetlands Research Group, Centre for Ecological Sciences, Indian Institute of Science, Bangalore – 560 012, INDIA.
E-mail: gouri@ces.iisc.ac.in
Energy & Wetlands Research Group, Centre for Ecological Sciences, Indian Institute of Science, Bangalore – 560 012, INDIA.
E-mail: harishrbhat@gmail.com
Energy & Wetlands Research Group, Centre for Ecological Sciences, Indian Institute of Science, Bangalore – 560 012, INDIA.
E-mail: sincy@ces.iisc.ac.in
Energy & Wetlands Research Group, Centre for Ecological Sciences, Indian Institute of Science, Bangalore – 560 012, INDIA.
E-mail: sudarshan@ces.iisc.ac.in
Energy & Wetlands Research Group, Centre for Ecological Sciences, Indian Institute of Science, Bangalore – 560 012, INDIA.
E-mail: vinay@ces.iisc.ac.in
| Contact Address : | |||
| Dr. T.V. Ramachandra Energy & Wetlands Research Group, Centre for Ecological Sciences, TE 15, New Biology Building, Third Floor, E Wing, [Near D Gate], Indian Institute of Science, Bangalore – 560 012, INDIA. Tel : 91-80-22933099 / 22933503-extn 107 Fax : 91-80-23601428 / 23600085 / 23600683 [CES-TVR] E-mail : cestvr@ces.iisc.ac.in, energy@ces.iisc.ac.in, Web : http://wgbis.ces.iisc.ac.in/energy |
|||