Results and Discussion
Soil pH
|
|
Agriculture
n=54 |
Barren
n=45 |
Deciduous
n=108 |
Evergreen
n=63 |
Teak
n=53 |
Areca
n=17 |
Min |
4.35 |
4.45 |
4.22 |
4.9 |
5.3 |
5.68 |
Max |
5.95 |
6.1 |
7.3 |
6.71 |
6.79 |
7.4 |
Avg.±
std dev. |
5.05±0.4 |
5.05±0.5 |
5.7±0.5 |
5.66±0.3 |
6.07±0.3 |
6.37±0.46 |
Pair wise Wilcox Test
|
Areca |
Agriculture |
Barren |
Deciduous |
Evergreen |
Agriculture |
S |
|
|
|
|
Barren |
S |
NS |
|
|
|
Deciduous |
S |
S |
S |
|
|
Evergreen |
S |
S |
S |
NS |
|
Teak |
S* |
S |
S |
S |
S |
*p<0.05, p<0.001, S=significant; NS=non-significant
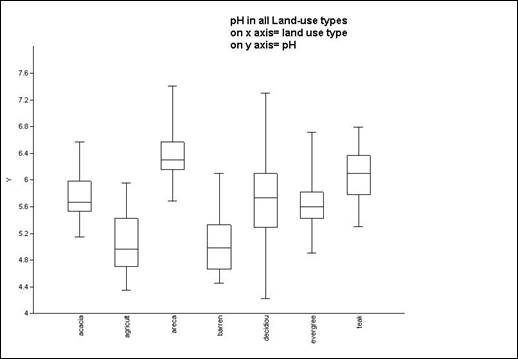
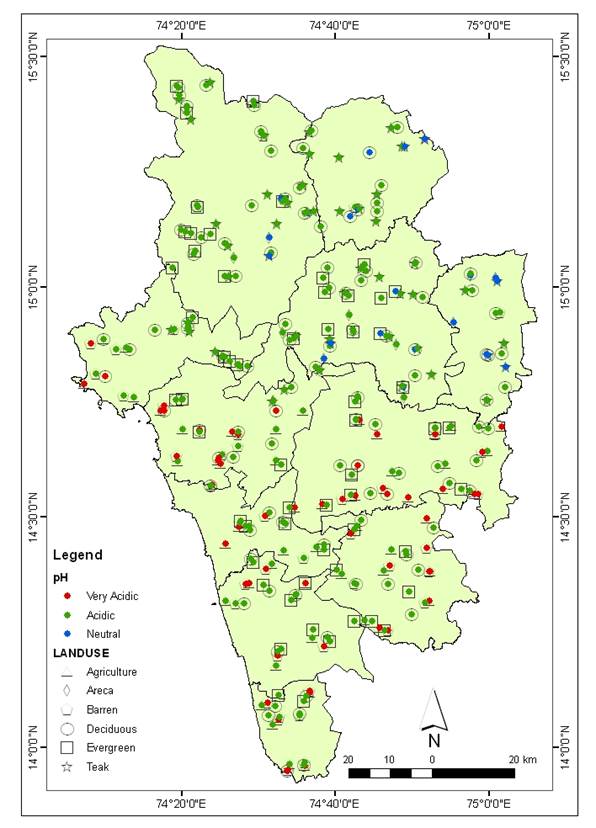
Fig 5: pH across different land-use types in Uttar Kannada district
In the agricultural soils which cultivated rice, pH ranged from 4.35 at Harsikattai in Siddapur taluk to 6.11 at Pudavarabail. Almost all the samples in the coastal talukes were found to be acidic (5-6), according to the scale given by Bertrand (1984). This may be due to the heavier rainfall received in this zone (>3000mm/year) and the general uneven topography. The bases are leached by heavy seasonal rains, and the leaching is more in steeper topography. In the Sirsi taluk where the rainfall is around 2500mm and the land is more of undulating nature the pH is slightly higher although still acidic. pH of open grasslands and fallow lands ranged from 4.45 at Manaki in Honnavar taluk of coast to 6.1 at Sirugunji in coastal Kumta taluk.
The pH in the three talukes of Mundgod, Yellapur and Haliyal show pH more towards neutral (>6.5) which may be due to the influence of the Dharwar Schist’s (Bourgeon 1989). The Dharwar Schist’s which form part of Deccan trap is rich in calcium in form of carbonates compared to the other areas in the study site. These carbonates are responsible in contributing to the higher pH regime in this area.
The reason behind higher pH range in the Arecanut plantations (6.37±0.2) may be due to management practices like mulching. Mulching plays an important role in maintaining the soil chemical balance (Ekanade and Adejuwon, 1988). The pH in the deciduous forest ranged from 4.22 to 7.3. It was found that the coastal talukes and talukes in the Sahayadrian range have acidic pH range (5- 6.5), but the forests in the talukes in the plateau region have pH which is in the neutral regime (6.5-7.5). This may be due to the fact that the region forms the outcrop of the Deccan trap (Bourgeon, 1989).
A study conducted in the same region by Bourgeon (1989) informs that pH in the coastal region which is laterite, is acidic, about 5.2 – 5.5, even under the forest cover. pH in the Western Ghats ranges from acidic to very acidic, which is again confirmed by this study. In case of the semi arid Karnataka plateau, the pH sometimes exceeds 7, in the presence of the carbonates.
The pH in agriculture (5.05±0.4) was lesser than the pH in the evergreen (5.66±0.3) and the deciduous (5.70±0.5) land use. Tilling of land for agricultural purposes plays a vital role in leaching out of bases, as has been already found out in the earlier studies. These may have been responsible for lowering of the pH in the agricultural soils. The pH of the barren land (5.05±0.41) was less compared to those in natural vegetations like teak (6.07±0.3), evergreen (5.66±0.3) and deciduous (5.70±0.5).
As per the study carried out by Islam and Weil (2000), pH in the natural vegetations and the reforested lands is acidic as compared to grasslands and cultivated lands, which was due to the naturally acidic behaviour of the soils, due to presence of aluminium in these soils and intense leaching of base cations during monsoons in these soils (Hassan and Majumdar 1990).
Swamy and Proctor (1994) studied the soils of rainforests of the Sringeri area of the Western Ghats, which is to the South of the present study area. It was found out that pH of the soils was mildly acidic i.e. 5.2 – 6.0.
The conversion of forest to agricultural and pasture purposes initially improves soil fertility by adding base cations mineralized from combusted forest biomass, which raises soil pH and increases cation exchange capacity (CEC) (Nye and Greenland 1964). In our analysis, we found that agricultural and pasture/barren lands had lower pH (5.05±0.4) compared to that under natural vegetation cover (5.68±0.4).
Soil Moisture
First field data
|
Agriculture
n=54 |
Barren
n=38 |
Deciduous
n=49 |
Evergreen
n=35 |
Min |
1.4 |
1.29 |
1.07 |
1.27 |
Max |
35.6 |
49.15 |
52.14 |
43.17 |
Avg± std dev |
13.9±7.8 |
12.5±9.6 |
14.5±10.6 |
16.5±10.4 |
Second field data
|
Arecanut
N=17 |
Deciduous
N=62 |
Evergreen
N=29 |
Teak
N=52 |
Min |
1.04 |
1.0 |
1.21 |
0.6 |
Max |
5.9 |
4.1 |
6.0 |
3.9 |
Avg± std dev |
2.9±1.2 |
2.1±0.8 |
3.2±1.1 |
1.87±0.9 |
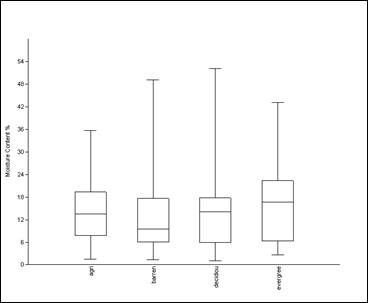
Soil moisture is a very critical property which is greatly influenced by seasonal changes.
In the first phase of field study, soil moisture was found to be highest in evergreen (16.5±10.4) land use type followed by deciduous (14.5±10.6) and agricultural soil systems. The lower bulk density in evergreen soils, leads to higher pore size, which increases the capacity to retain soil moisture. Agricultural (13.9±7.8) and barren (13.9±7.8) soils being open become compact after a period of time, which decreases their pore size, thus resulting in lower soil moisture.
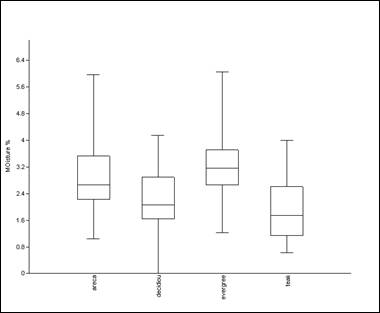
In the second phase Arecanut (2.9±1.2) plantations and evergreen (3.2±1.1) forest had highest soil moisture than other land use systems. Arecanut plantations are privately owned and they employ good management practices like drip irrigation, which maintains the soil moisture.
Soil Bulk Density
|
Agriculture
n=54 |
Barren
n=45 |
Deciduous
n=108 |
Evergreen
n=63 |
Teak
n=53 |
Areca
n=17 |
Min |
1.22 |
1.007 |
0.27 |
0.61 |
0.72 |
0.98 |
Max |
2.25 |
2.22 |
1.83 |
1.53 |
1.62 |
1.73 |
Avg± std.dev |
1.67±0.2 |
1.48±0.2 |
1.28±0.2 |
1.25±0.1 |
1.21±0.2 |
1.32±0.2 |
Pair wise Wilcox Test
|
Areca |
Agriculture |
Barren |
Deciduous |
Evergreen |
Agriculture |
S |
|
|
|
|
Barren |
NS |
S |
|
|
|
Deciduous |
NS |
S |
S |
|
|
Evergreen |
NS |
S |
S |
NS |
|
Teak |
NS |
S |
S |
NS |
NS |
p<0.001; S=significant; NS=non-significant
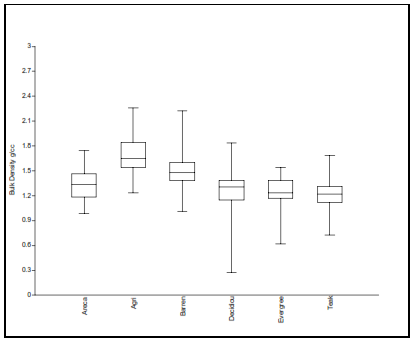
The bulk density of the agricultural soils (1.67 ±0.2 g/cc) was found to be higher than that compared in natural vegetation like deciduous (1.28 ±0.2 g/cc) and evergreen (1.25 ±0.1 g/cc). Forest soils usually have lower bulk density. Frequent cultivation, in particular, tends to break soil aggregates and can compact existing soil. Bulk density increased upon conversion from forest to agricultural land, which in some cases was extreme i.e. 60% (Murty et al, 2002).
In a study conducted in a tropical landscape in Bangladesh, it was found that soils under cultivation (1.38g/cc) had higher bulk density than the adjacent soils under well stocked S.robusta natural forest (1.22g/cc), Acacia reforestation (1.18g/cc) and grass (1.18g/cc) (Islam and Weil, 2000). The cultivated soils were considerably lower is silt and slightly lower in clay than the adjacent soils under natural forest, most likely as a result of preferential removal of silt by accelerated water erosion during the monsoon months (Hassan and Majumdar, 1990). In a study conducted in Puerto rico it was found that in the agricultural soils of dry and moist life zones, had higher bulk density than that in the forests (Brown and Lugo 1990).
The bulk density of Arecanut (1.32 ±0.1 g/cc) plantation was slightly higher as compared to the natural vegetations like evergreen (1.25 ±0.1 g/cc) and deciduous (1.28 ±0.2 g/cc).
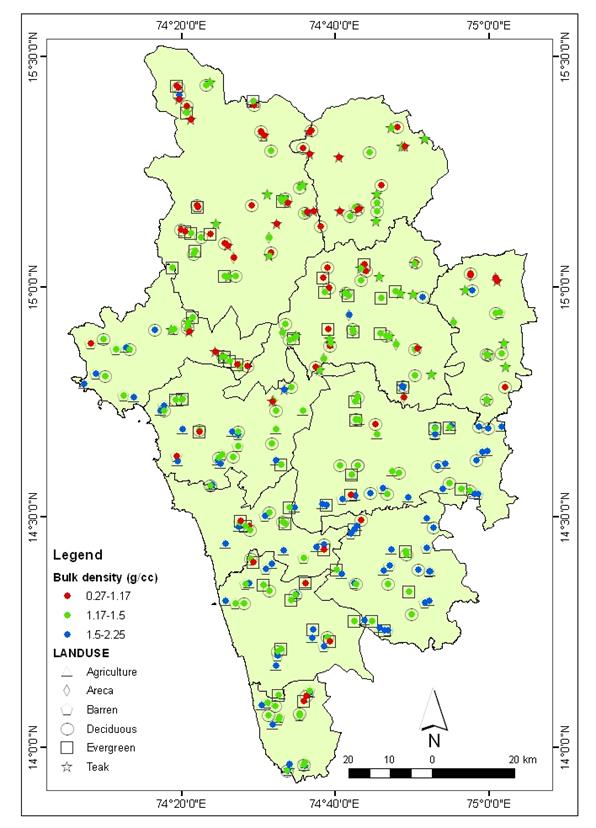
Fig 6: Bulk Density across different land-use types in Uttar Kannada district
Proper management of the soils of these plantations, since they are privately owned, may be responsible in maintaining the soil properties.
The bulk density of teak (1.21±0.2 g/cc) was found to be similar to that of the deciduous (1.28±0.2 g/cc) and evergreen (1.25±0.1 g/cc) land use types. Enhanced aggregate stability of reforested soils is consistent with greater input of labile C contributed by high quality litter fall (Islam and Weil 2000). In contrast organic matter in cultivated soil has less physical protection than that in the uncultivated soils because tillage periodically breaks up macro-aggregates and exposes previously protected organic matter in soil macro-aggregates (Nardi et al. 1996).
The bulk density of the barren/ pasture land (1.48±0.2) was higher than that of the evergreen (1.25±0.1 g/cc) and deciduous (1.28±0.2 g/cc) land use types. Bulk density remains low in primary forest and plantations, which suggest that this is an important property which is preserved under the tree- based land uses (McGrath et al, 2001).
Conversion of forest to barren/ pasture land decreases soil mixing by fossorial arthropods and small mammals (Clark 1990), especially the formation of macro-channels. In addition cattle trampling acts as a physical force, directly reducing the large pore spaces and increasing bulk density (Reiners et al, 1994).
This particular study considered only the top 15 cm soil layer. Earlier studies indicated that bulk density in pasture and forest soils remain same for the top 10 cm soil layer, but differed significantly in the 10 – 20 cm layer (Celik 2005). Agricultural soils had higher bulk density than the forest and pasture soils, which is indicated by the present study also.
Total carbon
|
Agriculture
n=54 |
Barren
n=38 |
Deciduous
n=49 |
Evergreen
n=35 |
Min |
0.31 |
0.31 |
0.66 |
1.56 |
Max |
3.5 |
5.28 |
12.38 |
12.84 |
Avg ± Std dev. |
1.27±0.6 |
2.42±1.3 |
4.06±2.2 |
4.47±2.2 |
Pair wise Wilcox Test
|
Agriculture |
Barren |
Deciduous |
Barren |
S |
|
|
Deciduous |
S |
S |
|
Evergreen |
S |
S |
NS |
p<0.001, S=significant; NS=non-significant
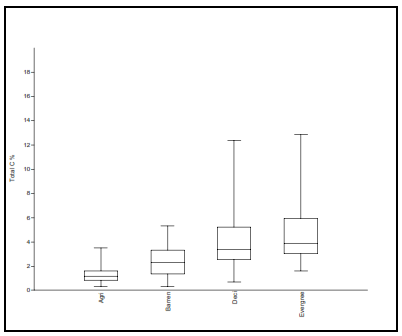
The total carbon was highest in evergreen (4.47±2.2 %) then followed by deciduous (4.06±2.2%), barren (2.42±1.31%) and was lowest in agricultural soils (1.27±0.6%).
Significant variation was found in total carbon of agricultural (4.06±202%) and natural systems like evergreen (4.47±2.2 %) and deciduous (1.27±0.6%).
Soil C is most susceptible to change at the surface (Desjardins and others 1994), where physical changes i.e. removal of live vegetation and forest floor litter exacerbate the processes such as erosion, runoff and leaching of mineral N not taken up by plant. Available studies on tropical soils suggest a rapid decline in organic matter and nitrogen due to continuous cultivation (Allen, 1985; Aweto, 1981; Ayanaba et al., 1976; Brams, 1971; Nye and Greenland, 1964).
Fig 7: Total Carbon across different land-use types in Uttar Kannada district
Upon conversion to crops, the high organic inputs typical of tropical forests (Brown and Lugo, 1982, 1990) decrease markedly, but the warm humid climate favors continuous decay of mineralizeable soil C and N and high rates of leaching.
Carbon is a major contributor to organic matter, which influences cation exchange capacity, soil structure, soil water balance and it also acts a source of plant nutrients (Lal and Kang, 1982; Sanchez, 1976).
Conversion of forests to agricultural systems changes soil physical, chemical and biological properties due to changes in the quantity and quality of organic carbon inputs to soil, nutrients inputs and losses and stimulation of decomposition through soil disturbance. Studies have indicated that significant amounts of carbon could be lost upon conversion of forest to cultivated lands (Murty et al., 2002). The present study strengthens the earlier findings that land use change significantly impacts the total carbon of the soil.
Houghton (1999) estimated a total carbon loss from changes in land use to be 124 Gt C per year over the 1850-1990 periods. Most of this loss was from tropical regions with cropland and forest to pasture conversion contributing 68% and 13% to the loss, respectively.
When a previously forested soil is converted to soil under cultivation there is a transition to a system in which a high proportion of organic C is removed from the site with annual harvest (Vitousek 1983, Smil, 1999).
Total Nitrogen
|
Agriculture
n=54 |
Barren
n=38 |
Deciduous
n=49 |
Evergreen
n=35 |
Min |
0.0 |
0.01 |
0.01 |
0.11 |
Max |
0.21 |
0.31 |
0.87 |
0.53 |
Avg± Std.dev |
0.08±0.05 |
0.14±0.09 |
0.26±0.1 |
0.25±0.1 |
Pair wise Wilcox Test
|
Agriculture |
Barren |
Deciduous |
Barren |
S |
|
|
Deciduous |
S |
S |
|
Evergreen |
S |
S |
NS |
p<0.001, S=significant; NS=non-significant
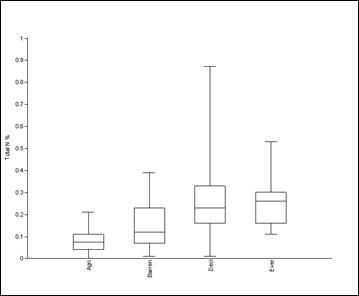
In agricultural soils (0.08±0.05) total nitrogen was significantly less than that in the evergreen (0.25±0.1) and the deciduous (0.26±0.1). Available studies on tropical soils suggest a rapid decline in organic matter and nitrogen due to continuous cultivation (Allen, 1985; Aweto, 1981; Ayanaba et al., 1976; Brams, 1971; Nye and Greenland, 1964). The loss of soil N due to forest conversion to crops has been related to the initial N content (Allen, 1985).
Upon conversion to crops, the high organic inputs typical of tropical forests (Brown and Lugo, 1982) decrease markedly, but the warm humid climate favors continuous decay of mineralizeable soil C and N and high rates of leaching.
It is been studied that in cultivated systems the rate of nutrient uptake exceeds the rate of nutrient return to the soil, thereby causing decline in the soil nutrient status (Adejuwon and Ekanade 1988), which may also be responsible in this case.
Removal of vegetation cover accelerates the decrease of N, due to increased susceptibility of surface N to the various physical forces like erosion, runoff and leaching of mineral N (McGrath et al., 2001).
Barren/ pastures (0.14±0.09) showed decrease in soil total N, although not as much as that of agricultural soils compared to the evergreen (0.25±0.1) and deciduous (0.26±0.1)
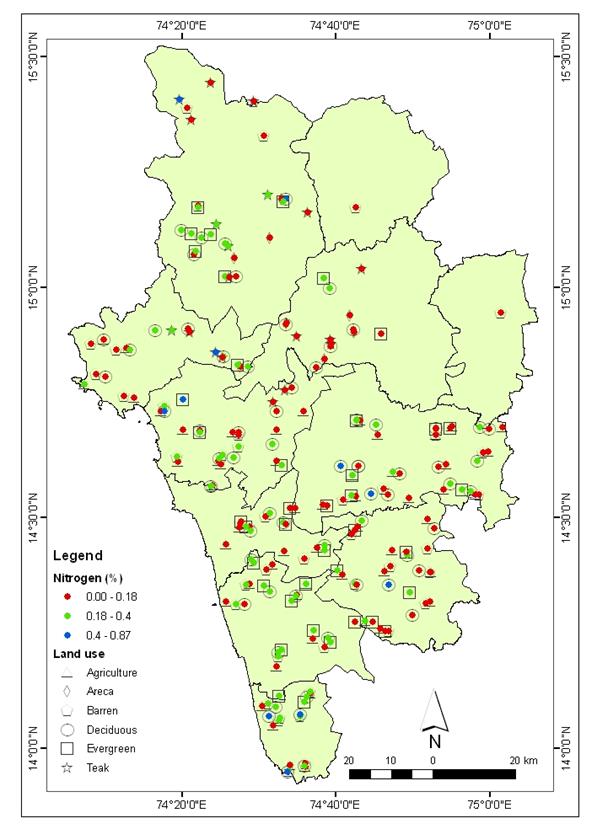
Fig 8: Total Nitrogen across different land-use types in Uttar Kannada district soils.
Studies indicate that there is no significant change in total N among pastures/barren and natural forest systems (McGrath et al., 2001; Islam and Weil, 2000; Brown and Lugo, 1990).
There is no significant variation amongst the total N of deciduous (0.26±0.1) and evergreen (0.25±0.1) systems. This may be due to the leaf-litter quantities in these forest systems. Tree cover too plays an important role in maintaining total N and preventing it from leaching due to physical forces.
Available Phosphorus
Available Phosphorus (kg/Hec)
|
Agriculture
n=54 |
Barren
n=45 |
Deciduous
n=108 |
Evergreen
n=63 |
Teak
n=53 |
Areca
n=17 |
Min |
0.01 |
0.01 |
0.01 |
0.01 |
0.05 |
0.05 |
Max |
0.63 |
10.57 |
2.05 |
2.14 |
1.95 |
5.57 |
Avg ± Std.dev |
0.06±0.08 |
0.37±1.58 |
0.28±0.3 |
0.27±0.4 |
0.49±0.4 |
1.23±1.22 |
Pair wise Wilcox Test
|
Areca |
Agriculture |
Barren |
Deciduous |
Evergreen |
Agriculture |
S*** |
|
|
|
|
Barren |
S*** |
NS |
|
|
|
Deciduous |
S*** |
S |
S* |
|
|
Evergreen |
S*** |
NS |
NS |
NS |
|
Teak |
S** |
S |
S*** |
S** |
S*** |
*p<0.05, **p<0.01, ***p<0.001; S=significant; NS=non-significant
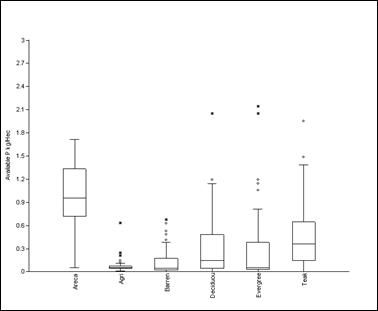
Available Phosphorus was significantly higher in Arecanut (1.23±1.22) than in any other land use type. Higher organic mineralization occurs in soils treated with management practices like mulching, subsequently leading to higher phosphorus levels. Lowest amount of phosphorus was found in agricultural (0.06±0.08) soils, which may be due to continuous cultivation pressure on the soil leading to depletion of soil available phosphorus. Poor management practices in these land use types too are responsible for lower phosphorus levels.
Phosphorus is one of the major nutrients required for growth by plants. Soil P impoverishment has been widely cited as the principal cause for declines in soil fertility that have forced land owners to abandon both pastures and crop fields, often only few years after forest conversion (Serrao and others 1996).
In our study agricultural (0.06±0.08) phosphorus was significantly lower than deciduous (0.28±0.3) and teak (0.27±0.4) land use systems, but it was not varying greatly with evergreen, the reasons of which are unknown.
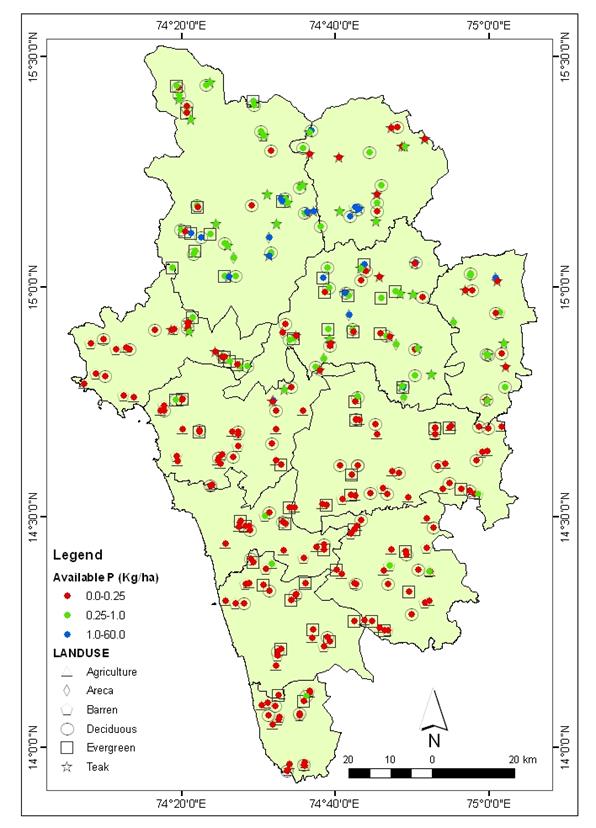
Fig 9: Available Phosphorus across different land-use types in Uttar Kannada
Available K
|
Agriculture
n=54 |
Barren
n=45 |
Deciduous
n=108 |
Evergreen
n=63 |
Teak
n=53 |
Areca
n=17 |
Min |
0.01 |
0.01 |
0.03 |
0.02 |
0.44 |
0.43 |
Max |
7.3 |
5.81 |
16.22 |
6.94 |
6.56 |
7.00 |
Avg.± std.dev. |
0.7±1.3 |
0.5±0.9 |
2.3±2.4 |
1.9±1.6 |
3.0±1.4 |
2.9±1.9 |
Pair wise Wilcox Test
|
Areca |
Agriculture |
Barren |
Deciduous |
Evergreen |
Agriculture |
S*** |
|
|
|
|
Barren |
S*** |
|
|
|
|
Deciduous |
NS |
S*** |
S*** |
|
|
Evergreen |
NS |
S*** |
S*** |
NS |
|
Teak |
NS |
S*** |
S*** |
S** |
S*** |
*p<0.05, **p<0.01, ***p<0.001; S=significant; NS=non-significant
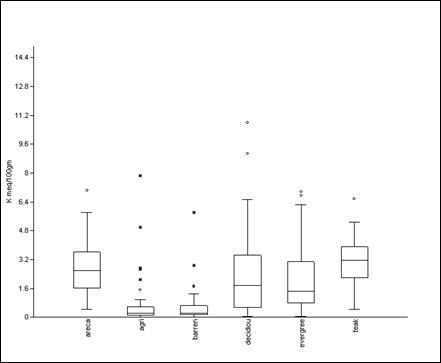
Fig 10: Potassium across different land-use types in Uttar Kannada district
Potassium is a major macro nutrient required for plant growth. Potassium was significantly lower in agriculture (0.7±1.3) and barren (0.5±0.9) soils than compared to other tree based land use types. It is observed that nutrient immobilization and subsequent removal in these systems is not matched by the rate of nutrient return to the soil through the fall and mineralization of litter (Lal 1975).
In natural soils available K is very high, but cropping for many years will reduce the availability of this element (Brady 1984). Potassium was higher in Arecanut (2.9±1.9) compared to natural land use types. The reason for higher concentration of potassium in Arecanut garden is due to addition of ash by farmers in this region (Chandran, pers. comm.). Potassium is also found to higher in teak (3.0±1.4) plantations.
Sodium
|
Agriculture
n=54 |
Barren
n=45 |
Deciduous
n=108 |
Evergreen
n=63 |
Teak
n=53 |
Areca
n=17 |
Min |
0.05 |
0.08 |
0.05 |
0.14 |
0.09 |
0.03 |
Max |
2.69 |
6.3 |
4.27 |
1.63 |
1.36 |
1.61 |
Avg. ± Std.Dev |
0.71±0.6 |
0.80±1.2 |
0.58±0.5 |
0.57±0.4 |
0.47±0.3 |
0.59±0.4 |
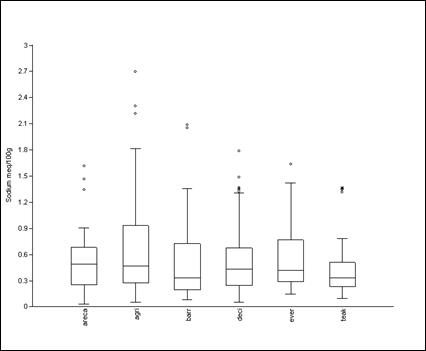
Fig 11: Sodium across different land-use types in Uttar Kannada district
Soil sodium ranged from 0.05 to 2.69 meq/100gm in agricultural soils, while it ranged from 0.08 to 6.3 meq/100gm in barren/ pastures. In deciduous soils it ranged from 0.05 to 4.27 meq/100gm, while in evergreen it was 0.14 to 1.63 meq/100gm. In teak plantation it was ranging from 0.09 to 1.36 meq/100gm, while in Arecanut it ranged from 0.03 to 1.61 meq/100gm.
Though there was no significant variation among the sodium in the various land use types, it is highest under barren followed by agriculture, Arecanut, deciduous, evergreen and teak. Sodium is one of the important cation, which is responsible for osmotic balance and cell cationic charges in vegetation (Miller, 1990).
Barren soils have highest sodium than all other tree based land uses like Arecanut, evergreen, deciduous and teak. The reasons for the higher sodium content in barren are unknown. Irrigation water can be responsible for higher sodium in soil in case of agriculture and Arecanut. In a study conducted by Adejuwon and Ekanade (1988), sodium was found to be highest in the natural forest then followed by fallow, and cultivated soils.
Although the dynamics of soil sodium are not clearly understood, without other cationic bases, the natural forests seem to have lesser sodium than the human influenced systems.
Calcium
|
Agriculture
n=54 |
Barren
n=45 |
Deciduous
n=108 |
Evergreen
n=63 |
Teak
n=53 |
Areca
n=17 |
Min |
2.0 |
0.1 |
0.2 |
0.2 |
2.1 |
2 |
Max |
14.9 |
5 |
40.4 |
12.5 |
24 |
14.9 |
Avg±
Std.Dev |
0.62±0.4 |
0.94±1.2 |
4.94±5.7 |
3.36±3.4 |
7.66±4.2 |
6.68±3.2 |
Pair wise Wilcox Test
|
Areca |
Agriculture |
Barren |
Deciduous |
Evergreen |
Agriculture |
S |
|
|
|
|
Barren |
S |
NS |
|
|
|
Deciduous |
NS |
S |
S |
|
|
Evergreen |
S |
S |
S |
NS |
|
Teak |
NS |
S |
S |
S |
S |
p<0.001; S=significant; NS=non-significant
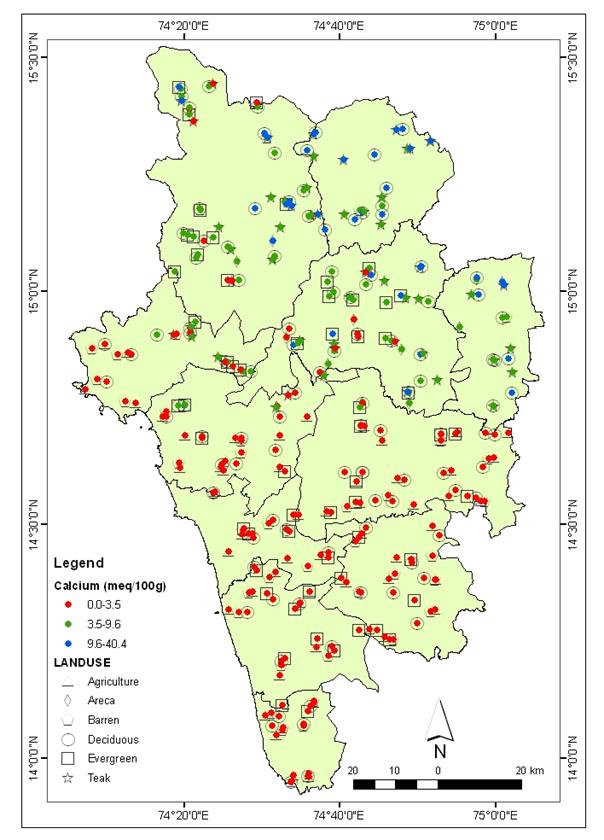
Fig 12: Calcium across different land-use types in Uttar Kannada district
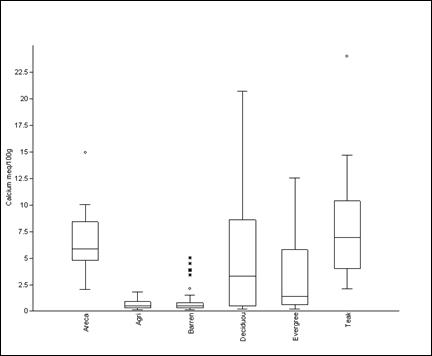
It was found that calcium levels are higher in the land use types which are under tree based systems. Lower amounts of calcium was found in agricultural (0.62±0.4) and barren (0.94±1.2) soils, which can be due to exposure of these lands to heavy rain, which may cause leaching our of the bases.
Studies have found that repeated harvesting results in significant losses of soil Ca because Ca rich woody biomass is removed from the site (Brouwer and Riezebos 1998)
Studies have also shown that increased organic matter mineralization and decreased plant uptake may increase soil availability of base cations such as Ca and Mg, for substantial periods (McNabb and others 1997)
Decomposition of foliage is a major factor for higher level of base cation availability in soils. Hence litter fall in the forest systems may be playing a vital role for elevated Ca concentrations than that compared to that in barren and agricultural landscapes.
Activity of mulching and adding ash to the soils in Arecanut gardens may be responsible for the higher Ca levels. When base rich ash is incorporated into the soil, H+ ions are dissociated from the exchange complex, which increases the capacity of soil to retain and exchange base cations (Brady and Weil 1999).
According to Bourgeon (1989) the total exchangeable bases in the Western Ghats region is 0.2 meq/100gm (Ca+ Mg+ Na+ K). The reason behind this appears to be the parent material found in this region.
It is indicated from the map that soil calcium is lower in the coastal talukes while it is higher in the talukes such as Mundgod, Yellapur, Supa and Haliyal, which form part of the semi arid Karnataka plateau.
Magnesium
|
Agriculture
n=54 |
Barren
n=45 |
Deciduous
n=108 |
Evergreen
n=63 |
Teak
n=53 |
Areca
n=17 |
Min |
0.1 |
0.1 |
0.1 |
0.1 |
0.9 |
0.3 |
Max |
1.2 |
2.5 |
13.8 |
11.6 |
13.4 |
4.7 |
Avg. ± Std.Dev |
0.37±0.2 |
0.5±0.6 |
2.4±2.6 |
2.0±2.3 |
3.3±2.4 |
3±1.4 |
Pair wise Wilcox Test
|
Areca |
Agriculture |
Barren |
Deciduous |
Evergreen |
Agriculture |
S*** |
|
|
|
|
Barren |
S*** |
NS |
|
|
|
Deciduous |
NS |
S*** |
S*** |
|
|
Evergreen |
NS |
S*** |
S*** |
NS |
|
Teak |
NS |
S*** |
S*** |
S** |
S*** |
*p<0.05, **p<0.01, ***p<0.001; S=significant; NS=non-significant
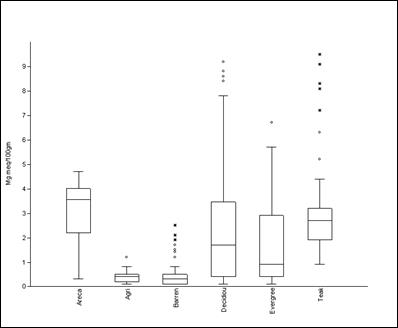
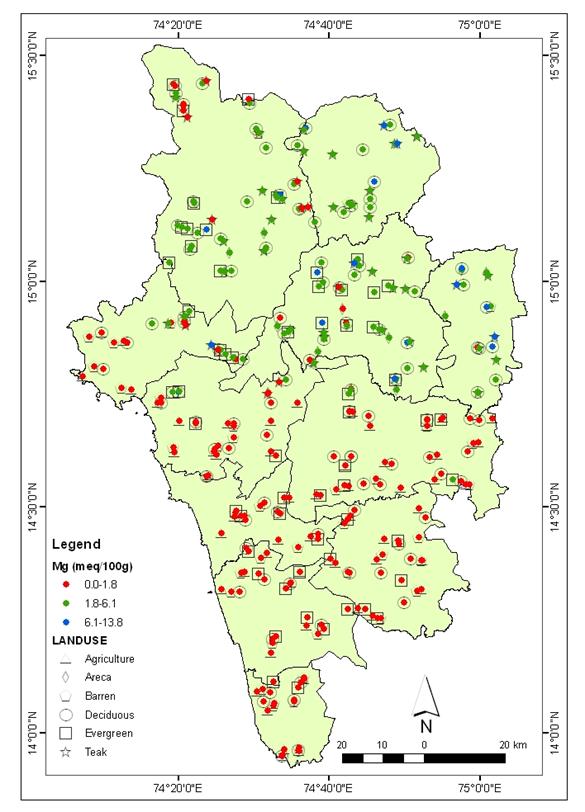
Fig 13: Magnesium across different land-use types in Uttar Kannada district
There is significant variation among mg of Arecanut (3±1.4) and that of agriculture (0.37±0.2) and barren. Barren (0.5±0.6) and agriculture lands had the lowest magnesium levels indicating degradation of soil. Magnesium in agriculture (0.37±0.2) varied immensely from that in the evergreen (2.0±2.3), deciduous (2.4±2.6) and teak plantations. Teak (3.3±2.4) plantations too had lower Mg levels compared to evergreen (2.0±2.3) and deciduous (2.4±2.6) land use types. Leaf litter plays a vital role in cycling of most of the nutrients in the soil. Substantial amounts of magnesium in evergreen and deciduous suggest that decomposition of leaf litter, which leads to increased organic matter mineralization, may be responsible of maintaining the levels of exchangeable bases in the soils.
Soil texture
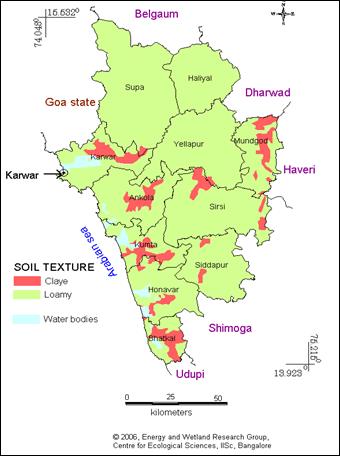
Fig 13: Soil Texture in Uttar Kannada district
About twelve different patterns of soils were identified in the current study context. Agricultural soils ranges from clay, clay loam and loamy while barren/pasture land showed sandy loam, sandy clay and clayey loam. Agricultural soils have more clay content due to continuous disturbance caused by agricultural practices like ploughing. However, agricultural and barren/pasture shows more or less similar soil patterns except few exceptions. Deciduous vegetation has the entire soil pattern except the clay loam and clay. The majority of the evergreen soils are sandy loam due to low disturbance.
Most coastal districts showed sandy loam and sandy soil types. Talukes like Bhatkal, Mundgod, Karwar Ankola and Kumta had higher percentages of clayey soil types.
Dr. T.V. Ramachandra
Centre for Sustainable Technologies,
Centre for infrastructure, Sustainable Transportation and Urban Planning (CiSTUP),
Energy & Wetlands Research Group, Centre for Ecological Sciences, Indian Institute of Science, Bangalore – 560 012, INDIA.
E-mail : cestvr@ces.iisc.ac.in
Tel: 91-080-22933099/23600985,
Fax: 91-080-23601428/23600085
Web: http://ces.iisc.ac.in/energy
Subash Chandran M.D Energy & Wetlands Research Group, Centre for Ecological Sciences, Indian Institute of Science, Bangalore – 560 012, INDIA.
E-mail:
subhashc@iisc.ac.in
Joshi N.V.Energy & Wetlands Research Group, Centre for Ecological Sciences, Indian Institute of Science, Bangalore – 560 012, INDIA.
E-mail:
nvjoshi@iisc.ac.in
Dhaval Joshi
Energy & Wetlands Research Group, Centre for Ecological Sciences, Indian Institute of Science, Bangalore – 560 012, INDIA.
Maneesh Kumar
Energy & Wetlands Research Group, Centre for Ecological Sciences, Indian Institute of Science, Bangalore – 560 012, INDIA.
Citation: Ramachandra T.V, Subash Chandran M.D, Joshi N.V, Dhaval Joshi, Maneesh Kumar, 2012. Soil Quality across Diverse Landscapes in Central Western Ghats, India , Sahyadri Conservation Series 16, ENVIS Technical Report 42, CES, Indian Institute of Science, Bangalore 560012