|
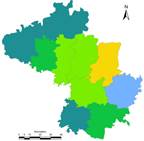
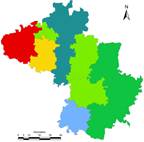
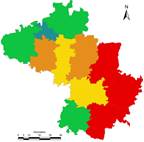
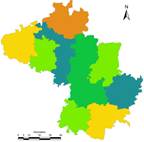
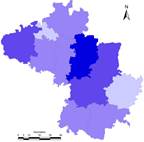
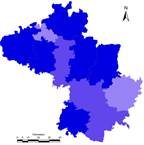
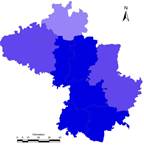
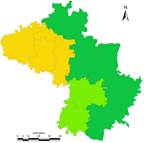
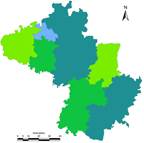
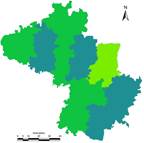
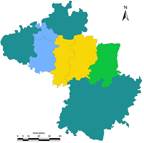
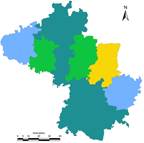
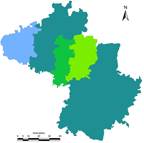
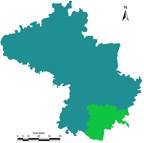
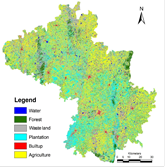
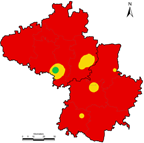
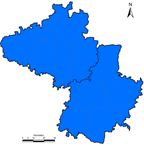
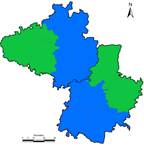
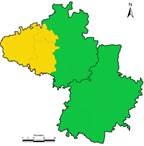
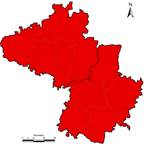
3.1 Land use analysis: Land use analysis was carried out using remote sensing data of 2016, and results are given in figure 3.1 and table 3.1. Major portion of the catchment is covered with degraded forest (6.5%), agriculture (33.9%), plantations (16.9%), etc. The accuracy of the land use classification is 87% with kappa of 0.82. Higher spatial extent of wastelands (38%) highlights the gross mismanagement of land resources in the region
|
Land use - 2016 |
Area (%) |
|
|
Water (Lakes, Rivers, Ponds) |
1.8 |
Forest |
6.5 |
Wastelands (Open/Quarries/Scrub lands) |
38.0 |
Plantation (Horticulture/Forest plantations) |
16.9 |
Built-up (Buildings, roads) |
3.0 |
Agriculture (Fallow, Current sown) |
33.9 |
|
|
Fig 3.1: Land use (2016) |
Table 3.1: Land use statistics |
|
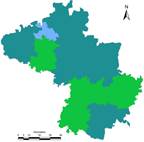
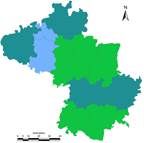
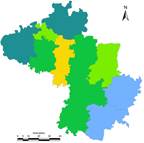
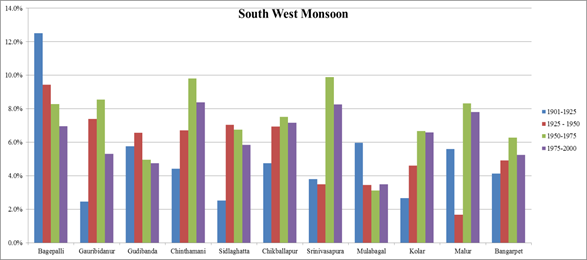
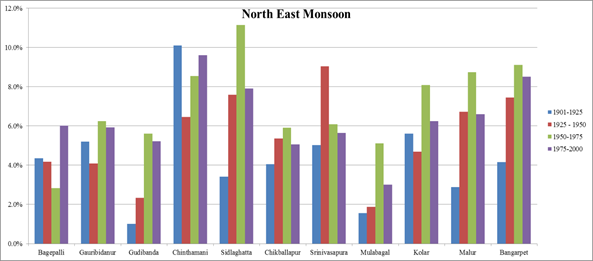
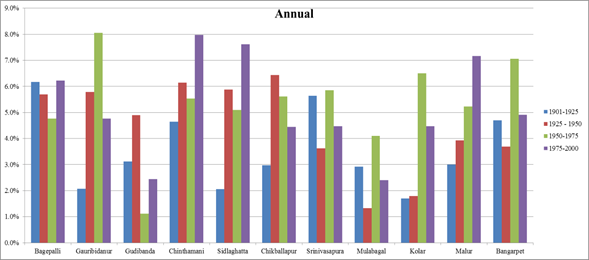
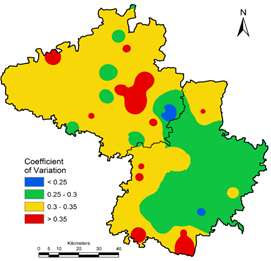
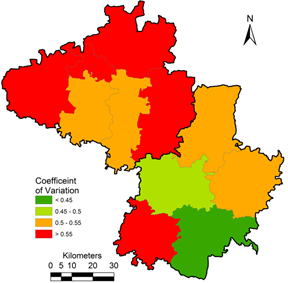
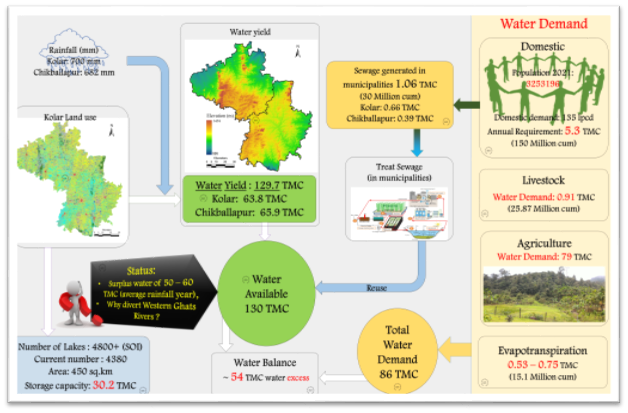
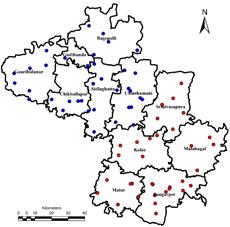
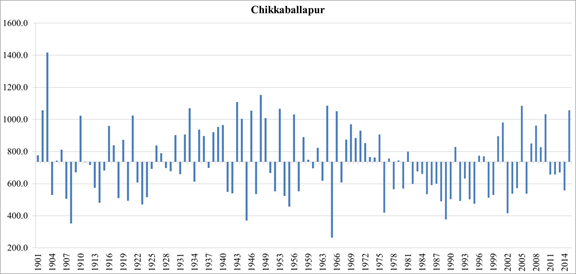
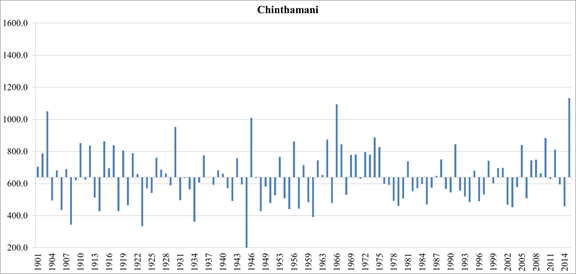
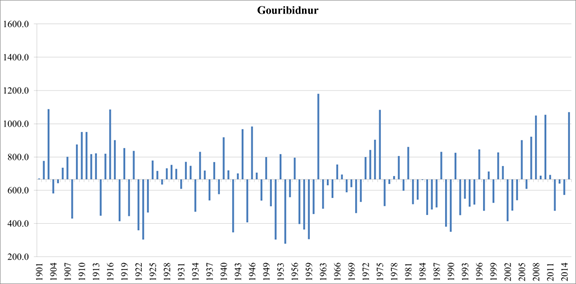
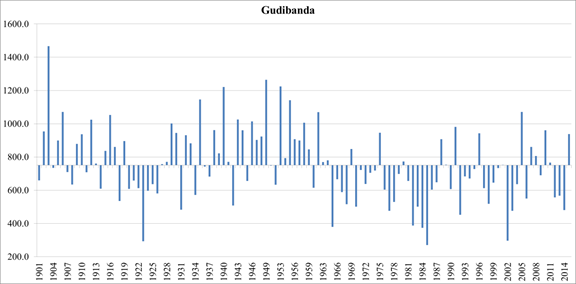
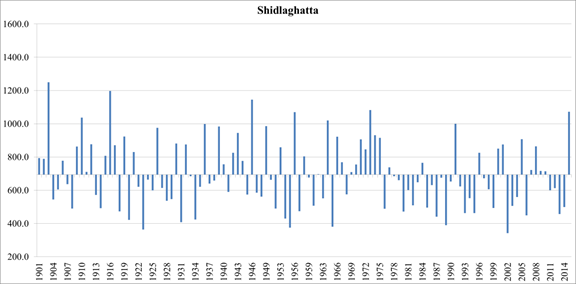
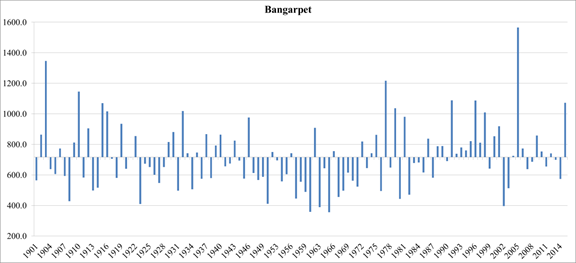
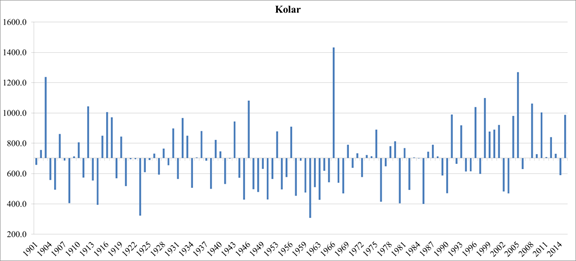
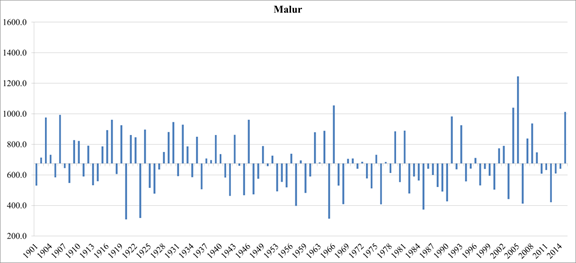
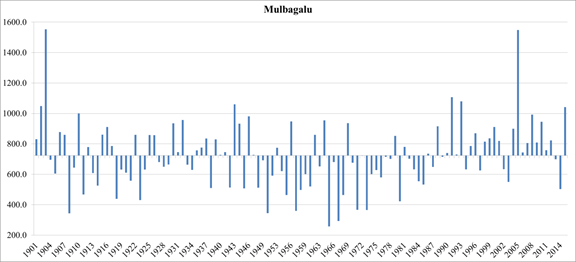
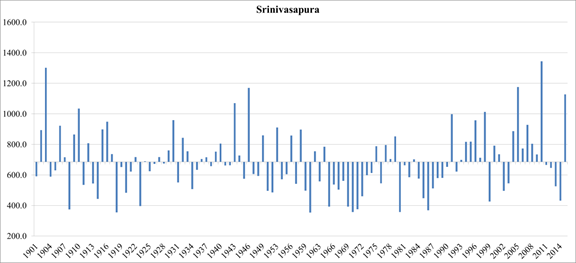
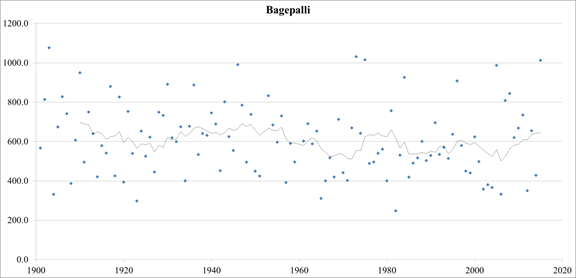
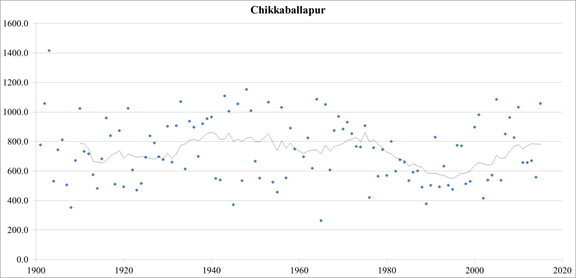
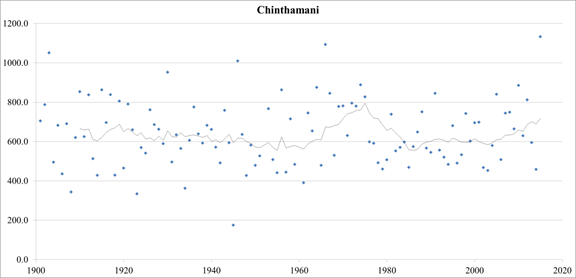
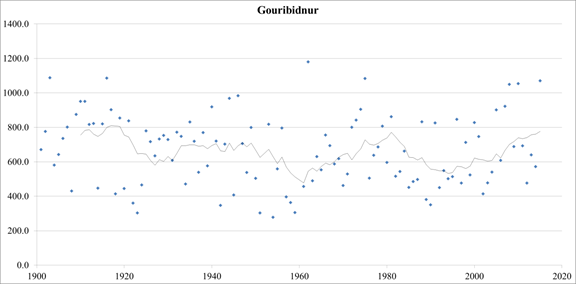
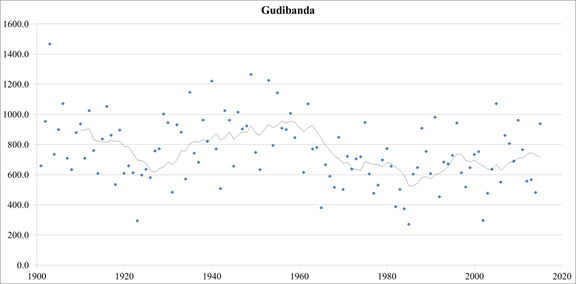
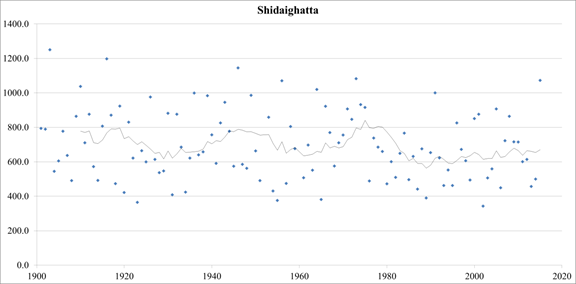
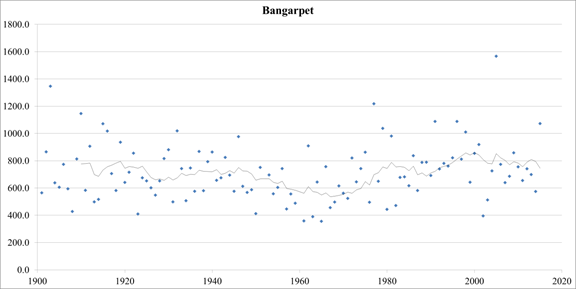
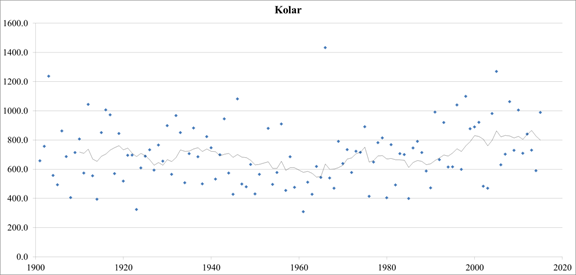
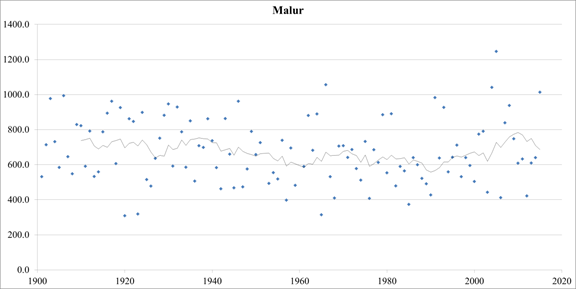
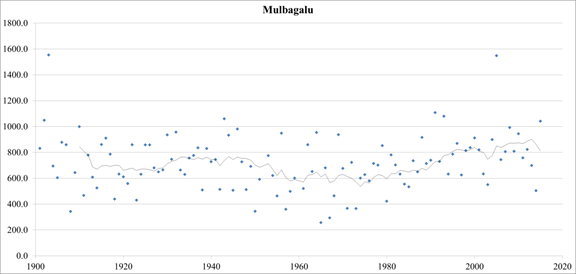
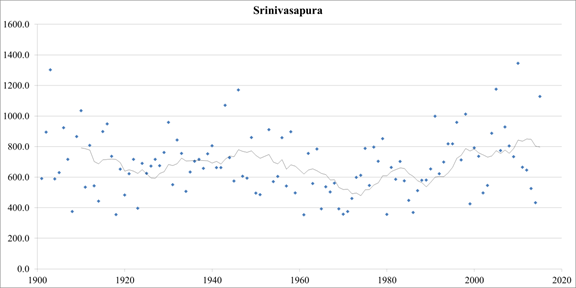
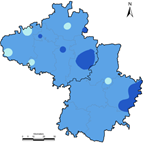
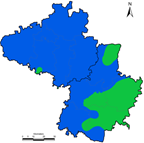
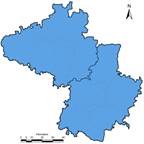
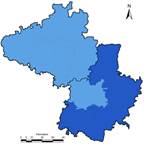
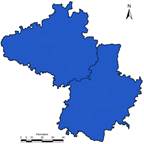
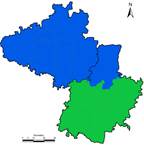
Variability of rainfall was assessed based on 70 rain gauge stations in the catchment (31 in Kolar and 39 are in Chikballapur) and the spatial distribution of these rain gauges are depicted in Figure 3.2. Talukwise temporal variations are depicted in Figure 3.3. Decadal variability is presented in Figure 3.4 (moving average, taluk wise). These analyses highlights of normal variability across the precipitation cycles and there is no significant decline in rainfall (as claimed by individuals with vested interests) |
Fig 3.2: Spatial distribution of rain gauges |
3.2 RAINFALL VARIATIONS ACROSS TIME AND SPACE
 |
Bagepalli |
|
Chikkaballapur |
|
Chinthamani |
|
Gouribidnur |
|
Gudibanda |
|
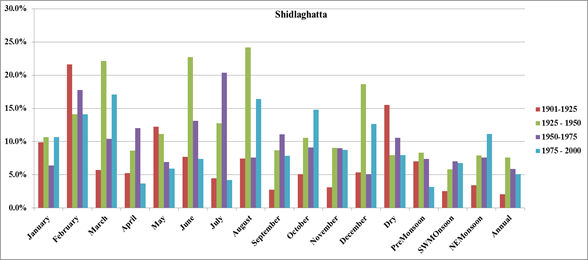
Shidlaghatta |
|
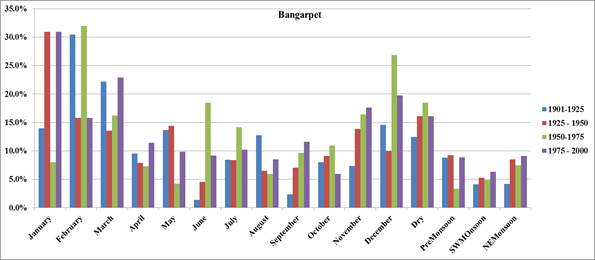
Bangarpet |
|
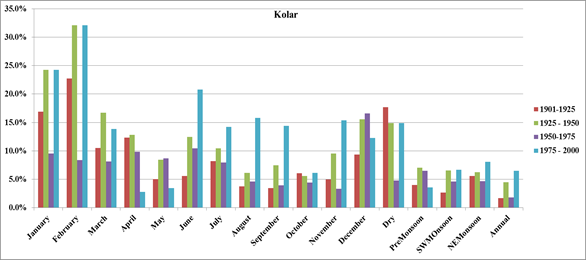
Kolar |
|
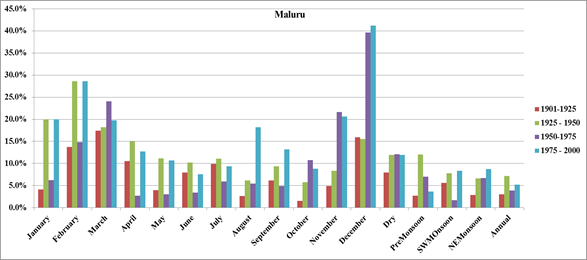
Malur |
|
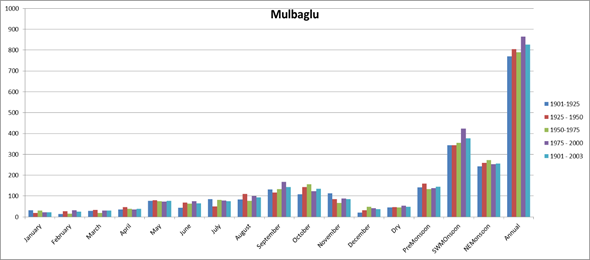
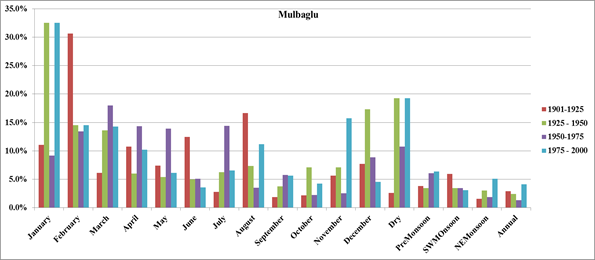
Mulbaglu |
|
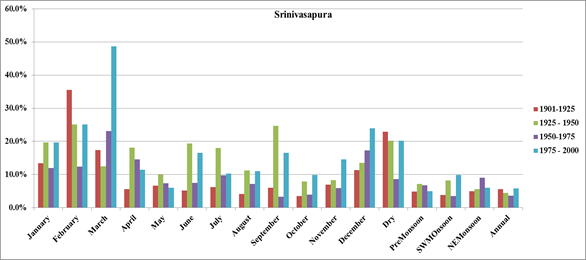
Srinivasapura |
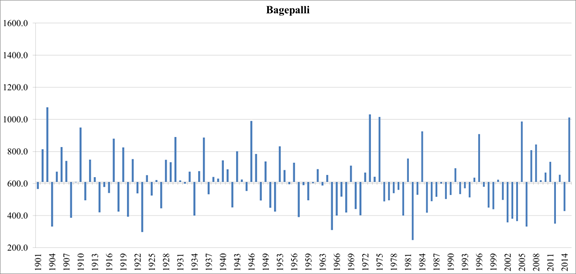
Figure 3.3: Rainfall distribution with respect to mean rainfall ( X axis – years, Y axis – rainfall in mm)
|
Bagepalli |
|
Chikkaballapur |
|
Chinthamani |
|
Gouribidnur |
|
Gudibanda |
|
Shidlaghatta |
|
Bangarpet |
|
Kolar |
|
Malur |
|
Mulbaglu |
|
Srinivasapura |
Figure 3.4: Decadal rainfall moving average (X axis – Years, Y axis – Rainfall in mm)
Table 3.2: Rainfall frequency distribution, Kolar district (Rainfall in mm)
Frequency |
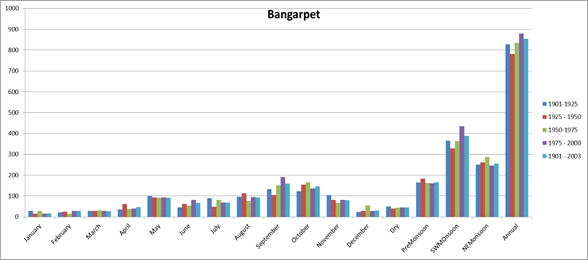
Bangarpet |
Kolar |
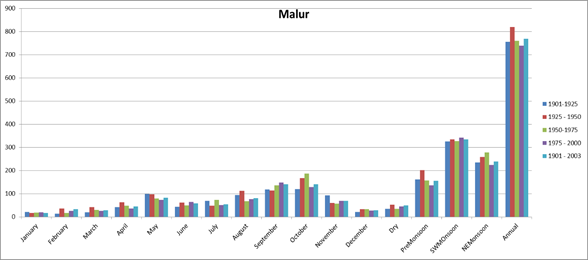
Malur |
Mulbaglu |
Srinivasapura |
< 400 |
4 |
4 |
5 |
7 |
10 |
400 - 500 |
12 |
18 |
14 |
7 |
10 |
500 - 600 |
19 |
19 |
27 |
13 |
23 |
600 - 700 |
26 |
19 |
20 |
26 |
20 |
700 - 800 |
19 |
20 |
18 |
21 |
21 |
800 - 900 |
15 |
14 |
15 |
19 |
14 |
900 - 1000 |
6 |
9 |
10 |
13 |
7 |
> 1000 |
12 |
10 |
4 |
7 |
8 |
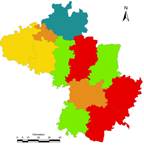
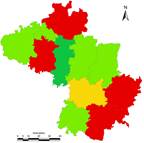
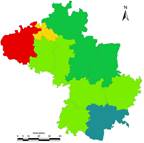
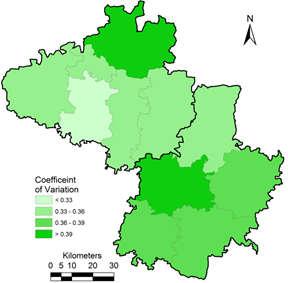
Frequency of occurrences of rainfall (<400, 400-500, 500-600..), taluk wise for Kolar district is given in Table 3.2, which highlights Bangarpet has received in the region 600 -700 mm (23% years) and > 1000 mm during 12 years (of 113 years). Taluk wise rainfall dependability is given in Table 3.3 and Figure 3.5, which highlights that all taluks receives rainfall in the range 500-600 mm (>85% dependability). Rainfall range wise return period is computed and are listed in Table 3.4, which illustrates the return period of 6 years (for 500-600 mm) and 8 years (for 700-800 mm).
Table 3.3: Rainfall dependability, Kolar district(Rainfall in mm)
Dependability |
Bangarpet |
Kolar |
Malur |
Mulbaglu |
Srinivasapura |
< 400 |
100.0% |
100.0% |
100.0% |
100.0% |
100.0% |
400 - 500 |
96.5% |
96.5% |
95.6% |
93.8% |
91.2% |
500 - 600 |
85.8% |
80.5% |
83.2% |
87.6% |
82.3% |
600 - 700 |
69.0% |
63.7% |
59.3% |
76.1% |
61.9% |
700 - 800 |
46.0% |
46.9% |
41.6% |
53.1% |
44.2% |
800 - 900 |
29.2% |
29.2% |
25.7% |
34.5% |
25.7% |
900 - 1000 |
15.9% |
16.8% |
12.4% |
17.7% |
13.3% |
> 1000 |
10.6% |
8.8% |
3.5% |
6.2% |
7.1% |
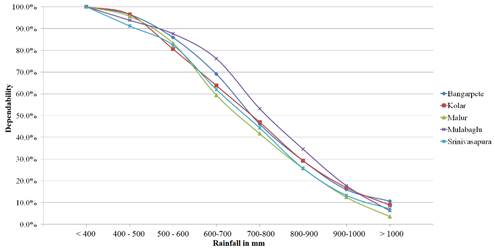
Figure 3.5: Rainfall dependability in Kolar District, Taluk wise
Table 3.4: Rainfall return period in years, Kolar district (Rainfall in mm)
Return Period |
Bangarpet |
Kolar |
Malur |
Mulbaglu |
Srinivasapura |
< 400 |
28 |
28 |
23 |
16 |
11 |
400 - 500 |
9 |
6 |
8 |
16 |
11 |
500 - 600 |
6 |
6 |
4 |
9 |
5 |
600 - 700 |
4 |
6 |
6 |
4 |
6 |
700 - 800 |
6 |
6 |
6 |
5 |
5 |
800 - 900 |
8 |
8 |
8 |
6 |
8 |
900 - 1000 |
19 |
13 |
11 |
9 |
16 |
> 1000 |
9 |
11 |
28 |
16 |
14 |
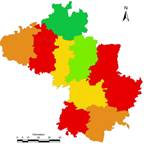
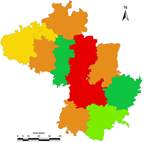
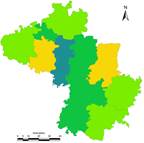
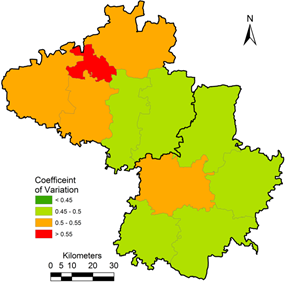
Frequency of occurrences of rainfall (<400, 400-500, 500-600..), taluk wise for Chikballapur district is given in Table 3.5, which highlights Chikballapur taluk has received in the region 600 -700 mm (23% years) and > 1000 mm during 17 years (of 113 years). Taluk wise rainfall dependability is given in Table 3.6 and Figure 3.6, which highlights that all taluks receives rainfall in the range 500-600 mm (>75% dependability). Rainfall range wise return period is computed and are listed in Table 3.7, which illustrates the return period of 6 years (for 500-600 mm) and 98 years (for 700-800 mm).
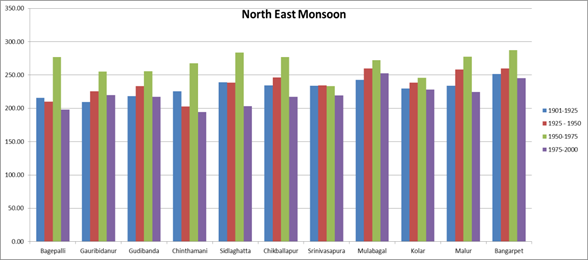
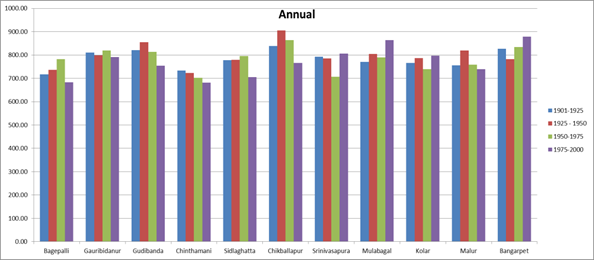
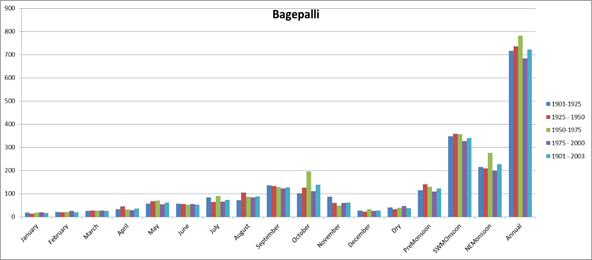
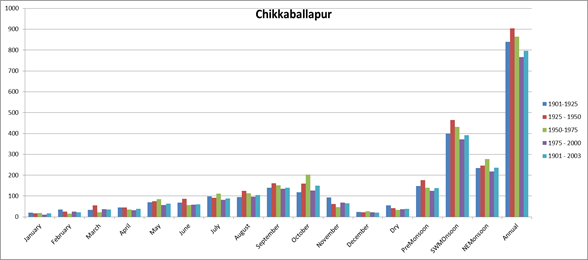
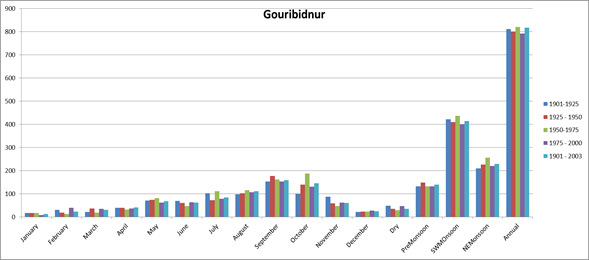
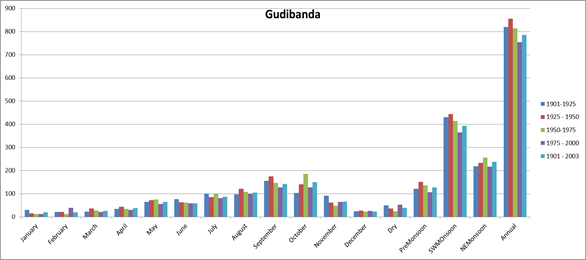
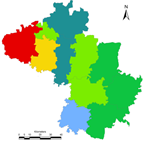
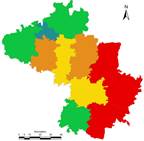
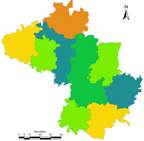
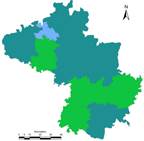
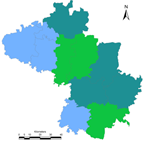
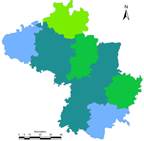
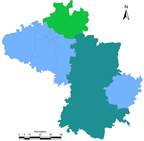
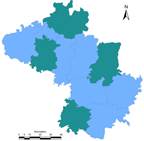
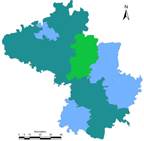
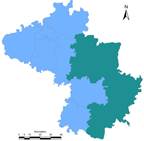
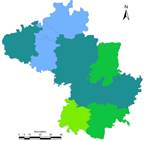
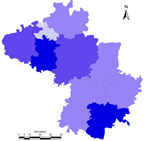
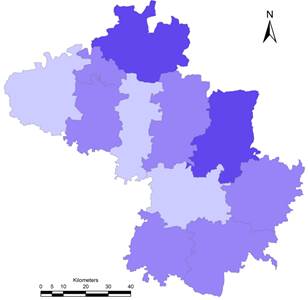
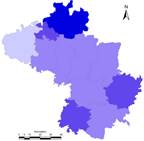
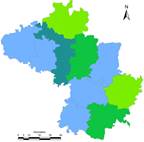
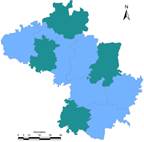
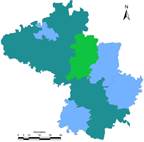
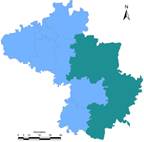
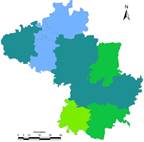
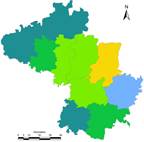
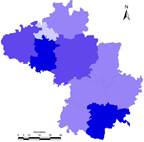
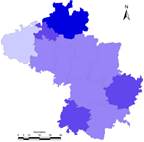
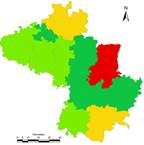
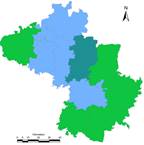
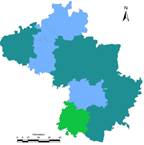
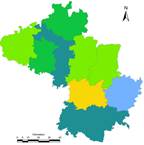
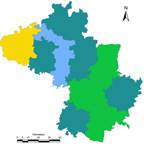
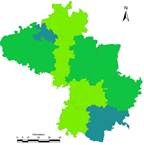
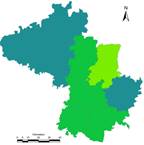
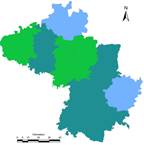
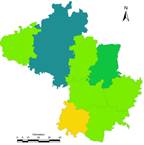
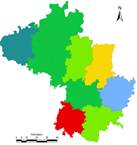
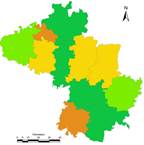
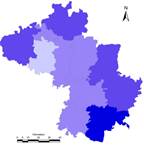
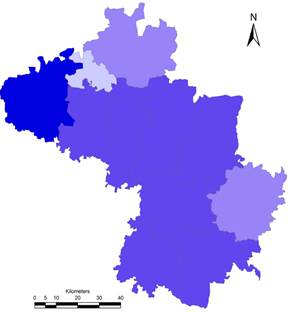
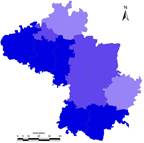
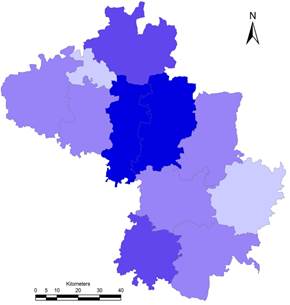
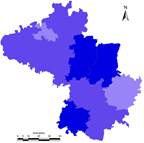
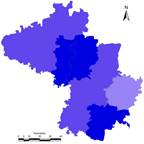
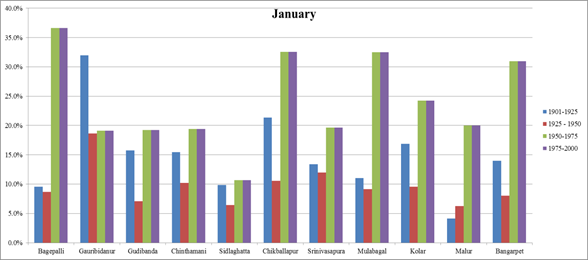
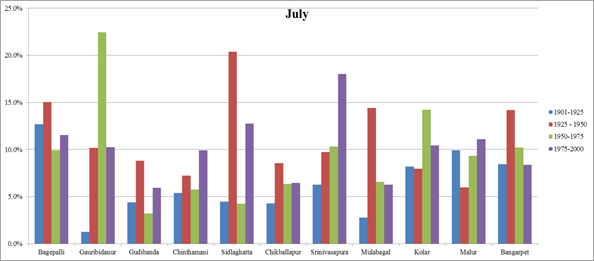
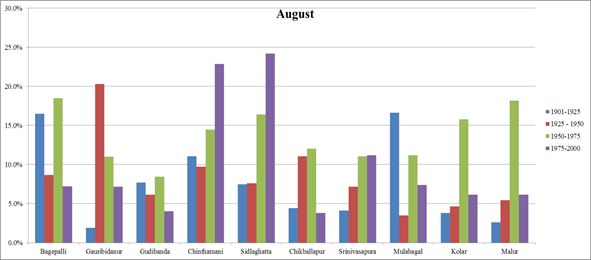
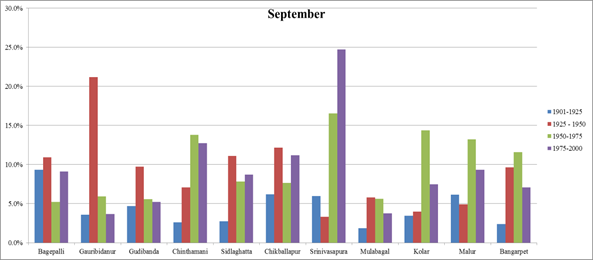
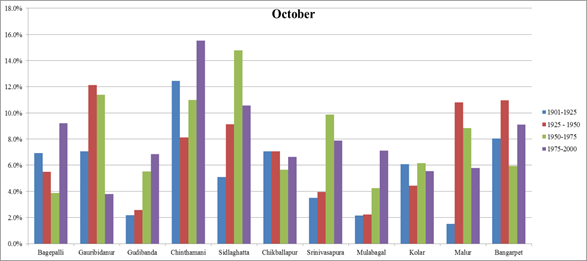
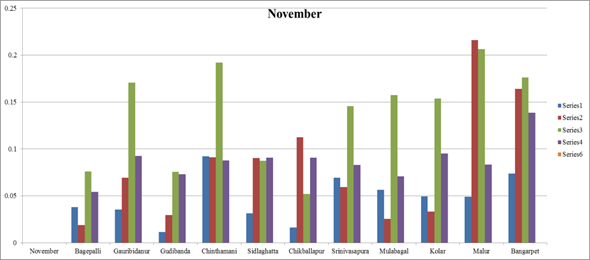
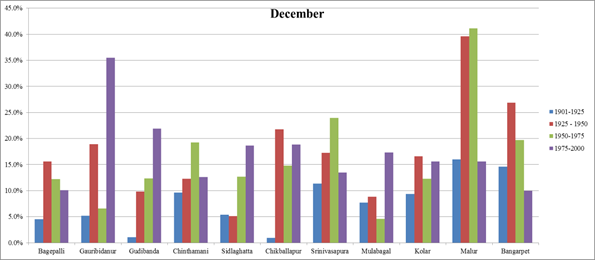
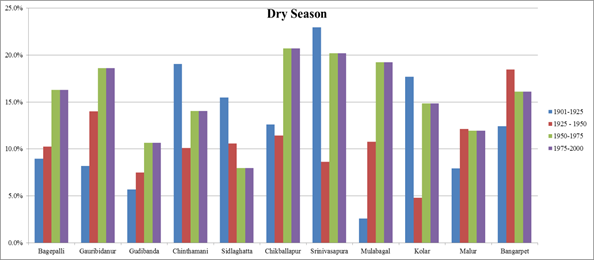
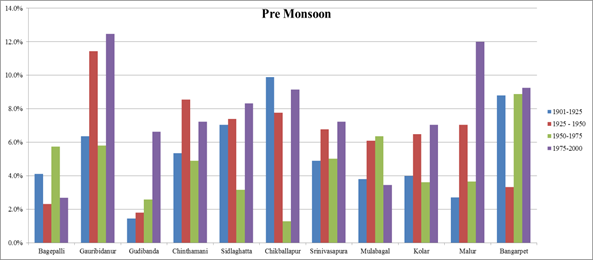
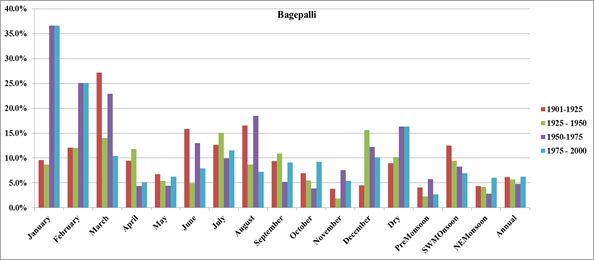
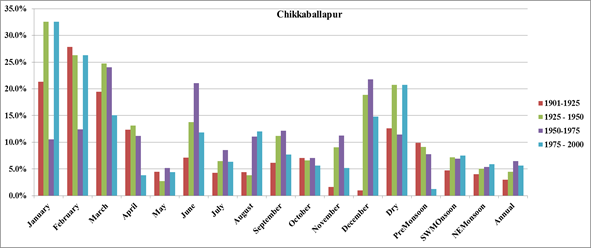
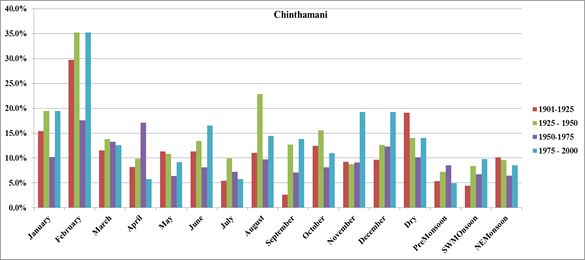
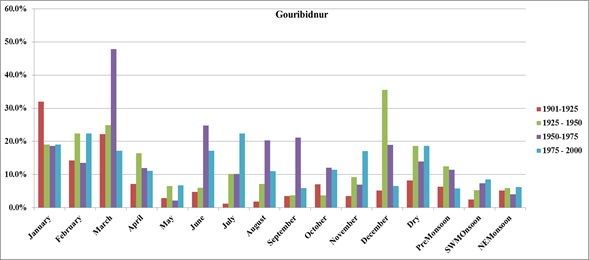
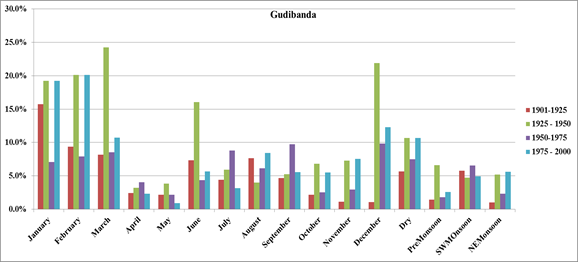
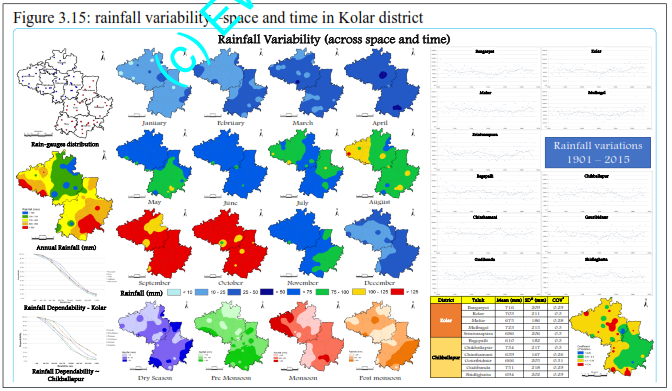
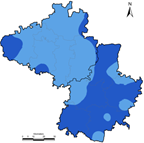
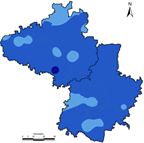
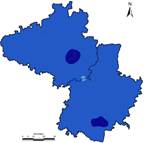
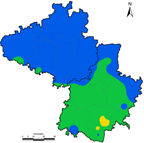
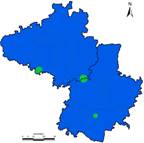
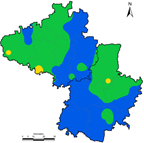
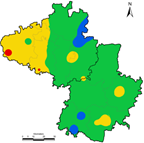
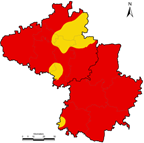
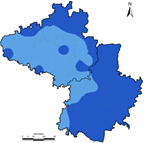
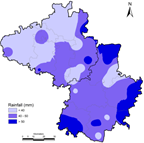
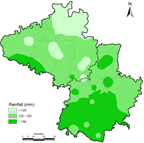
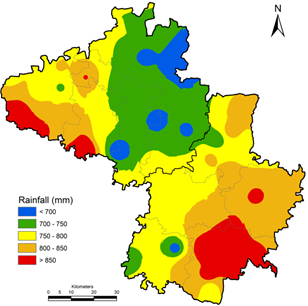
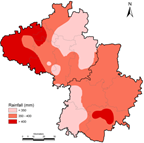
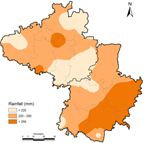
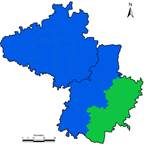
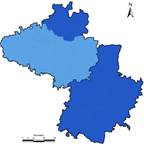
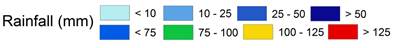
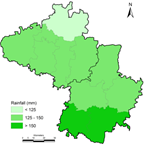
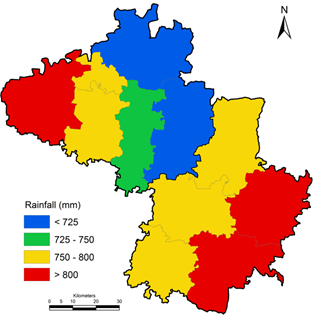
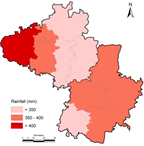
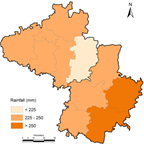
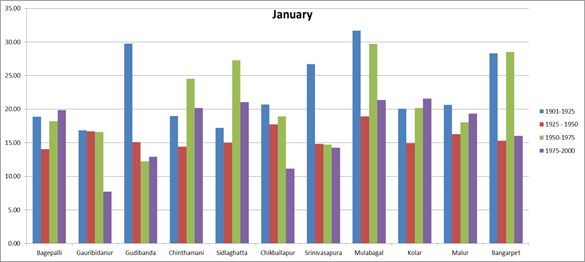
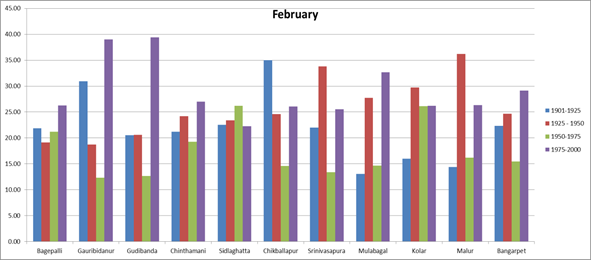
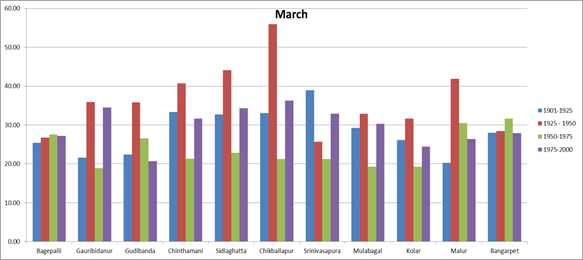
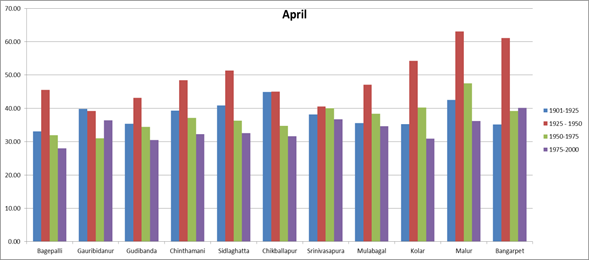
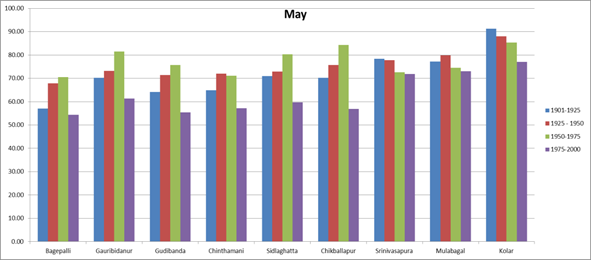
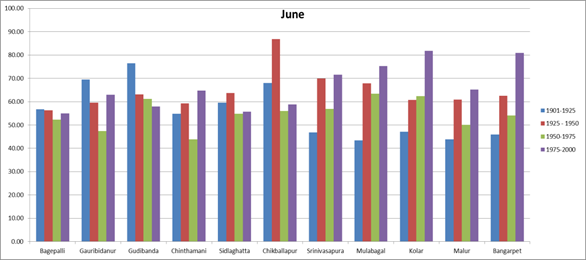
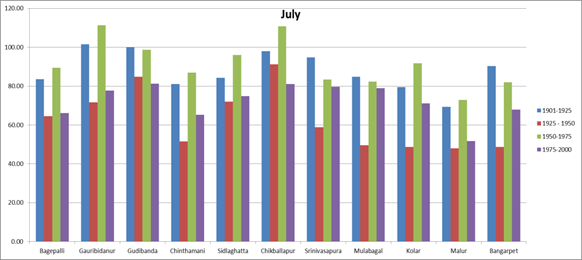
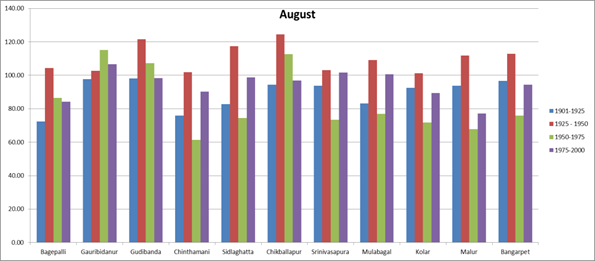
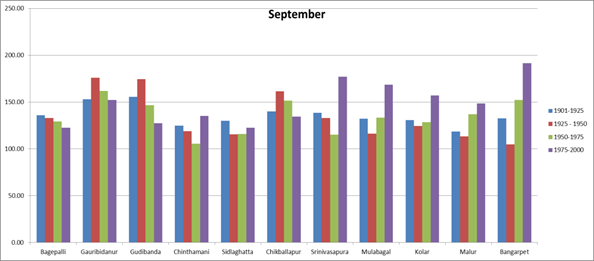
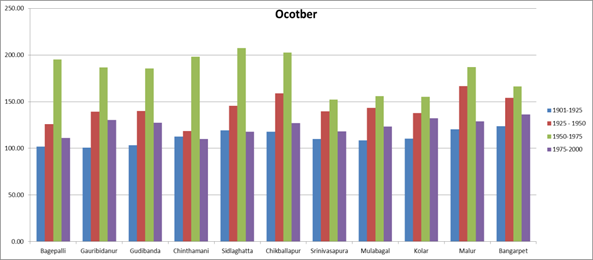
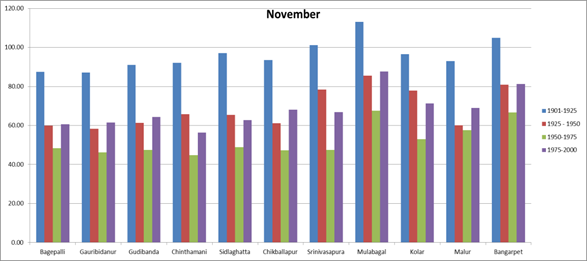
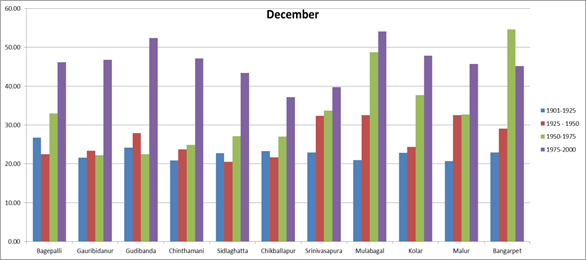
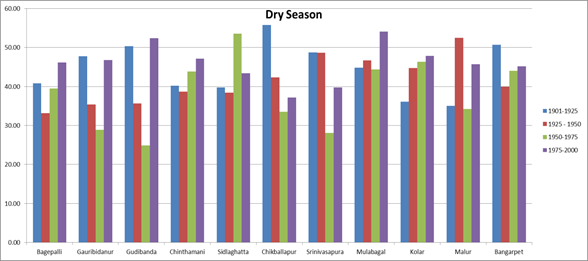
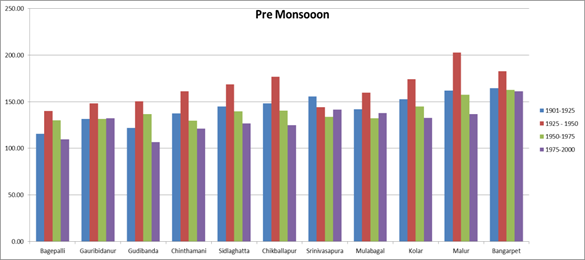
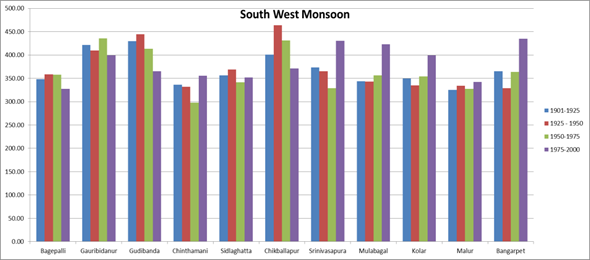
Month and season wise spatial variability is depicted in Figure 3.7. All taluks receives 75-100 mm rainfall during July-August and 100-125 mm during October-November. The region 700-750 mm during pre monsoon and 800-850 mm during north east monsoon. Similar analyses done for taluk is depicted in Figure 3.8.
Table 3.5: Rainfall frequency distribution, Chikkaballapura (Rainfall in mm)
Frequency |
Bagepalli |
Chikkaballapur |
Chinthamani |
Gouribidnur |
Gudibanda |
Shidlaghatta |
< 400 |
15 |
4 |
5 |
10 |
6 |
5 |
400 - 500 |
20 |
9 |
21 |
18 |
5 |
19 |
500 - 600 |
22 |
25 |
27 |
19 |
14 |
17 |
600 - 700 |
25 |
20 |
23 |
14 |
25 |
23 |
700 - 800 |
12 |
12 |
18 |
20 |
21 |
14 |
800 - 900 |
10 |
14 |
14 |
16 |
12 |
15 |
900 - 1000 |
5 |
12 |
1 |
9 |
15 |
12 |
> 1000 |
4 |
17 |
4 |
7 |
15 |
8 |
Table 3.6: Rainfall dependability, Chikkaballapur district (Rainfall in mm)
Dependability |
Bagepalli |
Chikkaballapur |
Chinthamani |
Gouribidnur |
Gudibanda |
Shidlaghatta |
< 400 |
100% |
100% |
100% |
100% |
100% |
100% |
400 – 500 |
87% |
96% |
96% |
91% |
95% |
96% |
500 – 600 |
69% |
88% |
77% |
75% |
90% |
88% |
600 – 700 |
50% |
66% |
53% |
58% |
78% |
66% |
700 – 800 |
27% |
49% |
33% |
46% |
56% |
49% |
800 – 900 |
17% |
38% |
17% |
28% |
37% |
38% |
900 – 1000 |
8% |
26% |
4% |
14% |
27% |
26% |
> 1000 |
4% |
15% |
4% |
6% |
13% |
15% |
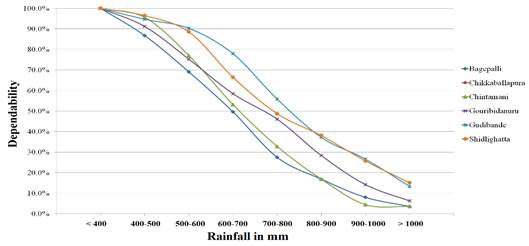
Figure 3.6: Rainfall dependability, Chikkaballapura District, Taluk wise
Table 3.7: Return Period in years, Chikkaballapura (Rainfall in mm)
Return period |
Bagepalli |
Chikkaballapur |
Chinthamani |
Gouribidnur |
Gudibanda |
Shidlaghatta |
< 400 |
8 |
28 |
23 |
11 |
19 |
23 |
400 - 500 |
6 |
13 |
5 |
6 |
23 |
6 |
500 - 600 |
5 |
5 |
4 |
6 |
8 |
7 |
600 - 700 |
5 |
6 |
5 |
8 |
5 |
5 |
700 - 800 |
9 |
9 |
6 |
6 |
5 |
8 |
800 - 900 |
11 |
8 |
8 |
7 |
9 |
8 |
900 - 1000 |
23 |
9 |
113 |
13 |
8 |
9 |
> 1000 |
28 |
7 |
28 |
16 |
8 |
14 |
 |
|
|
|
January |
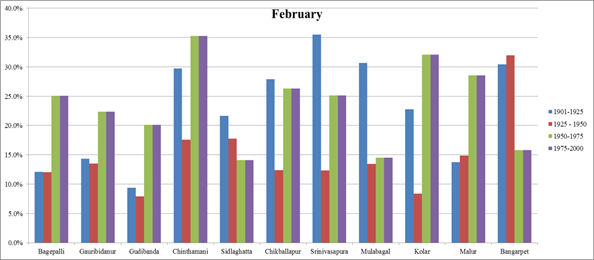
February |
March |
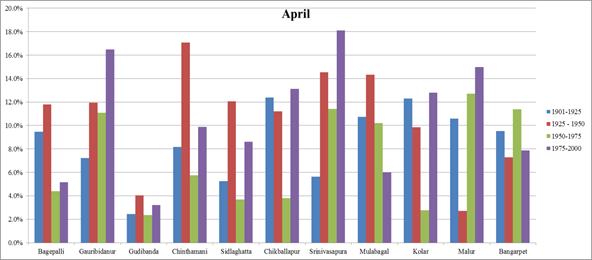
April |
|
|
|
|
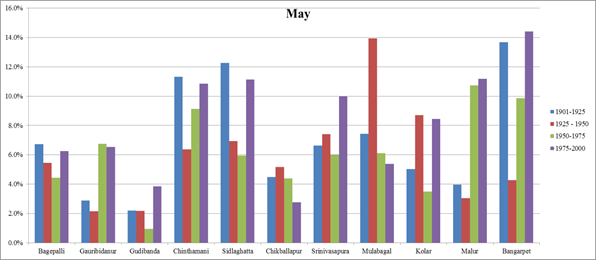
May |
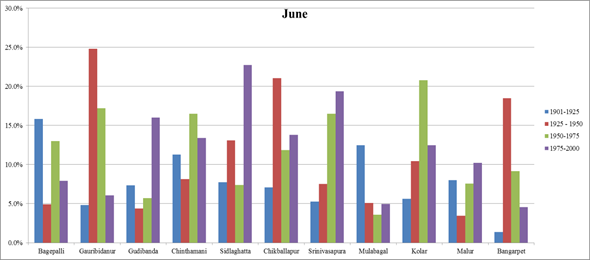
June |
July |
August |
|
|
|
|
September |
October |
November |
December |

|
|
|
|
Dry Season |
Pre Monsoon |
|
|
South-West Monsoon |
North-East Monsoon |
Annual |
Figure 3.7: Rainfall distribution
 |
|

|
|
January |
February |
March |
April |
|
|
|
|
May |
June |
July |
August |

|
|
|
|
September |
October |
November |
December |
|
|
|
|
Dry Season |
Pre Monsoon |
|
|
South-West Monsoon |
North-East Monsoon |
Annual |
Figure 3.8: Taluk wise Rainfall distribution
 |
January |
|
February |
|
March |
|
April |
|
May |
|
June |
|
July |
|
August |
|
September |
|
October |
|
November |
|
December |
|
Dry Season |
|
Pre Monsoon |
|
South West Monsoon |
|