|
|
ENVIS Technical Report 125, September 2017 |
 |
Ecologically Sensitive Regions in the Kali River Basin, Karnataka:
Delineation based on Ecological Principles and People’s Livelihood |
 |
ECOLOGICAL SENSITIVE REGIONS (ESR) OF KALI BASIN
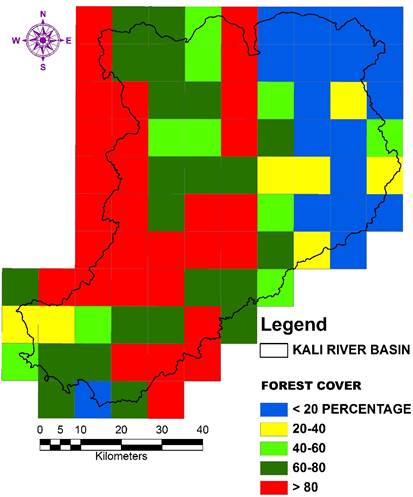
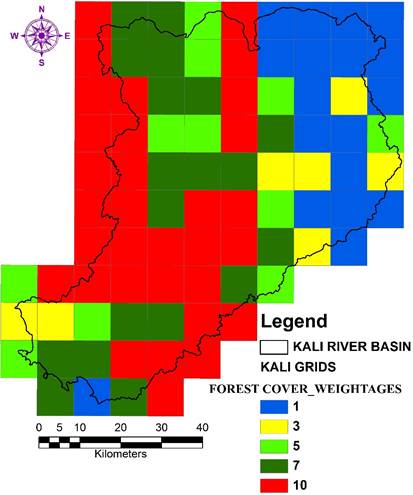
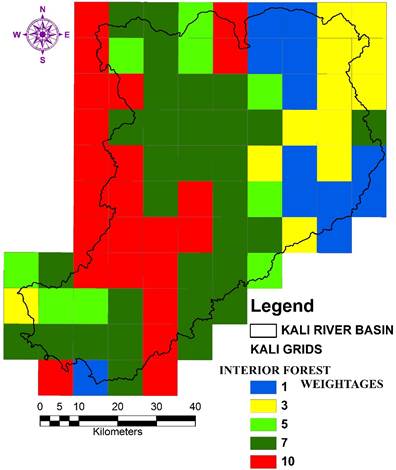
ESR demarcation was done to get a detailed picture of Kali basin considering various themes for conservation planning. The various themes are selected and evaluated based on literature and field-based measurements. The land use analysis highlights (Figure 6a) the major forest cover (> 80%) has confined to KTR region, eastern parts are totally degraded due to higher pressure. The natural forest cover left today is 54.94 % only. The wide-scale land clearing and subsequent agricultural expansion, exotic plantations resulted in damage of large patches. The major developmental projects further disturbed the landscape and reduced the distribution of forest cover. The forest cover weightages (Figure 6b) shows higher, moderate ranking is observed in KTR and its surrounding regions. The interior forest cover is considered as another important variable, which emphasizes conservation connectivity and ecological functionalities (Figure 7a). The cultivation in the nearby plots and roads are badly affecting natural cover. The more edge and perforated patches are forming in the landscape, reveals loss of connectivity and largest forest patches. The higher interior forest can be seen in grids of Supa taluk (Figure 7b) and gained higher weightages. The plains (Haliyal, Hubli, Belgaum portions) are expressing least weightage (1, 3) due to more disturbed forest cover with least or no interior forest coverage.
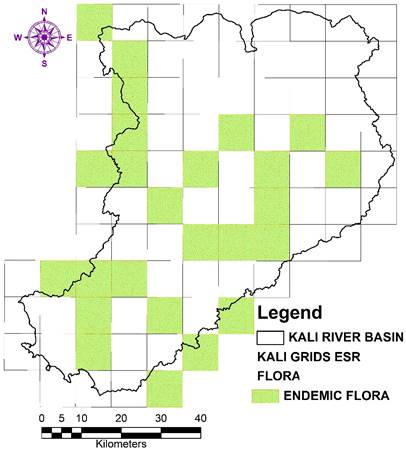
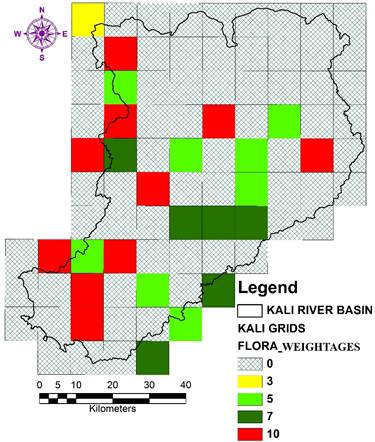
The ecology of Kali basin was analyzed through prevailing patterns of biodiversity such as endemic flora, fauna, the biomass of forests, the status of conservation reserves etc. These information was compiled from literature review as well as field-based measurements. Field data was collected using pre-calibrated GPS (Global positioning System), which provided co-ordinates of the location - latitude, longitude and altitude. These information were plotted to understand the spatial patterns of distribution and the respective habitats. The Figure 8a, b gives the spatial distribution of endemic flora and its weightages.
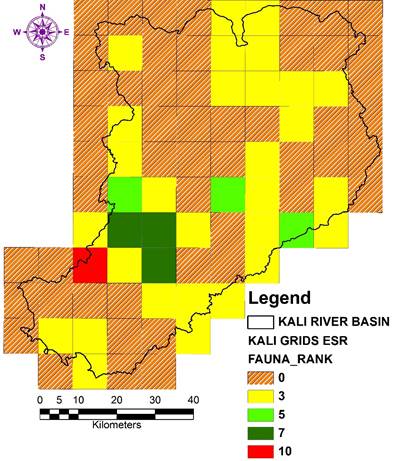
The region is home to very rare and endangered wildlife (Figure 9a). Main predators are tiger (Panthera tigris), leopard, wild dog (dhole) and sloth bear. Leopards are in good number and wild dogs are in very less number, usually sighted in Kulgi and Phansoli ranges of Dandeli. Sloth bears are in very good number and these are frequently sighted in Ambikanagar, Virnoli, Bhagavati. Prey animals are barking deer, spotted deer (Axis axis), wild boar, sambar (Cervus unicolor), gaur (Bos gaurus). The region has an important elephant corridor between Karnataka and Maharashtra with at least 47 elephants which are frequently sighted near Sambrani, Bommanahalli dam backwaters. One can also find Malabar Giant Squirrel, Slender Loris etc. Some of the important birds are Malabar Trogon, Malabar Pied Hornbill, Malabar Grey Hornbill, Indian Grey Hornbill, Great Indian Hornbill, Emerald Dove, Ceylon Frog mouth, Pompador Pigeon etc. Kali river accommodates at least 200+ marsh crocodiles and a good number of these can be sighted near Dandelappa temple in Dandeli town. Another rare reptile found is Draco (Flying Lizard) which can be easily sighted near Mandurli IB, Anshi Nature Camp, Sathkhand falls. There are a wide variety of snakes can be found i.e., King Cobra, Cobra, Malabar Pit Viper, Hump nosed pit Viper, Bamboo Pit Viper, Kraft, Ornate flying snake, wolf snake etc. There is also a wide variety of butterflies found in the reserve. Some of them are Crimson Rose, Common Rose, Leaf, Clipper, Tigers, Southern Bird wing, Cruiser etc. So, higher weightages (10) are assigned for grids (Figure 9b) covering all endemic species and least were given as 3 for non-endemic fauna.
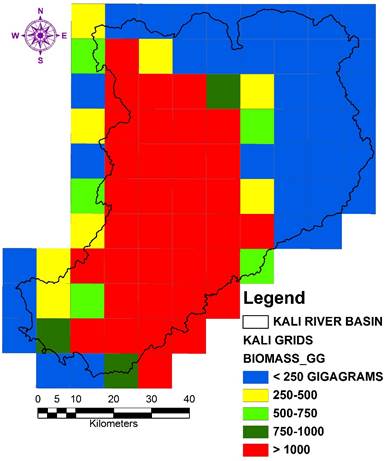
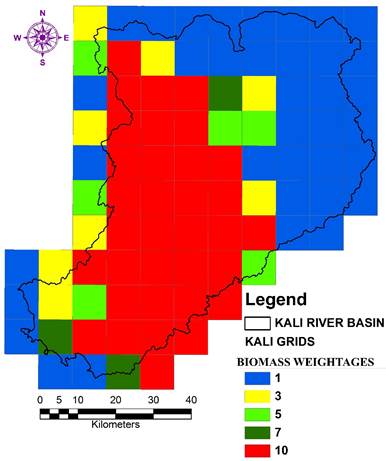
Biomass is considered as another significant variable in the analysis. The biomass data of Ramachandra et al., 2013 is considered as a base to derive the important regions of biomass and their protection. The analysis was calculated based on total standing biomass forest's vegetation (as per Brown, 1997; Ramachandra et al., 2000) and using field data with the remote sensing data. The dataset has used multiple regression equations for various regions. Statistically, significant regression equations were obtained for computation. The field transacts wise basal area were estimated using allometric equations. The basal area is also computed using regression equations and compared with field transact wise estimations. The biomass at each grid wise is estimated based on forest coverage (Figure 10a). The forests of Supa region have higher biomass (>1200 Gg) and eastern part deciduous to dry deciduous forests of Haliyal region have least biomass (< 200 Gg). The higher biomass regions are assigned greater weightages and vice versa (Figure 10b). Net Carbon uptake by the forests of is estimated as half of the biomass as per standards and literature. Since these regions are warehouse of carbon and degrading or disturbing these regions will result in a higher carbon emission with the loss of carbon sequestration potential. This will lead to an imbalance in the ecosystem and global warming, so higher conservation values are assigned (Figure 11a, b). The uniform higher weightages (Figure 12a, b) are assigned to KTR as it is acting as key eco-sensitive regions with diverse biodiversity.
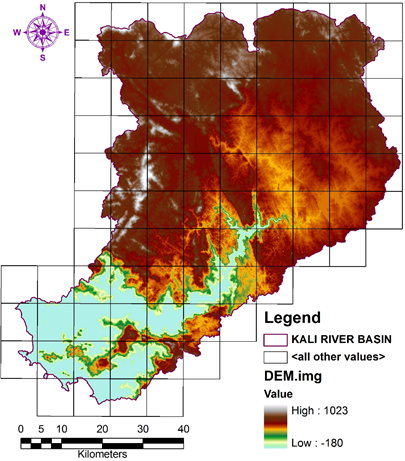
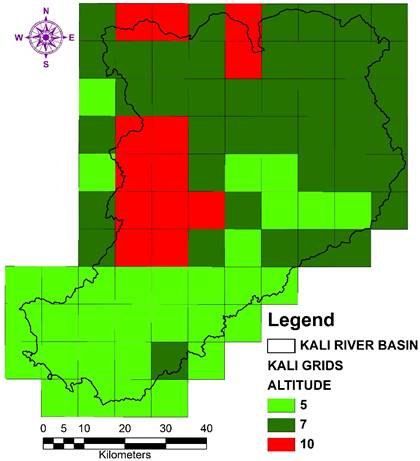
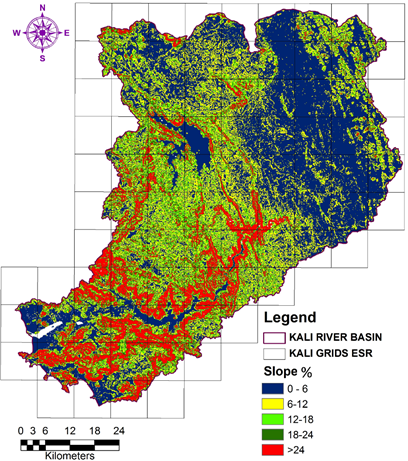
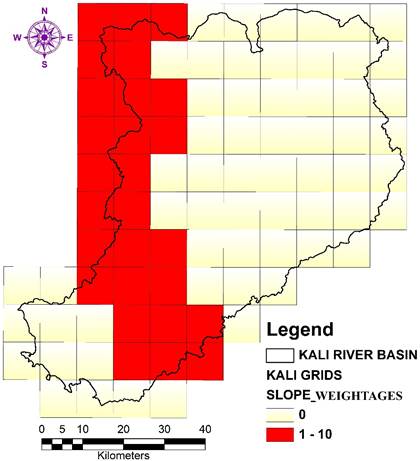
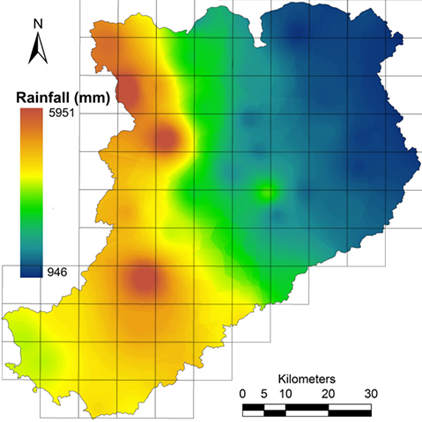
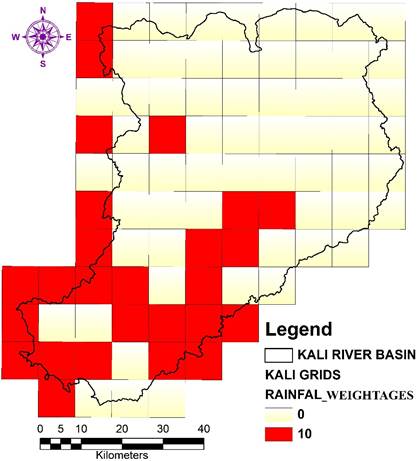
Geo-climatic information of region has been analyzed to identify sensitive zones by considering altitude, slope, and rainfall. The high altitude regions are prone to landslides due to heavy rain, has extreme weather conditions, low humidity. The Figure 13a shows the altitude map of the district, highest elevation is 1758 m in Supa taluk. The weightage map is generated by considering > 600 mt as a higher priority for conservation and > 400 m is moderate and rest is least concern (Figure 13b). Slope map (Figure 14a) is generated to identify the regions which are more sensitive; alteration of these regions will have a higher impact. Increase in the population makes people move towards sensitive areas like highlands without considering the slope because of soil fertility, market based economy and agricultural intensification. In such areas, land scape disturbances will lead to soil erosion, landslides, secondary plant succession, and ultimately to land abandonment. The slope > 12 degrees is considered as a more sensitive region and assigned higher weightage (Figure 14b). The rainfall pattern of the district is analyzed to mark the sensitive regions for conservation. Most of the KTR region (Figure 15a) is falling in the high rainfall zone, except eastern parts of Haliyal. The endemic species are well distributed in higher rainfall region. The diversity, endemism, and rainfall are interrelated each other. The disturbance in these regions will have a major impact on the landscape. The Figure 15b shows weightage map considering higher rainfall gradient with greater weightage followed by moderate and low. Hydrology of the region is analyzed by sub basin wise to account perennial, seasonal flows of the region. Perennial flows of a region depict health of the ecosystem. The Figure 16a shows the stream flow at each grid of the district. The KTR, Supa region shows water availability of 12 months in the streams due to higher rainfall and forest cover. The weightages are assigned (Figure 16b) by considering perennial regions as high and seasonal flows as lower.
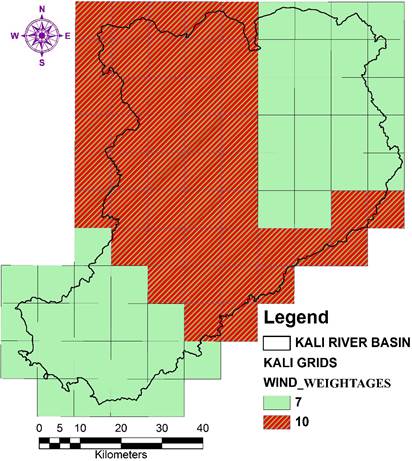
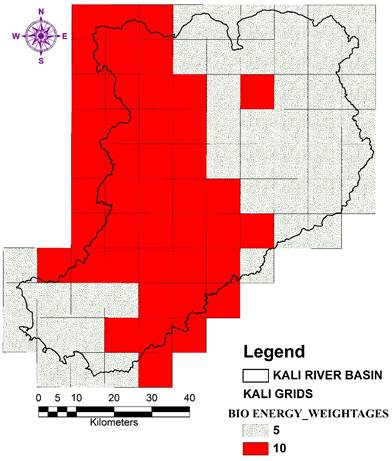
Environmentally sound alternative sources of energy are considered for prioritization to highlight the potentiality of them. Solar, Wind, Bioenergy data sets are collected and analyzed and weightages assigned (Figure 17-19). The entire region receives an average solar insolation of 5.42 kWh/m2/day annually and has more than 300 clear sunny days. This solar potential can be utilized to meet the domestic and irrigation electricity demand. Domestic demand of the household in a rural region is about 50 to 100 kWh per month. The solar potential assessment reveals that domestic demand can be supplied by installing rooftop SPV modules since less the 5% of the rooftop is required in the majority of the houses and irrigation demand can be met by installing PV modules in a wasteland where less than 3% of available wasteland area is sufficient. Bioresource availability is computed based on the compilation of data on the area and productivity of agriculture and horticulture crops, forests and plantations. Sector-wise energy demand is computed based on the National Sample Survey Organisation (NSSO study) data, primary survey data and from the literature. The supply/demand ratio in the district ranges from less than 0.5 to more the 2. If the ratio is less than 1 (demand >supply) then that place is fuelwood deficit place and where the ratio is more than 1 (supply >demand) then that place is referred as fuelwood surplus region. Wind resource assessment shows Wind speed varies from 1.9 m/s (6.84 km/hr.) to 3.93 m/s (14.15 km/hr.) throughout the year with a minimum in October and maximum in June and July. Hybridizing wind energy systems with other locally available resources (solar, bioenergy) would assure the reliable energy supply to meet the energy demand at decentralized levels.
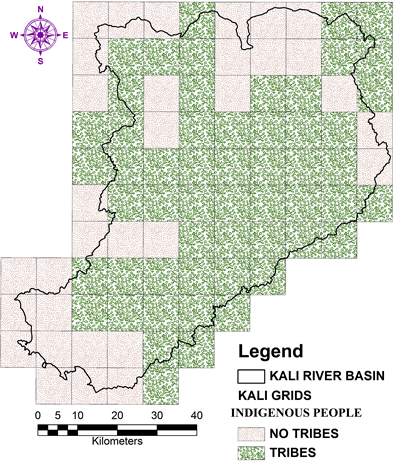
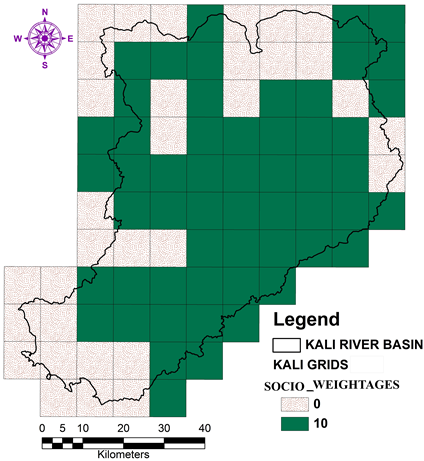
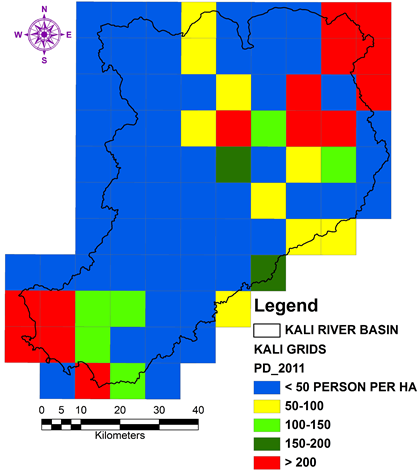
The forest dwelling communities of the region are considered as one of the key variables in prioritization (as per Forest Dwellers Act 2005 or Forests Rights Act 2005). These people are directly and indirectly being contingent on forest resources. The forest dwelling communities are Kunbis, Siddis, Goulis, Gondas. They are socially and politically backward and most of them depend on casual labor, trading forest products for their livelihood. The presence of tribes considered as higher weightages and absence is assigned least value (Figure 0a, b). Population density is considered as another proxy of ESR mapping. The population density of each grid is analyzed (Figure 21a) based on census data of 2011. It is evident that higher the population present, higher the resource extraction (Figure 21b). The higher population density has considered as least priority weightages (1) and lower density regions are projected as higher conservation priority weightages (10).
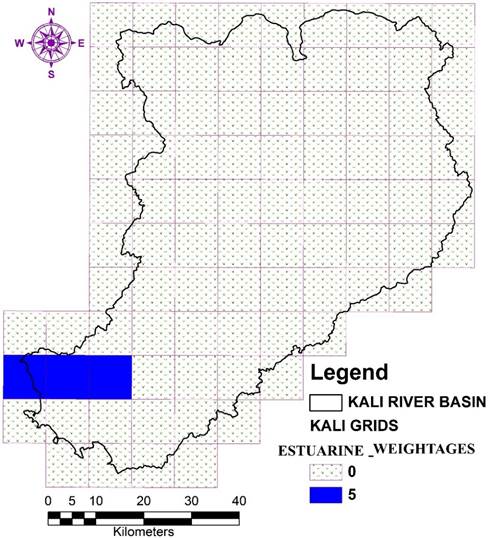
Estuarine ecosystems are a tiny ribbon of land, but the emissions from their destruction are nearly one-fifth of those attributed to deforestation worldwide (Pendelton et al., 2012). The major mangrove species present are Rhizophora mucronata, Sonneratia alba, Avicennia marina, Avicennia officinalis, Kandelia candel, Rhizophora apiculata, Sonneratia caseolaris. The farmers also plant rows of mangrove trees just outside these bunds to fortify them from collapse. This traditional system of estuarine cultivation with mangrove planting was a sustainable system. Kali Estuary has major dams with hydro power stations have affected mangroves, fish yield, and other substances. The weightages are assigned as per the data analyzed emphasizing productivity (Figure 22).
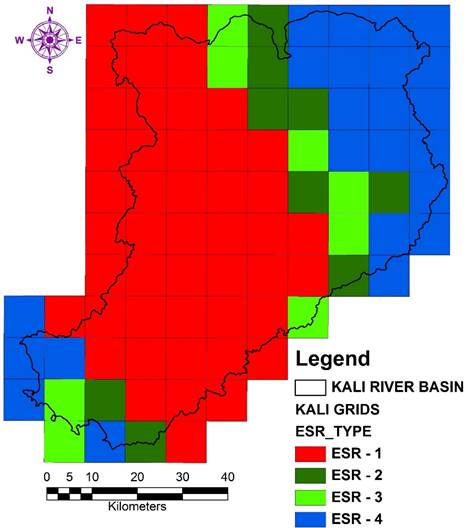
The weightage metric score associated with each theme has been computed and it resulted in ecologically sensitive regions (ESR) of 1, 2, 3 and 4. Figure 23 shows 47 grids represent ESR 1, 9 grids represent ESR 2, 8 grids represent ESR 3 and the rest 23 grids represent ESR 4. The 54% of the area of grids represents ESR 1, 10.34% of the area shows ESR 2, 9.19 % of the area shows ESR 3 and only 26.44 % area covers ESR 4. The Figure 24 and table 5 shows village level ecological sensitive region map with 4 categories. The ESR 1 represents zone of highest conservation, no further degradation allowed. ESR 1 can be treated as a high sensitive region of the district and more conservation is to be imposed by regulatory authorities as well as VFCs (Village forest committees). ESR 2 represents a zone of higher conservation and forms a transition for highest conservation and moderate conservation regions. ESR 3 represents moderate conservation region and only regulated development is allowed in these areas. ESR 4 represents least diversity areas and the developments are allowed as per the requirement by strict vigilance from regulatory authorities. It is recommended that these regions are also has a lot of scope for further enrichment of environment by stakeholders and forest department intervention. In ESR 2 & ESR 3 further developments are allowed by an only critical review from regulatory and extensive consultations with stakeholders. Small scale tourism should be encouraged adopting benefit sharing with local communities such as homestay, spice farms, eco-friendly boating etc. The uncontrolled development should be discouraged in and around of pristine lakes, primeval forest patches, perennial water bodies. The site specific (clustered base) sustainable developments can be taken up at each panchayat, which least affect the ecosystem.
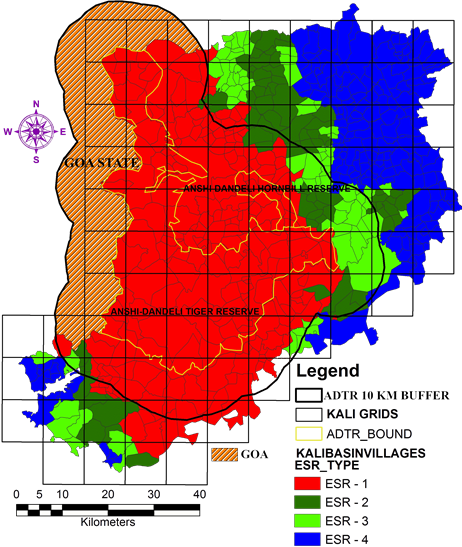
The village wise ESR delineation has shown in Figure 24 and Annexure 2 provides taluk wise categorized ESR villages. The village wise ESR analysis shows Kali river basin covers total 524 villages of across three districts (Table 3). The ESR-1 shows 203 villages, ESR-2 shows 73 villages, ESR-3, 4 shows 77 and 181 villages respectively. The Uttara Kannada district has 331 villages out of which 190 villages depict ESR-1. Forests of these villages need to be protected and further degradation should be allowed. The controlled and regulated activities in each ESR region has shown in Table 4. The ADTR region its periphery of Kali basin is shown as a high conservation priority zone (Figure 25) signifies the need for conservation by arresting further degradation.
Table 3: ESR Villages under various districts of Kali river basin.
SNO |
DISTRICT NAME |
ESR-1 |
ESR-2 |
ESR-3 |
ESR-4 |
TOTAL |
1 |
UTTARA KANNADA |
190 |
45 |
48 |
48 |
331 |
2 |
BELGAUM |
13 |
25 |
27 |
20 |
85 |
3 |
DHARWAD |
0 |
3 |
2 |
103 |
108 |
KALI RIVER BASIN |
203 |
73 |
77 |
171 |
524 |
Table 4: Activities that can be allowed in ESR -1, 2 3 & 4.
SNO |
ACTIVITIES |
ECOLOGICALLY SENSITIVE REGIONS |
ESR-1 |
ESR-2 |
ESR-3 |
ESR-4 |
1 |
ENERGY |
ü |
ü |
ü |
ü |
|
|
û |
ü |
ü |
ü |
|
û |
ü |
ü |
ü |
- Coal based (Thermal power)
|
û |
û |
û |
û |
|
û |
û |
û |
ü |
|
û |
û |
û |
û |
|
û |
û |
û |
ü |
|
û |
û |
û |
û |
2 |
FORESTS |
û |
û |
û |
û |
- Land use change (Forest to non-forest usages)
|
|
û |
û |
û |
û |
- Extraction of medicinal plants (with strict regulations)
|
û |
û |
ü |
ü |
- Forest improvement through VFCs
|
ü |
ü |
ü |
ü |
|
ü (Strict regulation by department) |
ü |
ü |
ü |
3 |
AGRICULTURE |
ü |
ü |
ü |
ü |
|
|
ü |
ü |
ü |
ü |
- Land use change / Encroachments
|
û |
û |
û |
û |
|
- Genetically modified crops
|
û |
û |
û |
û |
|
|
ü |
ü |
ü |
ü |
4 |
HORTICULTURE |
ü |
ü |
ü |
ü |
|
- Nitrogen and Phosphorus (N&P) fertilizers
|
û |
û |
û |
ü Dosage as prescribed by Agriculture department |
|
û |
û |
û |
û |
|
û |
û |
û |
ü |
|
- Watermelon & Muskmelon farming
|
û |
ü |
ü |
ü |
5 |
INDUSTRIES (Larger scale) |
ü |
ü |
ü |
ü |
- Agro processing industries
|
- Information Technology industries (IT)
|
û |
û |
ü |
ü |
- Red category (Polluting) industries
|
û |
û |
û |
û |
|
û |
û |
ü |
ü |
|
- New establishment of Industries
|
û |
û |
û |
ü (Allowed only after critical review by local stake holders and experts) |
|
- Nonpolluting (Green) Industries
|
û |
û |
ü |
ü |
6 |
INDUSTRIES (Small scale) |
û |
ü |
ü |
ü |
|
- Domestic (Home based) industries
- Papad
|
ü |
ü |
ü |
ü |
|
ü |
ü |
ü |
ü |
- Areca nut processing & Coir industries
|
û |
ü |
ü |
ü |
- Milk products and processing
|
ü |
ü |
ü |
ü |
|
ü |
ü |
ü |
ü |
- Fruit processing (Ex: Kokum Juice (Garcinia indica))
|
ü |
ü |
ü |
ü |
|
ü |
ü |
ü |
ü |
- Bee keeping and bee nurseries
|
ü |
ü |
ü |
ü |
- Pongamia plantations for biofuel (in private lands)
|
û |
ü |
ü |
ü |
- Bio pesticides manufacturing
|
û |
ü |
ü |
ü |
- Poultry farms and powdered eggs
|
û |
ü |
ü |
ü |
- Vegetable dyes; fruits and vegetables preservation
|
ü |
ü |
ü |
ü |
- Medicinal plants cultivation and processing
|
ü |
ü |
ü |
ü |
- Aromatic plants and essential oil distillation; orchids and cut flowers harvesting industries
|
û |
ü |
ü |
ü |
7 |
TOURISM INDUSTRY |
û |
ü |
ü |
ü |
|
- Organic village and home stay
|
ü |
ü |
ü |
ü |
|
ü |
ü |
ü |
ü |
- VFC managed home stay tourism in higher forest cover regions and protected areas
|
û |
ü |
ü |
ü |
- Arts and handicrafts museum and trade center
|
ü |
ü |
ü |
ü |
8 |
MINING AND MINERAL EXTRACTION |
û |
û |
û |
û |
|
|
û |
û |
û |
û |
|
û |
û |
û |
û |
|
û |
û |
û |
ü |
|
û |
û |
û |
ü |
- Sand extraction (on sustainable basis by
Ban on exporting) |
û |
û |
ü |
ü |
9 |
WASTE DISPOSAL |
û |
û |
û |
û |
- Hazardous waste processing units
|
|
û |
û |
û |
ü (For composting and manure preparation) |
|
û |
û |
û |
ü (Treatment plants (STP) for processing) |
- Recycling and waste processing and units
|
û |
û |
û |
ü(compliant with PCB) |
10 |
TRANSPORTATION |
û |
û |
û |
ü(Allowed only after strict EIA) |
|
- Rail and freight corridors
|
Subject to EIA; Strict regulation and social audit |
- Up gradation of existing infrastructure
|
û |
û |
ü(Subject to
EIAs, strict regulation and
social audit) |
ü |
Remarks |
- The ESR-1 represents zone of highest conservation, no further degradation allowed. ESR-2 has the potentiality to become as ESR-1 provided with strict regulations and improvement of forests and its environs by more protection. A small change in ESR-2 will have more adverse effects in ESR-1.
- Forest Rights Act to be implemented in its true spirit by reaching out to people.
- Monoculture plantations are not allowed, existing exotics should be replaced by planting endemic species.
- Promote decentralized electricity, use of renewable energy sources such as (solar, wind power).
- The local bio resource based industry should be promoted. All should be strictly regulated and be subject to social audit.
- Adapt development projects which will have a least environmental impact by involving local community members in decision making and environmental monitoring.
- No new major roads, railway lines are allowed, except when highly essential and subject to EIA, by imposing strict regulation and social audit.
- Tourism Master Plan should be based on MOEF regulations (after taking into account social and environmental costs).
- Controlled activities are permitted based on socio economic importance and activities such as depriving wetlands, natural forests, the introduction of alien invasive species are not permitted.
|
KTR region is a sensitive habitat for wild flora and fauna. Asper Wildlife Conservation Strategy 2002, Union government had proposed a 10 km buffer region as eco fragile zones (Eco-Sensitive Zones) around protected areas / national parks under Environmental (Protection) Act, 1986. Eco-Sensitive Zones are being specified by the union government as transition zones around protected forest areas, that would minimize forest depletion and human-animal conflict. These are intended to provide habitat improvement, enhance the environmental services, reduce edge effects, connectivity, reducing fragmentation of forests and also provides a physical barrier from human encroachment. Eco-Sensitive Zones are areas adjacent to protected areas/ national parks, on which land use is partially restricted to give an added layer of protection while providing valued benefits to neighboring rural communities. But, in the last two years due to various political pressures, the Environment Ministry approved a reduction of Eco-Sensitive Zones (from 10 km to 100m) by a series of notifications for a number of national parks and wildlife sanctuaries. Honorable Supreme Court while taking serious objections to these senseless reductions, has directed that a 10-km limit was to be treated as the Eco-Sensitive Zones. The guidelines for Eco-Sensitive Zones proposed that the boundary had to be site specific, decided in consultation with a field based team comprising representatives from the forest department, revenue department and Panchayat Raj institution. The objective of Eco-Sensitive Zones are not anti-people and do not intend to hamper their everyday activities. But, it makes sure under a legal framework to support ecologically sensitive habitats from further degradation of forests.
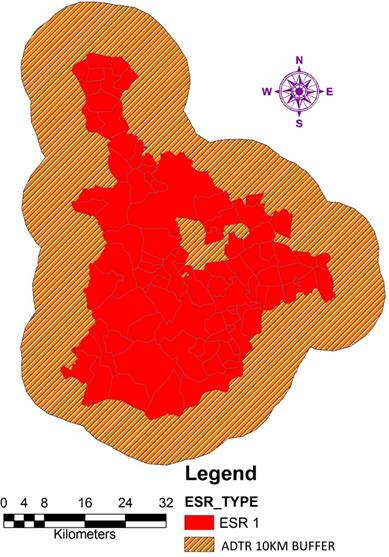
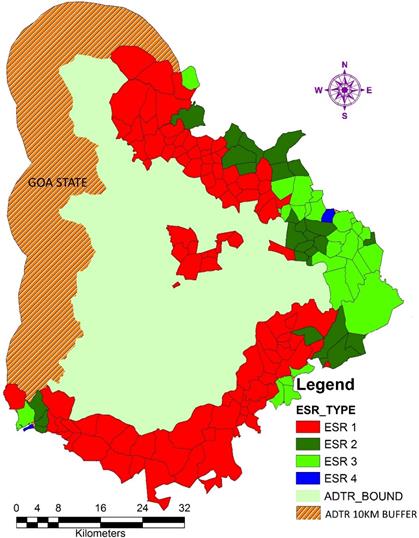
In the case of KTR, there is a serious move of reducing its Eco-Sensitive Zone (reduction of area by 75%) to 100 m and also reducing the total area of the reserve by 30 %. In this regard, Figure 26 represent ESR of KTR region with 85 villages covered under three taluks. Annexure 3 provides taluk wise village list for KTR region. Figure 27 represents villages covered in 10 km Eco-Sensitive Zones of KTR region. The eco-sensitive region covers total 155 villages in which 97 falls in ESR-1, 26 falls under ESR-2 and 28, 4 falls under ESR-3,4 respectively (Annexure 4). The Eco-Sensitive Zone needs to be enriched with native species to reduce further degradation. The state government should focus on sustainable development than de-notifying region.
LAND |
Figure 6a: Forest cover of Kali river basin |
Figure 6b: Forest cover weightage map |
|
|
Figure 7a: Interior forest coverage of Kali basin |
Figure 7b: Interior forest weightage map |

|
|
Ecology |
Figure 8a: Floral diversity of Uttara Kannada |
Figure 8b: Weightages of flora |
|
|
Figure 9a: Faunal diversity |
Figure 9b: Weightages of fauna |

|
|
Figure 10a: Biomass of forests in Kali basin |
Figure 10b: Biomass weightages of forests |
|
|
Figure 11a: Carbon sequestration in Kali basin |
Figure 11b: Weightages |

|

|
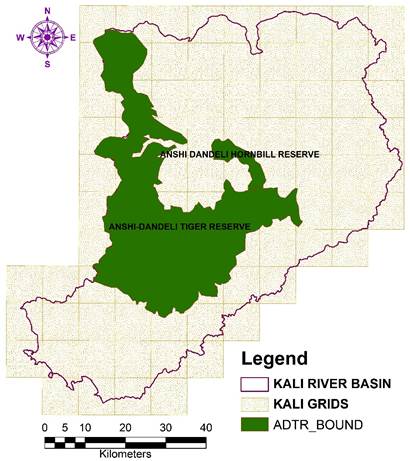
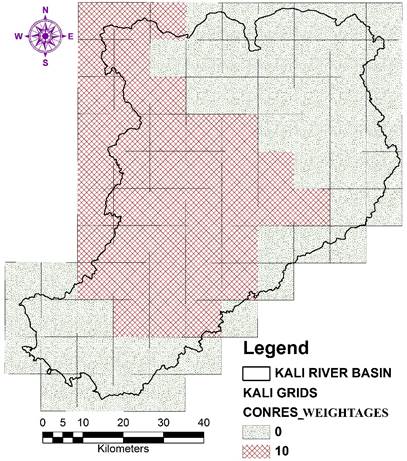
Figure 12a: Conservation reserves of Kali basin |
Figure 12b: Weightages of reserves |
|
|
Geo-Climatic |
Figure 13a: Altitude (m) of Uttara Kannada |
Figure 13b: Weightages of altitude (m) |
|
|
Figure 14a: Slope (%) map of Uttara Kannada |
Figure 14b: Weightage map of slope values |
|
|
Figure 15a: Rainfall map of Uttara Kannada |
Figure 15b: Weightage map based on rainfall |
|
|
Hydrology |
Figure 16a: Stream flow status of Uttara Kannada |
Figure 16b: Weightages for stream flow |

|

|
Energy |
Figure 17: Solar energy |
Figure 18: Wind energy |

|
|
Figure 19(a): Bio energy |
Figure 19(b): Weightages based on productivity |

|
|
Social aspects |
Figure 20a: Forest dwelling communities of Uttara Kannada |
Figure 20b: Weightage map of forest dwelling communities |
|
|
Figure 21a: Population density map |
Figure 21b: Weightage associated with population density |
|

|
Estuarine diversity |
Figure 22: Estuarine diversity weightage map |
|
Figure 23: Ecologically Sensitive Regions of Kali river basin |
|
Figure 24: Ecologically Sensitive Regions of across various villages of basin |

|
Figure 25: Ecologically Sensitive Regions of and KTR (ADTR) |
|
Figure 26: ESR map for villages of KTR (ADTR) |
|
Figure 27: Village wise Ecologically Sensitive Regions of KTR with 10 km buffer |
|
References:
- Bharath Setturu, Bharath Aithal, H., Sanna Durgappa, D., Ramachandra T. V., 2012, Landscape Dynamics through Spatial Metrics, Proceedings of India Geospatial Conference, Epicenter, Gurgaon, India, 7-9 February, 2012.
- Bharath Setturu, Rajan K S, Ramchandra T. V., 2014. Visualization of Forest Changes in Uttara Kannada, Vol. 8, Proceedings Lake 2014, 13-15 November.
- Cabral, A.I.R., Vasconcelos, M.J., Oom, D. and Sardinha, R., 2011. Spatial dynamics and quantification of deforestation in the central-plateau woodlands of Angola (1990–2009). Applied Geography, 31(3), pp.1185-1193.
- Cagnolo, L., Cabido, M. and Valladares, G., 2006. Plant species richness in the Chaco Serrano Woodland from central Argentina: ecological traits and habitat fragmentation effects. Biological Conservation, 132(4), pp.510-519.
- DeFries, R.S., Foley, J.A. and Asner, G.P., 2004. Land‐use choices: Balancing human needs and ecosystem function. Frontiers in Ecology and the Environment, 2(5), pp.249-257.
- DeFries, R.S., Rudel, T., Uriarte, M. and Hansen, M., 2010. Deforestation driven by urban population growth and agricultural trade in the twenty-first century. Nature Geoscience, 3(3), p.178.
- FAO, 2011. State of the World's Forests. Research and Extension, FAO, Viale delle Terme di Caracalla, 00153. Rome, Italy.
- Gibson, L., Lee, T.M., Koh, L.P., Brook, B.W., Gardner, T.A., Barlow, J., Peres, C.A., Bradshaw, C.J., Laurance, W.F., Lovejoy, T.E. and Sodhi, N.S., 2011. Primary forests are irreplaceable for sustaining tropical biodiversity. Nature, 478(7369), p.378.
- Hansen, A.J., DeFries R., 2007. Ecological mechanisms linking protected areas to surrounding lands Ecol. Appl., 974-988.
- Hansen, M.C., Potapov, P.V., Moore, R., Hancher, M., Turubanova, S., Tyukavina, A., Thau, D., Stehman, S.V., Goetz, S.J., Loveland, T.R. and Kommareddy, A., 2013. High-resolution global maps of 21st-century forest cover change. science, 342(6160), pp.850-853.
- Harper, K.A., Macdonald, S.E., Burton, P.J., Chen, J., Brosofske, K.D., Saunders, S.C., Euskirchen, E.S., Roberts, D.A.R., Jaiteh, M.S. and Esseen, P.A., 2005. Edge influence on forest structure and composition in fragmented landscapes. Conservation Biology, 19(3), pp.768-782.
- Kennedy, R.E., Townsend, P.A., Gross, J.E., Cohen, W.B., Bolstad, P., Wang, Y.Q. and Adams, P., 2009. Remote sensing change detection tools for natural resource managers: Understanding concepts and tradeoffs in the design of landscape monitoring projects. Remote sensing of environment, 113(7), pp.1382-1396.
- Kindstrand, C., Norman, J., Boman, M. and Mattsson, L., 2008. Attitudes towards various forest functions: A comparison between private forest owners and forest officers. Scandinavian Journal of Forest Research, 23(2), pp.133-136.
- Kivinen, S. and Kumpula, T., 2014. Detecting land cover disturbances in the Lappi reindeer herding district using multi-source remote sensing and GIS data. International Journal of Applied Earth Observation and Geoinformation, 27, pp.13-19.
- Lambin, E. F., Geist, H., Lepers, E., 2003. Dynamics of land use and land cover change in tropical regions. Environment and Resources, 28, 205–241.
- Laurance, W.F., Lovejoy, T.E., Vasconcelos, H.L., Bruna, E.M., Didham, R.K., Stouffer, P.C., Gascon, C., Bierregaard, R.O., Laurance, S.G., Sampaio, E., 2002. Ecosystem decay of Amazonian forest fragments: a 22-year investigation. Conservation Biology 16, pp. 605–618.
- Li, M., Huang, C., Zhu, Z., Wen, W., Xu, D. and Liu, A., 2009. Use of remote sensing coupled with a vegetation change tracker model to assess rates of forest change and fragmentation in Mississippi, USA. International Journal of Remote Sensing, 30(24), pp.6559-6574.
- Lillesand, T., Kiefer, R.W. and Chipman, J., 2014. Remote sensing and image interpretation. John Wiley & Sons, Newyork.
- Olson, D.M., Dinerstein, E., Wikramanayake, E.D., Burgess, N.D., Powell, G.V.N., Underwood, E.C., D’Amico, J.A., Itoua, I., Strand, H.E., Morrison, J.C., Loucks, C.J., Allnutt, T.F., Ricketts, T.H., Kura, Y., Lamoreux, J.F., Wettengel, W.W., Hedao, P., Kassem, K.R., 2001. Terrestrial ecoregions of the world: a new map of life on earth. BioScience 51, 933–938.
- MoEF, 2000. Report of the Committee on identifying parameters for designating Ecologically Sensitive Areas in India (Pronab Sen Committee Report).
- Myers, N., Mittermeier, R., Mittermeier, C., da Fonseca, G., Kent, J., 2000. Biodiversity hotspots for conservation priorities, Nature, 403 (6772), 853-858.
- Pan, Y., Birdsey, R.A., Fang, J., Houghton, R., Kauppi, P.E., Kurz, W.A., Phillips, O.L., Shvidenko, A., Lewis, S.L., Canadell, J.G. and Ciais, P., 2011. A large and persistent carbon sink in the world’s forests. Science, 333(6045), pp.988-993.
- Possingham, H.P., Wilson, K.A., Aldeman, S. J. and Vynne, C. H., 2006. Protected areas: goals, limitations, and design. Pages 509–551 in Groom, M.J., Meffe, G.K. and Carroll, C.R., editors. Principles of conservation biology. Third edition. Sinauer Associates, Sunderland, Massachusetts, USA.
- Ramachandra T.V. and Shruthi, B.V., 2007. Spatial mapping of renewable energy potential, Renewable and Sustainable Energy Reviews, 11(7):1460-1480.
- Ramachandra TV, Chandran MDS, Gururaja KV, Sreekantha (2007) Cumulative Environmental Impact Assessment, Nova Science Publishers, New York.
- Ramachandra, T.V., Setturu Bharath and Aithal Bharath., 2014. Spatio-temporal dynamics along the terrain gradient of diverse landscape, Journal of Environmental Engineering and Landscape Management, 22:1, 50-63, doi:http://dx.doi.org/10.3846/16486897.2013.808639.
- Ramachandra, T.V., Setturu, B. and Chandran, S., 2016. Geospatial analysis of forest fragmentation in Uttara Kannada District, India. Forest Ecosystems, 3(1), p.10.
- Ramachandra, T.V., Bharath, S. and Gupta, N., 2017. Modelling landscape dynamics with LST in protected areas of Western Ghats, Karnataka. Journal of Environmental Management, Aug 9, Article in press.
- Reddy, C.S., Satish, K.V., Jha, C.S., Diwakar, P.G., Murthy, Y.K. and Dadhwal, V.K., 2016. Development of deforestation and land cover database for Bhutan (1930–2014). Environmental monitoring and assessment, 188(12), p.658.
- Schmitt, C.B., Burgess, N.D., Coad, L., Belokurov, A., Besançon, C., Boisrobert, L., Campbell, A., Fish, L., Gliddon, D., Humphries, K. and Kapos, V., 2009. Global analysis of the protection status of the world’s forests. Biological Conservation, 142(10), pp.2122-2130.
- Vinay, S., Bharath, S., Bharath, H.A., Ramachandra, T.V., 2013. Hydrologic model with landscape dynamics for drought monitoring. In proceeding of: Joint International Workshop of ISPRS WG VIII/1 and WG IV/4 on Geospatial Data for Disaster and Risk Reduction, Hyderabad, November (pp. 21-22).
|
|
Dr. T.V. Ramachandra
Centre for Sustainable Technologies, Centre for infrastructure, Sustainable Transportation and Urban Planning (CiSTUP), Energy & Wetlands Research Group, Centre for Ecological Sciences, Indian Institute of Science, Bangalore – 560 012, INDIA.
E-mail : tvr@iisc.ac.in
Tel: 91-080-22933099/23600985,
Fax: 91-080-23601428/23600085
Web: http://ces.iisc.ac.in/energy
Bharath SetturuEnergy & Wetlands Research Group, Centre for Ecological Sciences, Indian Institute of Science, Bangalore – 560 012, INDIA.
E-mail: setturb@iisc.ac.in
Subash Chandran M DEnergy & Wetlands Research Group, Centre for Ecological Sciences, Indian Institute of Science, Bangalore – 560 012, INDIA.
E-mail: subhashc@iisc.ac.in
Rao G REnergy & Wetlands Research Group, Centre for Ecological Sciences, Indian Institute of Science, Bangalore – 560 012, INDIA.
E-mail: raogr@iisc.ac.in
Vishnu D Mukri
Energy & Wetlands Research Group, Centre for Ecological Sciences, Indian Institute of Science, Bangalore – 560 012, INDIA.
Joshi N VEnergy & Wetlands Research Group, Centre for Ecological Sciences, Indian Institute of Science, Bangalore – 560 012, INDIA.
E-mail: nvjoshi@iisc.ac.in
Citation: Ramachandra T V, Bharath Setturu, Subash Chandran M D, Rao G R, Vishnu D. Mukri, Joshi N V. 2017. Ecologically Sensitive Regions in the Kali River Basin, Karnataka: Delineation based on Ecological Principles and People’s Livelihood, ENVIS Technical Report 125, Sahyadri Conservation Series 68, Energy & Wetlands Research Group, CES, Indian Institute of Science, Bangalore 560012
| Contact Address : |
| |
Dr. T.V. Ramachandra
Energy & Wetlands Research Group,
Centre for Ecological Sciences, TE 15, New Biology Building, Third Floor, E Wing, [Near D Gate], Indian Institute of Science, Bangalore – 560 012, INDIA.
Tel : 91-80-22933099 / 22933503-extn 107
Fax : 91-80-23601428 / 23600085 / 23600683 [CES-TVR]
E-mail : cestvr@ces.iisc.ac.in, energy@ces.iisc.ac.in,
Web : http://wgbis.ces.iisc.ac.in/energy |
|