|
|
ENVIS Technical Report 125, September 2017 |
 |
Ecologically Sensitive Regions in the Kali River Basin, Karnataka:
Delineation based on Ecological Principles and People’s Livelihood |
 |
RESULTS
Spatiotemporal land use analysis: The forests of Kali river basin are acting as a rich resource base in the Western Ghats of Uttara Kannada district and providing a livelihood for various people. The land use analysis of Kali river basin depicts the spatiotemporal changes in this biodiversity-rich region from year 1973 to 2016 (Figure 4 and Table 1). The evergreen forest cover was lost due to hydroelectric, infrastructure projects and monoculture plantations from 61.79 to 38.5 % (1973-2016). The natural forest cover has been replaced by the colonial forest department with exotic species such as Acacia, Eucalyptus, and Teak etc. This has led to change in major forest cover of Dandeli, Haliyal, and parts of Supa regions. The construction of series of dams and reservoirs have submerged large-scale forest land by affecting ecology. The transmission lines of Kaiga nuclear powerhouse have bisected greater forest patches across the basin. The land conversion is major problem noticed i.e. conversion of forest to agriculture; agriculture to coco/areca nut plantations. The rehabilitation due to river valley projects, reservoirs have altered interior forests by the creation of more edges. The major portion of deciduous forest cover (7.82-2.24 %) in the eastern portion of the basin has been transformed to agriculture area from 9 to 17.7 % by 2016.
SNO |
Year |
1973 |
2016 |
Category |
Ha |
% |
Ha |
% |
1 |
Evergreen to semi evergreen forest |
314265.07 |
61.79 |
195829.13 |
38.50 |
2 |
Moist deciduous forest |
76713.55 |
15.08 |
72231.41 |
14.20 |
3 |
Dry deciduous forest |
39765.85 |
7.82 |
11369.70 |
2.24 |
4 |
Scrub forest/grass land |
12857.72 |
2.53 |
17138.54 |
3.37 |
5 |
Teak/Bamboo/Acacia/Eucalyptus/Other plantations |
8383.26 |
1.65 |
76666.09 |
15.07 |
6 |
Crop land |
46783.90 |
9.20 |
90086.56 |
17.71 |
7 |
Coconut/Areca nut /Cashew nut plantations |
54.26 |
0.01 |
8805.30 |
1.73 |
8 |
Open fields |
5703.57 |
1.12 |
9449.90 |
1.86 |
9 |
Built-up |
1985.22 |
0.39 |
8433.95 |
1.66 |
10 |
Water |
2068.93 |
0.41 |
18570.75 |
3.65 |
Total |
508581.33 |
Table 1: Temporal changes in land use of Kali river basin.

Figure 4: Land use dynamics in the Kali river basin.
Land uses in the KTR region (Figure 5) shows a forest loss from 91.5 to 71.85% due to protection and inaccessibility as compared to Kali river basin. The dense core forests were lost due to the construction of series of dams on river Kali and some area was replaced by plantations. The core forest remained, which is mostly concentrated Supa taluk and Kali river valley regions. Roads are another driver aid in the loss of core forest cover. The eastern portions of KTR region have major teal plantations constitute 7.6% of land mass. There is continuous pressure in the periphery area of KTR due to increase in the population of surrounding villages. The moist deciduous cover has gained by replacing semi-evergreen cover from 4.8 to 11.12 % due to degradation in northern portions. The core portion is still intact and supporting diverse flora and faunal species from extinction. If the de-notification of KTR has considered, then it will be a great loss to ecology. Pre-independence era tigers and elephants were distributed across the forests of Uttara Kannada, now they are confined to only Kali river basin due to various other reasons. The entire basin is acting as the lifeline for wildlife to thrive as it is the only habitat for key species such as tigers and elephants in the district. The accuracy of classification has been verified with sample data collected from the field and google earth. The overall accuracy of classification is 89, 91 % respectively for 1973 and 2016.
SNO |
Year |
1973 |
2016 |
Category |
Ha |
% |
Ha |
% |
1 |
Evergreen to semi evergreen forest |
130660.7 |
91.5 |
102,558.63 |
71.85 |
2 |
Moist deciduous forest |
6836.6 |
4.8 |
15,872.42 |
11.12 |
3 |
Dry deciduous forest |
258.3 |
0.2 |
775.2 |
0.54 |
4 |
Scrub forest/grass land |
2021.8 |
1.4 |
4297.06 |
3.01 |
5 |
Teak/Bamboo/Acacia/Eucalyptus/Other plantations |
1202.8 |
0.8 |
10851.49 |
7.60 |
6 |
Crop land |
895.2 |
0.6 |
4136.89 |
2.90 |
7 |
Coconut/Areca nut /Cashew nut plantations |
0.0 |
0.0 |
0 |
0.00 |
8 |
Open fields |
463.0 |
0.3 |
3019.57 |
2.12 |
9 |
Built-up |
42.6 |
0.0 |
304.75 |
0.21 |
10 |
Water |
354.5 |
0.2 |
919.45 |
0.64 |
Total |
142735.5 |
Table 2: Temporal changes in land use of KTR.
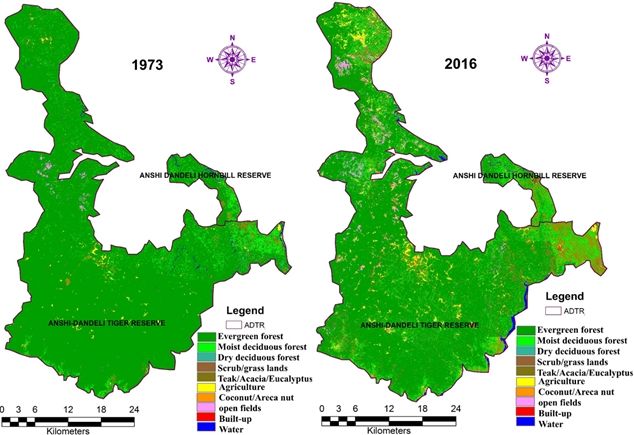
Figure 5: Land use analysis of ADTR (KTR).
|
|
Dr. T.V. Ramachandra
Centre for Sustainable Technologies, Centre for infrastructure, Sustainable Transportation and Urban Planning (CiSTUP), Energy & Wetlands Research Group, Centre for Ecological Sciences, Indian Institute of Science, Bangalore – 560 012, INDIA.
E-mail : tvr@iisc.ac.in
Tel: 91-080-22933099/23600985,
Fax: 91-080-23601428/23600085
Web: http://ces.iisc.ac.in/energy
Bharath SetturuEnergy & Wetlands Research Group, Centre for Ecological Sciences, Indian Institute of Science, Bangalore – 560 012, INDIA.
E-mail: setturb@iisc.ac.in
Subash Chandran M DEnergy & Wetlands Research Group, Centre for Ecological Sciences, Indian Institute of Science, Bangalore – 560 012, INDIA.
E-mail: subhashc@iisc.ac.in
Rao G REnergy & Wetlands Research Group, Centre for Ecological Sciences, Indian Institute of Science, Bangalore – 560 012, INDIA.
E-mail: raogr@iisc.ac.in
Vishnu D Mukri
Energy & Wetlands Research Group, Centre for Ecological Sciences, Indian Institute of Science, Bangalore – 560 012, INDIA.
Joshi N VEnergy & Wetlands Research Group, Centre for Ecological Sciences, Indian Institute of Science, Bangalore – 560 012, INDIA.
E-mail: nvjoshi@iisc.ac.in
Citation: Ramachandra T V, Bharath Setturu, Subash Chandran M D, Rao G R, Vishnu D. Mukri, Joshi N V. 2017. Ecologically Sensitive Regions in the Kali River Basin, Karnataka: Delineation based on Ecological Principles and People’s Livelihood, ENVIS Technical Report 125, Sahyadri Conservation Series 68, Energy & Wetlands Research Group, CES, Indian Institute of Science, Bangalore 560012
| Contact Address : |
| |
Dr. T.V. Ramachandra
Energy & Wetlands Research Group,
Centre for Ecological Sciences, TE 15, New Biology Building, Third Floor, E Wing, [Near D Gate], Indian Institute of Science, Bangalore – 560 012, INDIA.
Tel : 91-80-22933099 / 22933503-extn 107
Fax : 91-80-23601428 / 23600085 / 23600683 [CES-TVR]
E-mail : cestvr@ces.iisc.ac.in, energy@ces.iisc.ac.in,
Web : http://wgbis.ces.iisc.ac.in/energy |
|