|
|
ENVIS Technical Report 125, September 2017 |
 |
Ecologically Sensitive Regions in the Kali River Basin, Karnataka:
Delineation based on Ecological Principles and People’s Livelihood |
 |
METHOD
Figure 2 outlines the protocol adopted for the analysis. Multiresolution RS data has been acquired through the sensors of U.S. Geological Survey Earth Observation Satellites (EOS). The RS data used in the study are Landsat multispectral sensor (MSS-1973), Operational Land Imager (OLI-2016) and online Google Earth data (http://earth.google.com). The ancillary data is used to assist the interpretation of different land use types from remote sensing data. Topographic maps provided ground control points to rectify remotely sensed data and scanned paper maps (topographic maps). Survey of India (SOI) toposheets (1:50000 and 1:250000 scales) and vegetation map of South India developed by French Institute (1986) of scale 1:250000 was digitized to identify various forest cover types and temporal analyses to find out the changes in vegetation. Pre-calibrated GPS (Global Positioning System - Garmin GPS unit) for field measurements. Ground control points are used to geometrically correct remote sensing data and also to validate the classified land use information. The supervised classification scheme of Gaussian maximum likelihood classifier (GMLC) scheme is adopted for land use analysis under 10 different land use categories using GRASS GIS (Geographical Analysis Support System). GRASS is a free and open source geospatial software with the robust functionalities for processing vector and raster data available at (http://wgbis.ces.iisc.ac.in/grass/). The training data (60%) collected has been used for classification, while the balance is used for accuracy assessment to validate the classification. The test samples are then used to create error matrix (also referred as confusion matrix) kappa (κ) statistics and overall (producer's and user's) accuracies to assess the classification accuracies (Lillesand et al., 2014).
The study area is divided into 5’×5’ equal area grids (97) covering approximately 9 km2 to account the changes at micro scale. The data of various themes were collected based on literature, unpublished datasets, and field surveys. A detailed database has been created for various themes covering all aspects from land to estuarine ecosystem. The initial workflow has derived a series of maps pertaining to various themes. The weightage metric score has been computed to captures the priorities associated with various themes (Figure 3). Developing a weightage metric score analysis requires combining knowledge from a wide array of disciplines (Termorshuizen & Opdam, 2009), planning should acknowledge and actively integrate present and future needs for landscape. The approach has chosen a framework proposed by Beinat, 1997 for weightaging eco-sensitive regions because it provides an objective and transparent system for combining multiple data sets together to infer the significance. The weightage is defined in Equation 1.
 …(1) …(1)
Where n is the number of data sets, Vi is the value associated with criterion i, and Wi is the weight associated with that criterion. Each criterion is described by an indicator mapped to a value normalized between 10 to 1. The value 10 corresponds to very higher priority for conservation whereas 1 is converse to above. The value 7, 5 and 3 corresponds to high, moderate, low levels of conservation. In particular, the weightages, which is based on an individual proxy and draws extensively on GIS techniques, stands out as the most effective method. The final ESR map will result as a guide for the conservation of most sensitive regions and rest. The map can be used by decisionmakers as a basis for effective planning.

Figure 2: Method followed for land use analysis
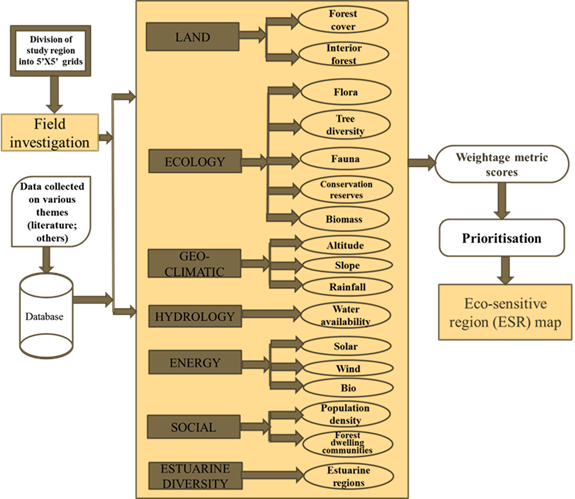
Figure 3: Computation of ecologically sensitive regions.
|
|
Dr. T.V. Ramachandra
Centre for Sustainable Technologies, Centre for infrastructure, Sustainable Transportation and Urban Planning (CiSTUP), Energy & Wetlands Research Group, Centre for Ecological Sciences, Indian Institute of Science, Bangalore – 560 012, INDIA.
E-mail : tvr@iisc.ac.in
Tel: 91-080-22933099/23600985,
Fax: 91-080-23601428/23600085
Web: http://ces.iisc.ac.in/energy
Bharath SetturuEnergy & Wetlands Research Group, Centre for Ecological Sciences, Indian Institute of Science, Bangalore – 560 012, INDIA.
E-mail: setturb@iisc.ac.in
Subash Chandran M DEnergy & Wetlands Research Group, Centre for Ecological Sciences, Indian Institute of Science, Bangalore – 560 012, INDIA.
E-mail: subhashc@iisc.ac.in
Rao G REnergy & Wetlands Research Group, Centre for Ecological Sciences, Indian Institute of Science, Bangalore – 560 012, INDIA.
E-mail: raogr@iisc.ac.in
Vishnu D Mukri
Energy & Wetlands Research Group, Centre for Ecological Sciences, Indian Institute of Science, Bangalore – 560 012, INDIA.
Joshi N VEnergy & Wetlands Research Group, Centre for Ecological Sciences, Indian Institute of Science, Bangalore – 560 012, INDIA.
E-mail: nvjoshi@iisc.ac.in
Citation: Ramachandra T V, Bharath Setturu, Subash Chandran M D, Rao G R, Vishnu D. Mukri, Joshi N V. 2017. Ecologically Sensitive Regions in the Kali River Basin, Karnataka: Delineation based on Ecological Principles and People’s Livelihood, ENVIS Technical Report 125, Sahyadri Conservation Series 68, Energy & Wetlands Research Group, CES, Indian Institute of Science, Bangalore 560012
| Contact Address : |
| |
Dr. T.V. Ramachandra
Energy & Wetlands Research Group,
Centre for Ecological Sciences, TE 15, New Biology Building, Third Floor, E Wing, [Near D Gate], Indian Institute of Science, Bangalore – 560 012, INDIA.
Tel : 91-80-22933099 / 22933503-extn 107
Fax : 91-80-23601428 / 23600085 / 23600683 [CES-TVR]
E-mail : cestvr@ces.iisc.ac.in, energy@ces.iisc.ac.in,
Web : http://wgbis.ces.iisc.ac.in/energy |
|