|
|||||||||||||||||||||||||||||||||||||||||||||||||||||||||||||||||||||||||||||||||||||
|
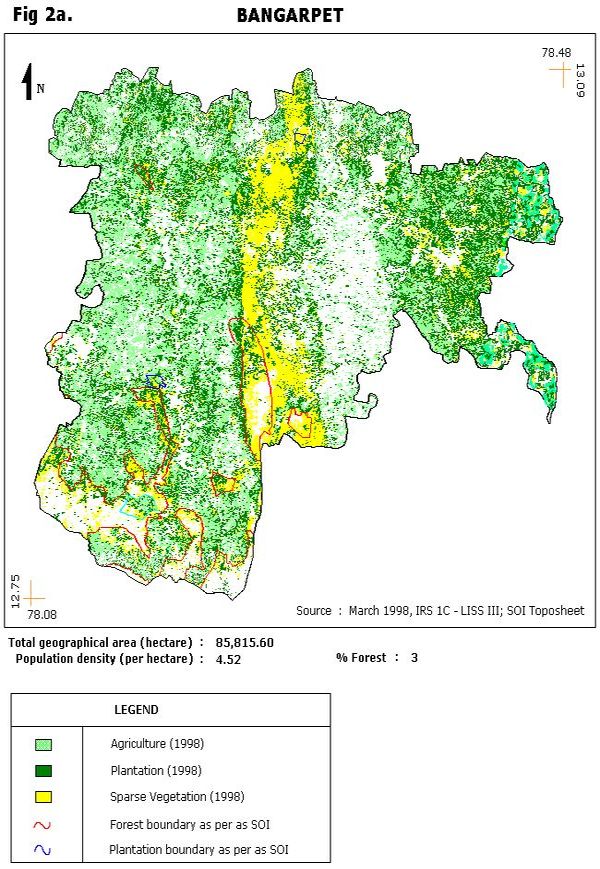
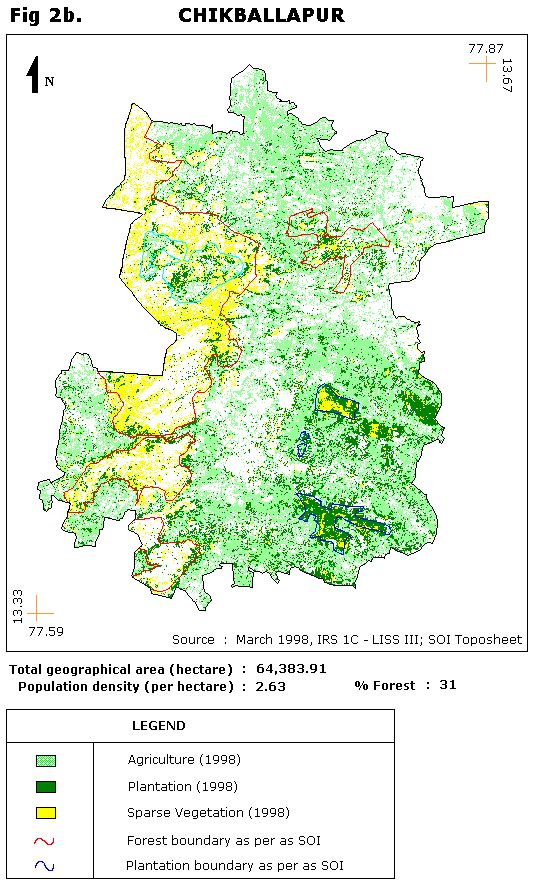
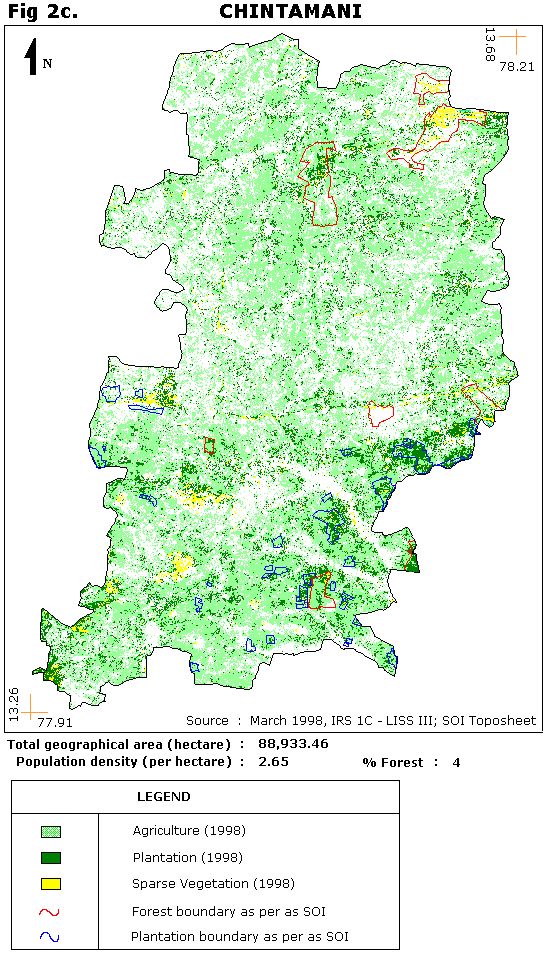
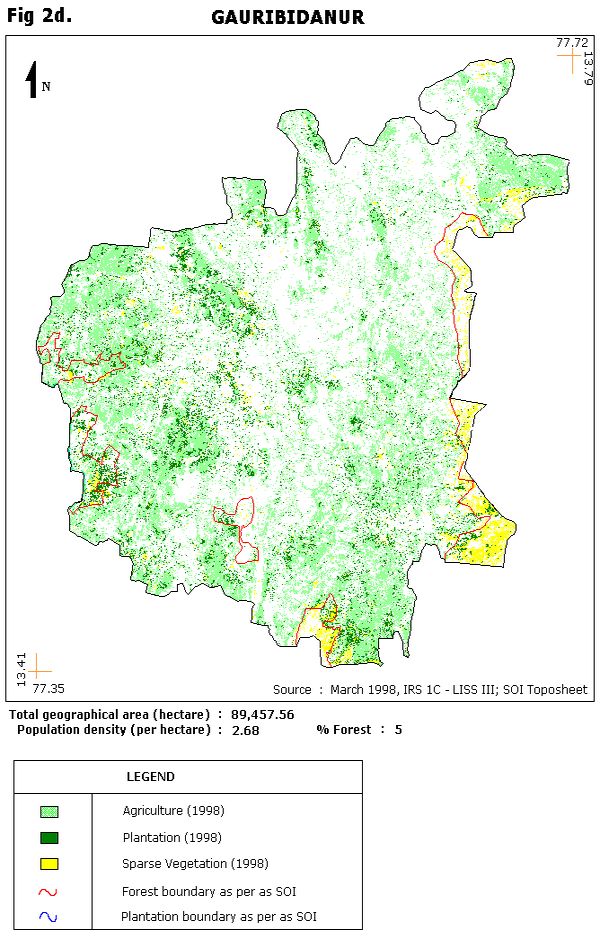
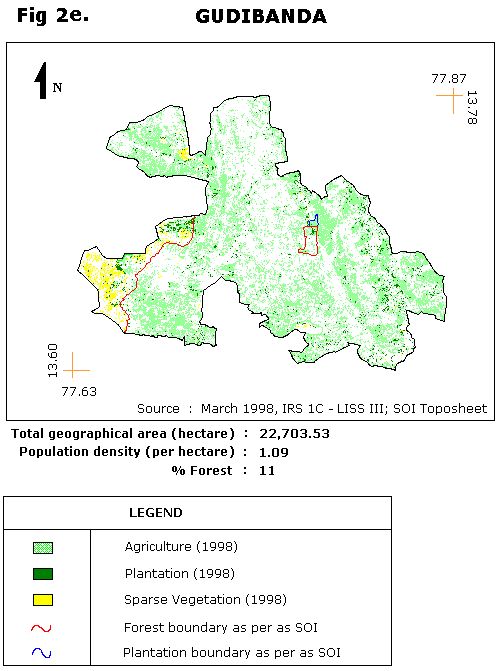
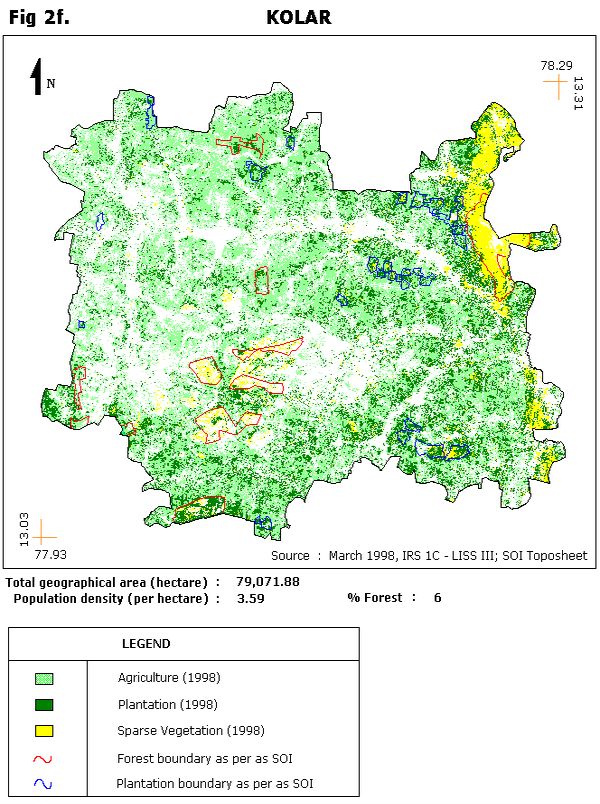
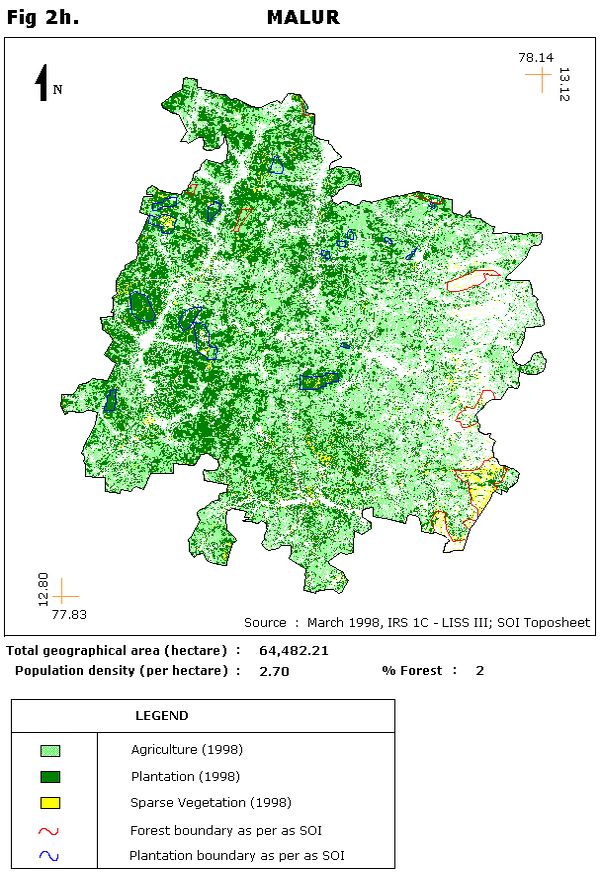
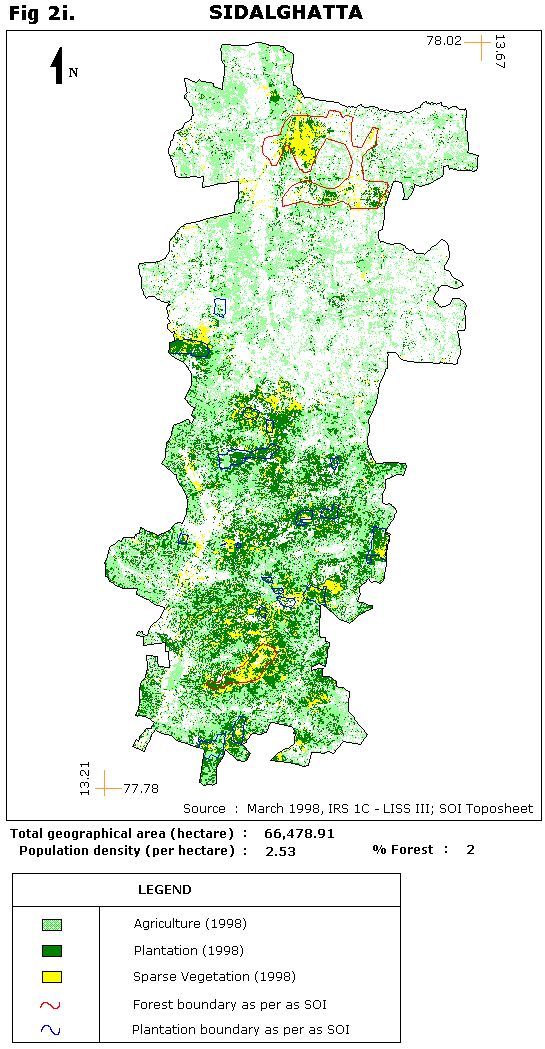
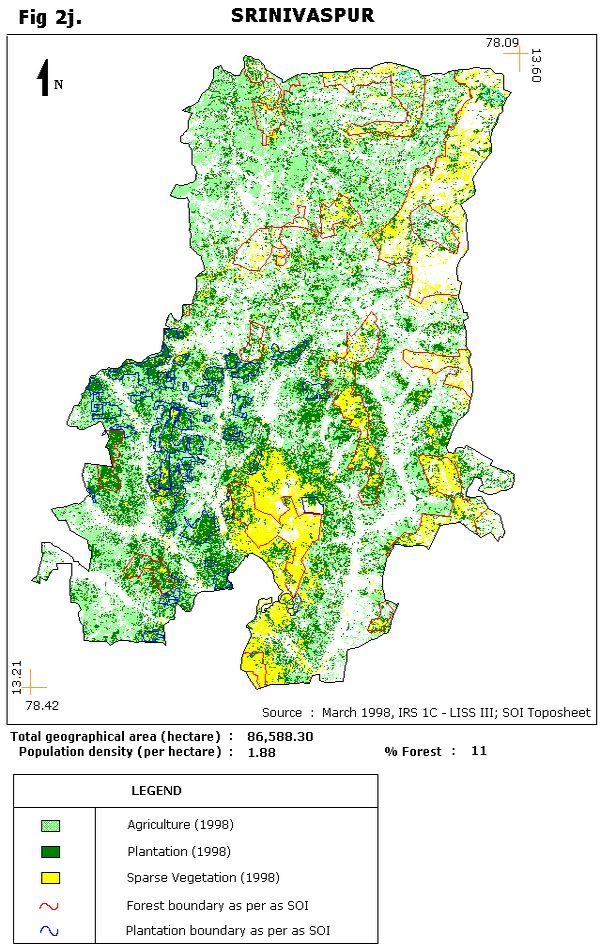
Results and Discussion : Forests provides both tangible and non tangible benefits towards amelioration of soil, protection of environment besides economic benefits through timber, minor forest produce, fuel and other products.. Most parts of Kolar district experiences severe bioresource scarcity and immediate policy interventions are needed to restore the ecological balance of the region. Hence this study is aimed to determine the supply and demand situation of Biomass fuels in this region and spatially link this database to determine the energy surplus and deficit areas. Secondary data collected from the forest department shows that 7 taluks have forest cover less than 10%, 2 taluks are in the range 10 - 20% (Gudibanda and Srinivaspura) while, remaining two taluks (Bagepalli and Chikballapur) have forest cover greater than 20%. Actual resource cover based on conventional method and satellite remote sensing carried out for Kolar district (talukwise) are given in Fig 2a-k. Woody biomass annual availabilities in Kolar taluks taking into account woody biomass productivity of 3.6 t/h/yr (evergreen, semi evergreen), 3.9 t/ha/yr (deciduous) and 0.9 t/ha/yr (Scanty and Scrub vegetation).
7.1 Bio Energy from Animal Residues: Livestock: Table 1: Talukwise density (number of villages in each range) in Kolar District:
This shows that in Kolar taluk 132 villages have an average density less than 0.5 (livestock/hectare), 130 villages have density in the range 0.5 - 1.0, 70 villages have a density 1.0 -1.5, while remaining 30 villages have density greater than 1.5. Quantity of the dung yield per cattle varies from place to place - It is seen that dung available per animal (cattle) is about 3-7.5 kg/adult animal, buffaloes 12-15 kg, stall fed buffalo about 15-18 kg, hybrid ones about 15-18 kg. By considering lower figures (such as 3 kg per animal for cattle, 12 kg/animal for buffaloes), total dung available is about 3,71,991 kg/day. With the assumption of 0.036 m3 of biogas yield per kg of cattle/buffaloes dung (Khandelwal and Mahdi, 1986), we estimate that total quantity of gas available (if all is used for biogas) is about 13,391 m3/day. It is estimated that per capita requirement of gas is about 0.34-0.43 m3/day for domestic purposes. Which means, that gas generated by animal dung is sufficient to meet the requirement of 19.62% of total population of Kolar taluk. 7.2 Sectorwise Energy Demand: This involved survey of the present energy consumption in domestic, agriculture, industrial, commercial and services sector for various enduses covering the magnitude, types of energy sources, trends and preferences in consumption. Domestic sector: Energy survey is being carried out in sample villages in each taluk. villages are selected based on per capita agricultural land, per capita livestock population, forest land as % of total land, per capita waste land. These parameters reflect the availability of energy resources in the village energy system. questionnaire based stratified random sampling of Domestic sector (based on land holding, community etc.) in each selected village, to determine cooking, lighting and other domestic energy demand. Samples from the population would be selected in a manner so as to represent all category and number of samples so as to represent atleast 5% of population. From this set of samples we select few households (who are cooperative) to carry out energy survey in each season in order to see the seasonal variation in fuel consumption. |
|||||||||||||||||||||||||||||||||||||||||||||||||||||||||||||||||||||||||||||||||||||