|
METHODOLOGY
1. Automatic Endmember Extraction—The N-FINDR Algorithm
The N-FINDR algorithm [18] is a fully automatic technique for endmember extraction from the image, which is briefly described here:
- Let N denote the number of classes or endmembers to be identified.
- Perform a PCA-decomposition of the data and reduce the data to N−1 dimension space.
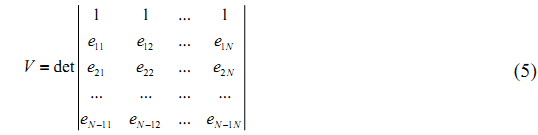
- Pick N pixels from the set and compute the simplex volume generated by the spectra of the N pixels. The volume of the simplex is proportional to
- Replace each endmember with the spectrum of each pixel in the data set and recompute the simplex volume. If the volume increases, the spectrum of the new pixel is retained as a potential endmember.
- The above steps are executed iteratively considering all pixels, and the final set of retained spectra is taken as the endmembers.
2. Orthogonal Subspace Projection (OSP) to Solve Linear Mixture Model
OSP proposed by Chang [19] involves (a) finding an operator which eliminates undesired spectral signatures, and then (b) choosing a vector operator which maximizes the signal to noise ratio (SNR) of the residual spectral signature.
If we assume that there are N targets, t1, …tn-1, tn, tn+1, …, tN present in an image scene, then there are N spectrally distinct endmembers with corresponding target signatures as e1, …en-1, en, en+1, …, eN, where M > N (over a determined system), where Equation (1) is a standard signal detection model. Since we are interested in detecting one target at a time, we can divide the set of N targets into a desired target, say tn, and a class of undesired targets, t1,…,tn-1, tn+1,…, tN. We need to eliminate the effects caused by the undesired targets that are considered as interferers to tn before the detection of tn takes place. With annihilation of the undesired target signatures, the detectability of tn can be enhanced. In order to find the abundance of the nth target material (αn), first en is separated from e1, …en-1, en, en+1, …, eN in E. Let the corresponding spectral signature of the desired target material be denoted as d. The term Eα can be rewritten to separate the desired spectral signature d from the rest as:

and Equation (1) is rewritten as

where d = en is the desired target signature of tn and U is M x (N-1) matrix = [e1, …en-1, en+1, …, eN], is the undesired target spectral signature, which are the spectral signatures of the remaining N−1 undesired targets, t1,…,tn-1, tn+1,…, tN. Equation (7) is called a (d, U) model; d is a M ×1 column vector [d1, d2, …, dM]T, γ is a (N−1) ×1 column vector containing (N−1) component fractions of
α = [α1, …αn-1, αn+1,…, αN]T. Using the (d, U) model, OSP can annihilate U from the pixel vector y prior to detection of tn similar to [20] by the operator

where U# = (UTU)-1UT is the pseudo-inverse of U. The projector P is a M × M matrix operator that maps the observed pixel vector y into the orthogonal complement of U. U has same structure as the orthogonal complement projector from the theory of least squares. Applying P to the (d, U) model results in a new signal detection model (OSP model) given by

where the undesired signal in U has been annihilated and the original noise has also been suppressed to Pη. The operator minimizes energy associated with the signatures not of interest as opposed to minimizing the total least squares error. It should be noted that P operating on Uγ reduces the contribution of U to about zero. So,

on using a linear filter specified by a weight vector xT on the OSP model, the filter output is given by

an optimal criterion here is to maximize SNR of the filter output
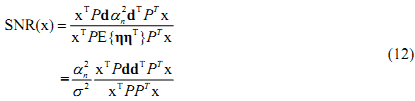
where E{} denotes the expected value. Maximization of this is a generalized eigenvalue-eigenvector problem

where  . The eigenvector, which has the maximum λ is the solution of the problem and it turns out to be d. The idempotent (P2 = P) and symmetric (PT = P) properties of the interference rejection operator are used. One of the eigenvalues is dTPd and the value of xT (filter), which maximizes the SNR is . The eigenvector, which has the maximum λ is the solution of the problem and it turns out to be d. The idempotent (P2 = P) and symmetric (PT = P) properties of the interference rejection operator are used. One of the eigenvalues is dTPd and the value of xT (filter), which maximizes the SNR is

where k is an arbitrary scalar. It leads to an overall classification operator for a desired target in the presence of multiple undesired targets and white noise given by the 1 × M vector

This result first nulls the interfering signatures, and then uses a matched filter for the desired signature to maximize the SNR. When the operator is applied to all the pixels in a scene, each M ×1 pixel is reduced to a scalar which is a measure of the presence of the signature of interest. The final result reduces the M images into a single image where the high intensity indicates the presence of the desired signal. Applying dTP on (10) gives

therefore,
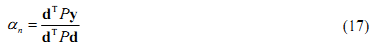
is the abundance estimate of the nth target material. In the absence of noise, the estimate matches with the exact value in Equation (7). Another way of removing the undesired signal based on band ratios is hinted by [21]. For a noise subspace projection method, see [22]. Settle [23] showed that the full linear unmixing and OSP used here, and as described by Harsanyi and Chang [20] are identical. Full linear unmixing can be performed when the spectra for all the endmembers present in the image are known a priori. Often, knowledge of all the endmembers spectra is not available. Therefore partial unmixing methods for estimating the presence of one or a few desired, known spectra only are desirable [24]. In general, these approaches are effective when the number of spectral bands is higher than the target signatures of interest.
The value of αn is the abundance of the nth class (in an abundance map) and ranges from 0 to 1 in any given pixel and there are as many abundance maps as the number of classes. Zero indicates absence of a particular class and 1 indicates presence of only that class in a particular pixel. Intermediate values between 0 and 1 represent a fraction of that class. For example, 0.4 may represent 40% presence of a class in an abundance map and the remaining 60% could be some other class.
3. Artificial Neural Network (ANN) based Multi-layer Perceptron (MLP)
The advent of ANN approaches is mainly due to their power in pattern recognition, interpolation, prediction, forecasting, classification and process modeling [24]. A MLP network comprises a number of identical units organized in layers, with those on one layer connected to those on the next layer so that the output of one layer is used as input to the next layer. A detailed introduction on MLP can be found in the literature [24-28]. The main aspects here are: (i) The order of presentation of training samples should be randomized from epoch to epoch; and (ii) the momentum and learning rate parameters are typically adjusted (and usually decreased) as the number of training iterations increases. Individual algorithms were implemented in C programming language. GRASS (Geographic Resources Analysis Support System)—a free and open source package—was used for visualization of results, and statistical analysis was carried in R in a Linux system running on a 3 GHz Pentium-IV processor with
3.5 GB RAM.
|
