|
DATA
1. Computer Simulations
One of the major problems involved in analyzing the quality of fractional estimation methods is the fact that ground truth information about the real abundances of materials at sub-pixel levels is difficult to obtain in real scenarios [29]. In order to avoid this shortcoming, a simulation of hyperspectral imagery was carried out to examine the algorithm’s performance in a controlled manner. Spectral libraries of four minerals—alunite, buddingtonite, kaolinite and calcite [31] were used to generate synthetic data. Plaza et al. [12] used the signatures of soil (e1) and vegetation (e2) to create a simulated image with non-linear mixtures using a simple logarithmic function. The abundance of e1 and e2 were assigned according to Equation (19)
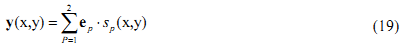
where, y denotes a vector containing the simulated discrete spectrum of the pixel at spatial coordinates (x,y) of the simulated image, sp(x,y) = log10αp(x,y) is the contribution of endmember ep and αp(x,y) is the fractional abundance of ep at (x,y). A limitation here is that even though all the pixels are mixed in different proportions, there are no instances of pure pixels. If α is 1, we expect the observed hyperspectral signature to be solely from one material, and therefore, ideally it should be identical to the endmember itself. Here, as the abundance increases towards 1, log10(α) approaches 0, thereby suppressing the contribution of that particular endmember. On the other hand, if α is 0, log10(α) approaches −∞, and therefore, starts dominating in the observed spectral signature. Of course, it will appear as negative numbers. This is against our physical understanding as to how a material, which is almost not present in the pixel, contributes to the observation in a dominant way. That is, the model is not able to highlight the endmember of the correct material when its contribution is 1 and gives a wrong endmember when its contribution is 0. To overcome this limitation, we modify the model in Equation (19) by Equation (20):
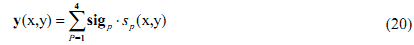
where, sigp is the signature corresponding to pth mineral, sp(x,y) = log10(1+ αp(x,y)) is the contribution of endmember ep and αp(x,y) is the fractional abundance of ep in the pixel at (x,y).
Simulated synthetic non-linear mixture hyperspectral data of 200 bands (250 × 250) using four minerals were classified using Maximum Likelihood Classifier (MLC) with signatures from the spectral libraries. This constitutes high-resolution (HR) images. These images were used to generate synthetic mixed pixels of 25 × 25 (referred to as low-resolution (LR) images). Four endmembers were extracted from LR images, and subsequently, abundance images were estimated corresponding to each endmember. Percentage abundance for a group of 10 × 10 pixels was computed for this entire HR classified image (250 × 250) obtained from MLC. This new image of a size of 25 × 25 was used as reference for validating the LR abundance output. However, the HR MLC based classified output
(250 × 250) was not validated as the same spectral library which was used for generating the individual class signatures for classification of the HR image and was also used to create the synthetic images. Abundance values from 15% of the pixels obtained from linear unmixing along with the corresponding proportions obtained from the 250 × 250 classified image obtained by MLC were used to train the neurons in MLP. For example, each input sample to the MLP has the abundance values obtained from OSP for each of the four classes (0.2, 0.3, 0.1, 0.4 = 1 or 100% of a pixel) and the proportion of each class as derived from HR MLC based classified map (0.18, 0.27, 0.2, 0.35 = 1 or 100% of a pixel)
by considering 25 × 25 classified pixels and finding the percentage of each class separately which
is equivalent to 1 × 1 LR pixel spatially. Testing was done on the entire output abundance
images (100% pixels).
2. MODIS Data
The training and testing data (pertaining to Kolar district, Karnataka State, India) used to study the model consisted of (i) IRS LISS-3 Multispectral with three spectral bands of 23.5 × 23.5 m spatial resolution acquired on December 25, 2002 and (ii) MODIS eight-day composite (of 19 December to 26 December 2002) data with seven bands at 250 and 500 m. The fractional LC for each MODIS pixel was computed in four steps: (i) LISS-III data of 1000 × 1000 pixels were geo-corrected, resampled to 25 m and classified into six LC classes (agriculture, built-up/settlement, forest, plantation/orchard, wasteland/barren land and water bodies) using MLC; (ii) MODIS images (100 × 100 pixels; 10 times smaller than the size of LISS-III) were co-registered to LISS-III data and resampled to 250 m; (iii) Six endmembers were extracted using N-FINDR from the MODIS bands and the data were unmixed to estimate abundances for each pixel at the MODIS image scale; (iv) Finally, 15% MODIS abundance pixels obtained from LMM were randomly selected to be associated with the corresponding LISS-III classified pixels (as ground truth) at the same spatial locations to train the neurons in MLP based HMM. The weights were adjusted until fractions of LC obtained from HMM were nearly the same as that of LISS-III (desired output). The learned network was applied on the test data set that included all the abundance values for all the classes in the entire image obtained from LMM. The HMM outputs were six abundance maps, one for each class.
|
