DATA ANALYSIS AND RESULTS
Validation of the techniques discussed above was done using IKONOS PAN (spectral wavelength: 525.8 – 928.5 μm, spatial resolution: 1 m, acquired on February 23, 2004) and 4 m spatial resolution MS bands (Blue, Green, Red and Near Infra Red-NIR, acquired on November 24, 2004). The size of PAN and MS images, covering a portion of Bangalore city, India, is 1200 x 1600 and 300 x 400 respectively. The pairs of the images were geometrically registered and the LSR images were upsampled to 1200 x 1600 by nearest neighbour algorithm. IKONOS data were collected at 11-bits per pixel (2048 gray tones). The processing and evaluation were based on the original 11-bit and the data were converted to 8-bit for display purpose only.
Validation of the techniques discussed above was done using IKONOS PAN (spectral wavelength: 525.8 – 928.5 μm, spatial resolution: 1 m, acquired on February 23, 2004) and 4 m spatial resolution MS bands (Blue, Green, Red and Near Infra Red-NIR, acquired on November 24, 2004). The size of PAN and MS images, covering a portion of Bangalore city, India, is 1200 x 1600 and 300 x 400 respectively. The pairs of the images were geometrically registered and the LSR images were upsampled to 1200 x 1600 by nearest neighbour algorithm. IKONOS data were collected at 11-bits per pixel (2048 gray tones). The processing and evaluation were based on the original 11-bit and the data were converted to 8-bit for display purpose only.
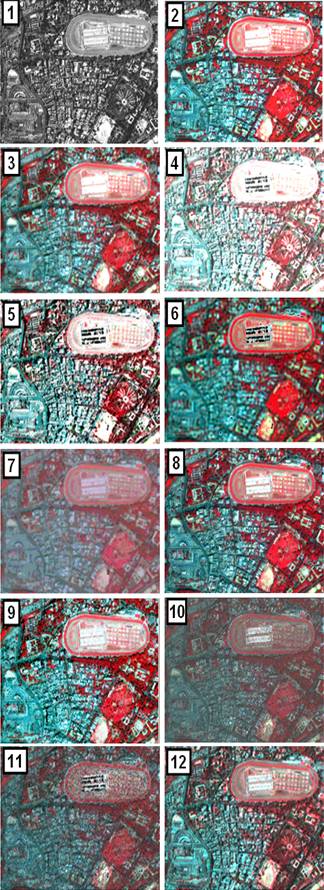
Figure 1. Original PAN image [1], FCC of the original LSR MS image (G-R-NIR) resampled at 1 m pixel size [2], Fusion through COS [3], LMVM [4], Modified IHS [5], FFT-IHS [6], GLP [7], LR [8], SF [9] Sparkle [10], SVHC [11] and SVR [12].
Figure 1 [1 and 2] shows the PAN image and the false colour composite (FCC) of the R-G-B combination resampled at 1 m pixel size. The study area is composed of various features such as buildings, race course, buses, parks, etc. ranging in size from 1 m to 100 m. The correlation coefficients (CCs) between PAN (downsampled to 4 m pixel size) and the original Blue band was 0.41, PAN and Green was 0.44, PAN and Red was 0.47 and PAN and NIR was 0.59. CC of the NIR band is higher than CCs of other bands, indicating that IKONOS NIR band is very important to the IKONOS PAN band. Modified IHS, FFT-IHS and SVHC methods can handle only three bands so G-R-NIR combination was chosen for FCC. The resolution ratio between the IKONOS MS and PAN is 1:4, therefore, in LMVM, FFT-IHS, GLP, LR, SF, Sparkle and SVHC methods, a 5 x 5 filter was used. The regression coefficient  in COS between the four MS and PAN band were C1=0.19708371, C2=0.80105230, C3=1.355215 and C4=1.3615748. r was calculated as 0.6633. The modulation coefficient
  were W1=0.3094, W2=0.2944, W3=0.2824 and W4=0.2810.
The FCC of the G-R-NIR bands (at 1 m) of the fused results of COS, LMVM, Modified IHS, FFT-IHS, GLP, LR, SF, Sparkle, SVHC and SVR methods are displayed in Figure 1 [3-12] respectively. The aim of fusion here is to simulate MS data acquired at LSR (4 m) to HSR level (1 m), which is identical to MS images originally acquired at HSR (1 m), had there been an ideal sensor that would acquire MS bands at 1m. The performance of the techniques was evaluated in terms of the quality of synthesis of both spatial and spectral information.
Visual inspection indicated that spatial resolutions of the resultant images are higher than that of the original image as features (such as buses, trees, buildings, roads) which were not interpretable in the original image (Figure 1 [2]) are identifiable in the resultant images (Figure 1 [3-12]). LMVM, Modified IHS, GLP and SVHC (Figure 1 [4, 5, 7 and 11]) produce significant color distortion, while FFT-IHS and Sparkle methods (Figure 1 [6 and 10]) produce slight colour distortion in buildings/built-up area. FFT-IHS, GLP and Sparkle exhibit more sharpness. This is probably due to over-enhancement along the edge areas, because these additive methods have considered the differences in high-frequency information between the PAN and the MS bands. Overall, by visual inspection, COS, LR, SF and SVR methods gives the synthesised result closest to what is expected with least colour distortion.
The performance of these techniques were also analysed quantitatively by checking the CC that is often used as a similarity metric in image fusion. However, CC is insensitive to a constant gain and bias between two images and does not allow subtle discrimination of possible fusion artifacts. In addition, a universal image quality index (UIQI) [11 and 12] was used to measure the similarity between two images. UIQI is designed by modeling any image distortion as a combination of three factors: loss of correlation, radiometric distortion, and contrast distortion, and is given by:
 . (12)
The first component is the CC for A (original MS band) and B (fused MS band). The second component measures how close the mean gray levels of A and B is, while the third measures the similarity between the contrasts of A and B. The dynamic range is [-1, 1]. If two images are identical, the similarity is maximal and equals 1. The synthesised HSR MS images (1 m) are spatially degraded to the resolution level of the original LSR MS images (4 m). UIQI are computed between the degraded HSR MS images and the original LSR MS images at the 4 m resolution level. Table 1 shows that the UIQI values of SF and COS are higher than the UIQI values of other methods. SF showed higher scores in the NIR band. Since, PAN band includes the most important information from the NIR band (PAN and NIR exhibited highest correlation), therefore, from the UIQI method, it is apparent that SF and COS are superior to all other methods. CC in Table 1 shows the correlation between the IKONOS HSR PAN image and the corresponding LSR PAN image generated by different methods (computed at 1 m pixel size). It can be seen that the degree of similarity between the HSR PAN image and the LSR PAN image correspond to the degree of spectral distortion of each band. The lower the similarity between the HSR PAN image and the LSR PAN image, the higher the spectral distortion and vice versa. The closeness between original and fused images were also quantified using CC (Table 2) where each original IKONOS MS band was correlated with respect to each fused band obtained from the 10 techniques (except in Modified IHS, FFT-IHS and SVHC where only three bands – G, R, and NIR were considered). SF and COS produced very high correlation of more than 0.9 for all the four bands. GLP has same correlation in all the bands (0.93). LMVM, Modified IHS, FFT-IHS, LR, Sparkle and SVHC produced least correlation. Statistical parameters – minimum, maximum and standard deviation were also used as a measure to examine the spectral information preservation for all the bands (see Figure 2, 3 and 4).
Table 1. UIQI measurements of the similarity between original and the fused images and CC between the HSR PAN and the corresponding PAN image obtained by various methods
| Techniques |
Blue |
Green |
Red |
NIR |
CC |
| COS |
0.98 |
0.95 |
0.94 |
0.84 |
1.00 |
| LMVM |
0.03 |
0.05 |
0.06 |
0.09 |
- |
| Modified IHS |
- |
0.00 |
0.00 |
0.00 |
1.00 |
| FFT-IHS |
- |
0.42 |
0.72 |
0.32 |
0.60 |
| GLP |
0.93 |
0.93 |
0.93 |
0.29 |
- |
| LR |
-0.20 |
-0.41 |
-0.40 |
0.14 |
- |
| SF |
0.91 |
0.96 |
0.98 |
0.98 |
- |
| Sparkle |
0.04 |
0.09 |
0.149 |
0.12 |
- |
| SVHC |
- |
0.02 |
0.04 |
0.06 |
- |
| SVR |
0.034 |
0.11 |
0.23 |
0.18 |
0.32 |
- p value for all CC = 2.2e-16
- Modified IHS, FFT-IHS & SVHC are limited to G, R, NIR.
- No synthetic PAN in LMVM, GLP, LR, SF, Sparkle & SVHC.
|
Table 2. CC between original and fused images
| Techniques |
Blue |
Green |
Red |
NIR |
| COS |
0.98 |
0.95 |
0.97 |
0.95 |
| LMVM |
0.04 |
0.06 |
0.07 |
0.10 |
| Modified IHS |
- |
0.09 |
0.32 |
0.18 |
| FFT-IHS |
- |
0.20 |
0.37 |
0.29 |
| GLP |
0.93 |
0.93 |
0.93 |
0.93 |
| LR |
-0.54 |
-0.58 |
-0.48 |
0.27 |
| SF |
0.91 |
0.96 |
0.98 |
0.98 |
| Sparkle |
0.11 |
0.17 |
0.24 |
0.21 |
| SVHC |
- |
0.10 |
0.17 |
0.22 |
| SVR |
0.12 |
0.26 |
0.41 |
0.36 |
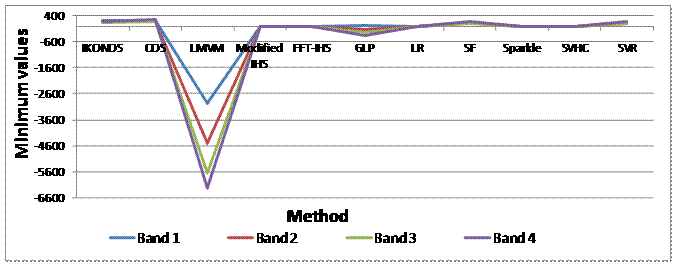
Figure 2. Minimum values of the original and fused images.
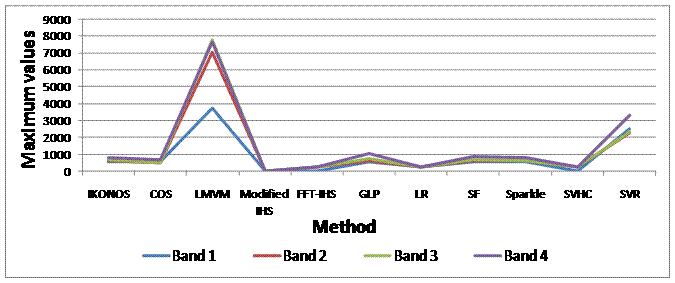
Figure 3. Maximum values of the original and fused images.
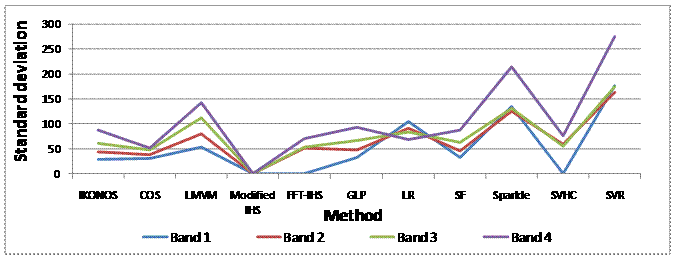
Figure 4. Standard deviation values of the original and fused images.
It is evident from Figure 2-4, that LMVM has large deviations from the original band values. COS was closest to original band values for band 1, 2, and 3 while SF was closest to original in band 4 (Figure 2). For the maximum values, (Figure 3), COS and SF fusion methods were very close to the maximum of original bands. All other methods induced changes in the maximum values in all the fused bands. Standard deviation (Figure 4) for SF and COS were closest to original. All other methods showed deviations. While SVR was closer to original band for minimum band values (Figure 2), the technique departed from the original trend for maximum and standard deviation values (Figure 3 and 4). The above statistical parameters indicated that SF and COS are better compared to all other methods, however, it could not clearly indicate which method among SF and COS is better since some values were closer to original bands in SF while some were closer to original band values in COS.
By combining the visual inspection and the quantitative results, it was observed that, SF has highest UIQI values for Green, Red and NIR bands whereas COS has higher UIQI in Blue band (highlighted in bold in Table 1). The CC values between the HR PAN and LR PAN for COS is 1, while no LR PAN band is generated in SF fusion (Table 1). The CC for SF is higher in bands 2 (Green), 3 (Red) and 4 (NIR) than COS (highlighted in bold in Table 2). Minimum values of band 1 (Blue), 2 (Green), and 3 (Red) are closest to original in COS while SF is closest in band 4 (NIR). Maximum and standard deviation values for all the 4 bands were closest to original in SF than COS. From Table 3, we see that, overall, most of the statistical parameters were closest to original values in band 4 (NIR) for SF (highlighted in Table 3), which is a very important band for IKONOS sensor as it has maximum correlation with the PAN band, so we conclude that SF is better for image fusion.
Table 3. Evaluation of original and fused NIR band by SF and COS methods
|
UIQI |
CC |
Minimum |
Maximum |
Standard deviation |
Original NIR |
1.00 |
1.00 |
195 |
811 |
87 |
SF |
0.98 |
0.98 |
170 |
854 |
88 |
COS |
0.84 |
0.95 |
275 |
649 |
52 |
There have been a few earlier studies for comparing the efficacy of image fusion algorithms. Z. Wang et al., [11], compared the performance of RGB-IHS, Brovey Transform (BT), High-Pass Filtering (HPF), High-Pass Modulation (HPM), Principal Component Analysis (PCA), À Trous Algorithm-Based Wavelet Transform (ATW) and proposed a new image merging technique – Multiresolution Analysis-Based Intensity Modulation (MRAIM). MRAIM was superior to the other 6 techniques discussed. On the other hand, MRAIM method was inferior to techniques such as High Pass Fusion and ATW, but better than Gram Schmidt (GS) Fusion, CN Spectral, and Luminance Chrominance as communicated in a different study conducted by U. Kumar et al., [12]. Another study by U. Kumar et al., [13] compared the usefulness of RGB-IHS, BT, HPF, HPM, PCA, Fourier Transformation and Correspondence Analysis and showed that HPF was the best among the seven techniques studied. All of the above experiments were conducted on IKONOS 1 m PAN and 4 m MS bands.
Comparison of nine fusion techniques – Multiplicative, BT, RGB-IHS, Pansharp, Local mean matching (LMM), LMVM, Modified IHS, Wavelet and PCA was conducted on QuickBird 0.7 cm PAN and 2.8 m MS images [3], which showed that LMVM, Pansharp and LMM algorithms gathered more advantages for fusion of PAN and MS bands, giving quite good results. However, our work in the current paper proves that SF is much better than LMVM for PAN and MS image fusion. S. Taylor et al., [14] compared BT, Hue Saturation Value, PCA and GS to map Lantana camara. The images were fused and classified into three categories: pasture, forest, and Lantana. Accuracy assessment showed that GS and PCA techniques were best at preserving the spectral information of the original MS image with highest kappa statistic. Another study was carried by A. Svab, [15] to compare IHS, BT and Multiplicative techniques and demonstrated that there is no single method or processing chain for image fusion. A good understanding of the principles of fusing operations, and especially good knowledge of the data characteristics, are compulsory in order to obtain the best results.
M. F. Yakhdani and A. Azizi [16] performed comparative study for IHS, Modified IHS, PCA, Wavelet and BT and found that Modified IHS could preserve the spectral characteristics of the source MS image as well as the HSR characteristics of the source PAN image and are suitable for fusion of IRS P5 and P6 images. In PCA and IHS image fusion, dominant spatial information and weak colour information is a problem, therefore, they should be used for applications such as visual interpretation, image mapping, and photogrammetric purposes. Y. Jinghui et al. [17] performed a general comparison of the pixel level fusion techniques – Component Substitution, Modulation and Multi-resolution Analysis (MRA) based fusion. They concluded that since automatic classification relies on the spectral feature than spatial details, modulation and MRA based techniques with a lower number of decomposition levels are preferable, which better preserve the spectral characteristics of MS bands. For visual interpretation, which benefits from spatial and textural details, CS and MRA techniques with a higher number of decomposition levels are appropriate.
A multi-sensor image fusion for PAN sharpening was done by comparing BT, PCA, Modified IHS, Additive wavelet proportional fusion, GS, Ehlers fusion and University of New Brunswick (UNB) fusion [18]. Various measures of accuracy assessment revealed that standard and most of the advanced fusion methods cannot cope with the demands that are placed on them by multi-sensor/multi-date fusion. The spectral distortions are manifold: brightness reversions, a complete change of spectral characteristics, artificial artifacts or unnatural and artificial colours, etc. Fusion methods such as PC, CN, GS or UNB should only be used for single-sensor, single-date images. Wavelet-based fusions can retain most of the spectral characteristics which comes unfortunately at the expense of spatial improvement. The wavelet method produced additional spatial artifacts instead of spatial improvements. This is probably caused by the wavelet characteristics.
While new methods of image fusion are being developed [
19], they should be capable of preserving radiometric and spatial resolutions of the fused
data. J. Zhang, [20] reviewed current techniques of multi-source data fusion and discussed their future trends and challenges through the concept of hierarchical classification, i.e., pixel/data level, feature level and decision level using optical PAN and MS data. The selection of an appropriate image fusion method depends on the application. One must use methods that provide suitable results for a defined purpose for better visualization and aids in image interpretation for more accurate mapping, finally improving classification accuracy.