The study area selected for urban classification is a part of Greater Bangalore having dense builtup, parks, roads, streets, flyovers, walk ways, open land, etc. Dense and medium urban areas have high surrounding temperature compared to vegetation patches, parks and lakes [6]. The undulating terrain in the city ranges from 735 to 970 m with varying textures due to different urban structures.
IKONOS data (700 x 700 dimension) and Landsat ETM+ MS data pertaining to a part of Greater Bangalore were used for urban classification. Ancillary layers such as elevation and its derived layers such as slope and aspect along with NDVI (Normalised Difference Vegetation Index), EVI (Enhanced Vegetation Index) and textures (ASM - angular second moment, contrast, entropy and variance) were used in separate experiments during classification as summarised in table 1 (for IKONOS data) and table 2 (for Landsat ETM+ data), respectively. Figure 1 shows False Colour Composite (FCC), NDVI, EVI, DEM (Digital Elevation Model), slope and aspect for the study area. EVI values were rescaled from 0 to 1. It is seen from figure 1 that EVI index highlight vegetation better than NDVI (in green colour) compared to FCC. The elevation in this area ranges from 883 to 940 m. Slope and aspect are represented in degrees.
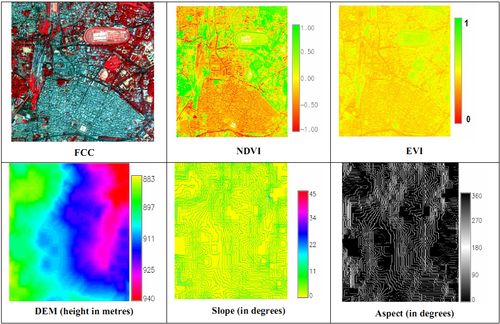
Figure 1. FCC, NDVI, EVI, DEM, slope and aspect added in IKONOS data classification as additional layers.
Table 1. Details of geographical layers used for IKONOS classification
| Classification No. |
RS data and ancillary geographical layers used |
Total number of input layers in the classification |
| 1 |
IKONOS bands 1, 2, 3, 4 |
4 |
| 2 |
IKONOS bands 1, 2, 3, 4, and NDVI |
5 |
| 3 |
IKONOS bands 1, 2, 3, 4, and EVI |
5 |
| 4 |
IKONOS bands 1, 2, 3, 4, and DEM |
5 |
| 5 |
IKONOS bands 1, 2, 3, 4, EVI, DEM |
6 |
| 6 |
IKONOS bands 1, 2, 3, 4, DEM, slope and aspect |
7 |
| 7 |
IKONOS bands 1, 2, 3, 4, DEM, slope, aspect and EVI |
8 |
| 8 |
IKONOS bands 1, 2, 3, 4, DEM and Texture (ASM, contrast, entropy, variance) at 0, 45, 90 and 135 degrees for IKONOS bands 1, 2, 3, 4 |
5+(4 x 4 x 4) = 69 |
Table 2. Details of data and ancillary layers used for Landsat ETM+ MS classification
| Classification No. |
RS data and ancillary geographical layers used |
Total number of input layers in the classification |
| 1 |
ETM+ bands 1, 2, 3, 4, 5 and 7 at 30 m |
6 |
| 2 |
ETM+ bands 1, 2, 3, 4, 5, 7 and Temperature |
7 |
| 3 |
ETM+ bands 1, 2, 3, 4, 5, 7, NDVI, EVI, elevation, slope and aspect |
11 |
| 4 |
ETM+ bands 1, 2, 3, 4, 5, 7, Temperature, NDVI, EVI, elevation, slope and aspect |
12 |
| 5 |
ETM+ bands 1, 2, 3, 4, 5, 7, Temperature, NDVI, EVI, elevation, slope and aspect,texture (ASM, contrast, entropy, variance) at 0, 45, 90 and 135 degrees for ETM+ bands 1, 2, 3, 4, 5, 7 |
108 |
| 6 |
ETM+ bands 1, 2, 3, 4, 5, 7, Temperature, NDVI, EVI, elevation, slope and aspect,texture (ASM, contrast, entropy, variance) at 0, 45, 90 and 135 degrees for ETM+ bands 1, 2, 3, 4, 5, 7 |
109 |
| 7 |
ETM+ bands 1, 2, 3, 4, 5, 7, Temperature, NDVI, EVI,ETM+ PAN, texture (ASM, contrast, entropy, variance) at 0, 45, 90 and 135 degrees for ETM+ bands 1, 2, 3, 4, 5, 7, and ETM+ PAN elevation, slope and aspect |
125 |
|

