IKONOS data classification
Figure 2 is the output from the eight classifications as explained in table 1 using SMAP. Figure 2 (Classification No. 1) is the classified output of IKONOS 4 bands. Classification No. 2 is the output after adding NDVI as an additional layer to the input in the classifier, where two classes are missing (asbestos roof and open area). Overall, blue plastic roof is over estimated as evident from figure 2 and area statistics in table 3.
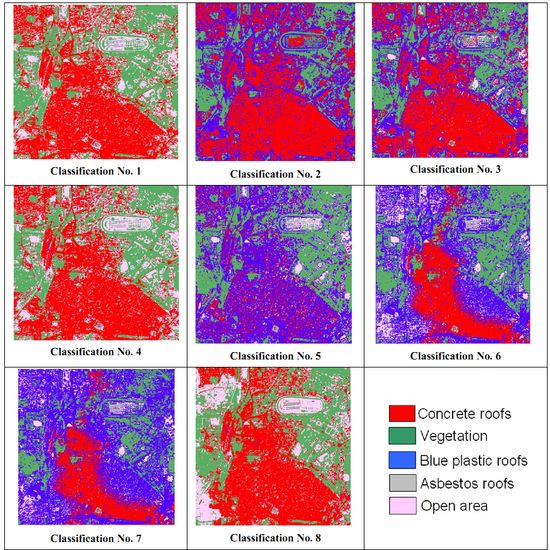
Figure 2. Classified outputs from IKONOS by adding additional geographical layers
Table 3. Area statistics from the IKONOS classified images
Class →
Area ↓ |
Concrete roof |
Asbestos roof |
Blue plastic roof |
Vegetation |
Open area |
Total |
| Classification No. 1 |
ha |
351.74 |
9.53 |
1.88 |
260 |
158.80 |
781.76 ha
(100%) |
| % |
44.99 |
1.22 |
0.24 |
33.26 |
20.66 |
| Classification No. 2 |
ha |
324.51 |
- |
285.02 |
172.23 |
- |
| % |
41.51 |
- |
36.46 |
22.03 |
- |
| Classification No. 3 |
ha |
299.89 |
7.26 |
259.32 |
188.17 |
27.11 |
| % |
38.36 |
0.93 |
33.17 |
24.07 |
3.47 |
| Classification No. 4 |
ha |
352.74 |
8.82 |
1.42 |
259.98 |
161.49 |
| % |
44.96 |
1.12 |
0.18 |
33.14 |
20.59 |
| Classification No. 5 |
ha |
84.53 |
11.20 |
385.11 |
244.86 |
56.06 |
| % |
10.81 |
1.43 |
49.26 |
31.32 |
7.17 |
| Classification No. 6 |
ha |
142.56 |
17.44 |
331.30 |
218.02 |
72.44 |
| % |
18.24 |
2.23 |
42.38 |
27.89 |
9.27 |
| Classification No. 7 |
ha |
126.17 |
16.13 |
433.22 |
146.88 |
59.36 |
| % |
16.14 |
2.06 |
55.42 |
18.79 |
7.59 |
| Classification No. 8 |
ha |
354.88 |
7.93 |
0.95 |
259.33 |
158.66 |
| % |
45.40 |
1.22 |
0.12 |
33.17 |
20.30 |
The role of NDVI in discriminating non-vegetation area is negligible and therefore asbestos and open areas have merged with concrete roof and blue plastic with a drastic decrease in overall accuracy (47%) as shown in table 4. When EVI was added as an additional derived layer, classification is better compared to the inclusion of NDVI. However, the class composition is either under estimated (concrete roof, vegetation and open area) or over estimated (blue plastic roof) lowering the overall accuracy to 55%. Blue plastic roof was also over estimated when both EVI and DEM were added as input layers along with the original bands. As evident from figure 2, concrete roof and open area have been misclassified and merged to blue plastic roof, which is dominant in the scene. Asbestos roof and vegetation are the two classeswhich showed higher producer’s and user’s accuracies. However, the overall accuracy still remained low (49.28%).
Table 4. Accuracy assessment of the IKONOS classified images
Class →
Accuracy ↓ |
Concrete roof |
Asbestos roof |
Blue plastic roof |
Vegetation |
Open area |
Overall Accuracy |
Kappa |
| Classification No. 1 |
| Producer’s accuracy (%) |
92.50 |
89.15 |
85.00 |
85.00 |
76.92 |
85.25 |
0.8250 |
| User’s accuracy (%) |
89.99 |
81.00 |
87.00 |
83.00 |
83.00 |
| Classification No. 2 |
| Producer’s accuracy (%) |
76.22 |
- |
17.01 |
48.55 |
- |
47.63 |
0.4136 |
| User’s accuracy (%) |
69.45 |
- |
21.97 |
51.33 |
- |
| Classification No. 3 |
| Producer’s accuracy (%) |
83.77 |
91.34 |
10.55 |
48.00 |
18.00 |
55.05 |
0.5117 |
| User’s accuracy (%) |
70.53 |
97.63 |
42.31 |
41.38 |
17.09 |
| Classification No. 4 |
| Producer’s accuracy (%) |
90.15 |
87.48 |
84.53 |
82.07 |
86.18 |
86.21 |
0.8437 |
| User’s accuracy (%) |
87.57 |
84.39 |
85.11 |
85.95 |
88.79 |
| Classification No. 5 |
| Producer’s accuracy (%) |
42.89 |
73.94 |
10.05 |
78.53 |
55.91 |
49.28 |
0.4577 |
| User’s accuracy (%) |
22.05 |
75.9 |
19.23 |
83.91 |
30.37 |
| Classification No. 6 |
| Producer’s accuracy (%) |
57.55 |
67.58 |
18.06 |
78.66 |
57.81 |
55.37 |
0.5322 |
| User’s accuracy (%) |
55.04 |
72.55 |
21.23 |
73.84 |
51.41 |
| Classification No. 7 |
| Producer’s accuracy (%) |
58.38 |
51.43 |
12.05 |
76.25 |
65.99 |
51.06 |
0.4719 |
| User’s accuracy (%) |
51.31 |
58.45 |
17.69 |
64.37 |
54.70 |
| Classification No. 8 |
| Producer’s accuracy (%) |
92.57 |
89.25 |
89.00 |
86.13 |
88.37 |
88.72 |
0.8615 |
| User’s accuracy (%) |
90.00 |
82.00 |
88.00 |
90.15 |
91.75 |
Similar situation prevails when DEM, slope and aspect were included with the input IKONOS MS bands to the classifier. Concrete roof, open area and vegetation are under estimated and blue plastic roof is over estimated, brining the overall accuracy to as low as 55%. The output worsens when DEM, slope, aspect with EVI were considered additionally to the input. All the classes are either over estimated or under estimated with overall accuracy of 51% (table 4). In classification No. 8, when only DEM and texture measures were added (table 1) as input to the classifier apart from IKONOS 4 MS bands, the overall accuracy went high to 88.72% with high producer’s and user’s accuracies for individual classes which were classified properly (table 3).
The above experiments conclude that in a highly urbanised area with less vegetation cover and highly contrasting features, texture plays a major role in discriminating individual classeswhich are rather difficult to distinguish using only original high
spatial resolution IKONOS MS bands as evident from high classification accuracies in table 4 (Classification No. 4 and 8 highlighted in bold), compared to the classification of only IKONOS 4 MS bands (Classification No. 1 highlighted in bold). DEM plays a role when the terrain is undulating but derived layers such as slope and aspect did not aid in discriminating classes when the elevation had low variance. Due to limited vegetation presence (a few parks) in the study area, EVI was not useful in classification. Overall 3.5% improvement in accuracy was observed after including elevation and texture along with the original bands as input to the classifier.
Landsat ETM+ data classification
Seven separate classifications were carried out with the different combinations of Landsat ETM+ bands and geographical layers as summarised in table 2. Landsat ETM+ PAN band was also added in the classification data set and the other 6 MS bands were resampled to 15 m. Finally, the texture measures from PAN band were included as input to classification, making the total number of geographical layers to 125. Figure 3 shows output from the seven classified images and LU statistics are listed in table 5. The producer’s, user’s, overall accuracies and kappa are given in table 6.
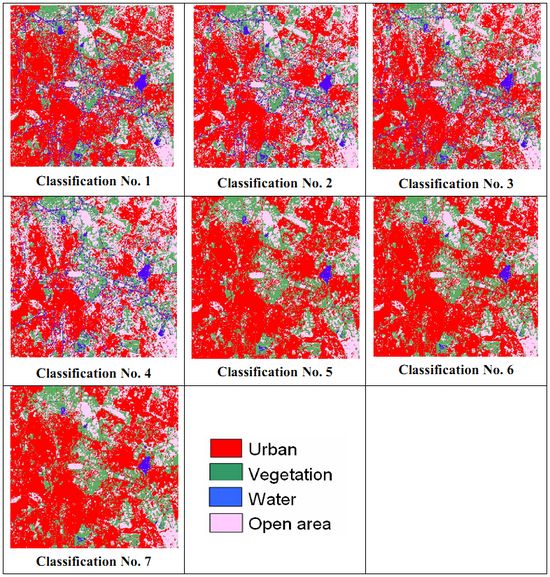
Figure 3. Classified outputs from Landsat ETM+ bands by adding additional geographical layers.
Table 6. Accuracy assessment of the Landsat ETM+ classified images
Class →
Accuracy ↓ |
Urban |
Vegetation |
Water |
Open area |
Overall Accuracy |
Kappa |
| Classification No. 1 |
| Producer’s accuracy (%) |
73.94 |
87.45 |
66.91 |
74.62 |
75.50 |
0.7309 |
| User’s accuracy (%) |
76.92 |
84.36 |
61.00 |
78.82 |
| Classification No. 2 |
| Producer’s accuracy (%) |
76.22 |
87.99 |
68.62 |
79.52 |
77.94 |
0.7548 |
| User’s accuracy (%) |
78.73 |
83.05 |
65.28 |
81.03 |
| Classification No. 3 |
| Producer’s accuracy (%) |
71.88 |
78.87 |
69.96 |
71.09 |
73.12 |
0.7101 |
| User’s accuracy (%) |
74.70 |
77.95 |
65.23 |
75.29 |
| Classification No. 4 |
| Producer’s accuracy (%) |
68.33 |
81.87 |
57.34 |
77.11 |
71.43 |
0.6811 |
| User’s accuracy (%) |
75.19 |
78.33 |
59.61 |
72.55 |
| Classification No. 5 |
| Producer’s accuracy (%) |
83.57 |
82.41 |
78.91 |
81.88 |
81.84 |
0.7978 |
| User’s accuracy (%) |
83.64 |
83.37 |
80.85 |
81.76 |
| Classification No. 6 |
| Producer’s accuracy (%) |
83.99 |
82.59 |
79.15 |
82.13 |
82.29 |
0..8077 |
| User’s accuracy (%) |
83.94 |
83.77 |
81.17 |
82.44 |
| Classification No. 7 |
| Producer’s accuracy (%) |
84.91 |
88.21 |
81.11 |
83.62 |
83.15 |
0.8125 |
| User’s accuracy (%) |
81.17 |
81.57 |
84.23 |
80.51 |
Figure 3 indicates that outputs obtained from the original spectral bands along with temperature, NDVI, EVI, elevation, slope and aspect (Classification No. 1, 2, 3 and 4) have misclassified many pixels belonging to builtup, water and open area. Many of the tarred or concrete road pixels that actually belong to builtup have been classified as water. Thus water class has been over estimated.
Addition of texture, PAN band and texture of PAN significantly improved the classification accuracy of all the classes including urban and water bodies as evident from table 5 (highlighted in bold). From accuracy assessment in table 6, we see that Classification No. 5, 6 and 7 have higher accuracies compared to other classifications. Inclusion of temperature increased accuracy whereas addition of vegetation index layers along with elevation, slope and aspect decreased the overall accuracy. When both temperature and vegetation index with elevation, slope and aspect were used, the accuracy still decreased. However, inclusion of texture and PAN significantly increased the overall accuracy. There was a 7.6% increase in accuracy by adding temperature, NDVI, EVI, elevation, slope, aspect, PAN along with texture measures, which proved to be useful for medium spatial resolution data such as ETM+ while discriminating different classes in an urban environment.
|


